

- EAER>
- Journal Archive>
- Contents>
- articleView
Contents
Citation
| No | Title |
|---|
Article View
East Asian Economic Review Vol. 24, No. 4, 2020. pp. 469-495.
DOI https://dx.doi.org/10.11644/KIEP.EAER.2020.24.4.388
Number of citation : 0View
72
Download
84
U.S. Macro Policies and Global Economic Challenges
|
|
University of Southern California and NBER |
|---|---|
|
|
Portland State University |

Abstract
This paper overviews different exit strategies for the U.S. from the debt-overhang, and analyses their implications for emerging markets and global stability. These strategies are discussed in the context of the debates about secular-stagnation versus debt-overhang, the fiscal theory of the price level, the size of fiscal multipliers, prospects for a multipolar currency system, and historical case studies. We conclude that the reallocation of U.S. fiscal efforts towards infrastructure investment aiming at boosting growth, followed by a gradual tax increase, aiming at reaching a modest primary fiscal surplus over time are akin to an upfront investment in greater long-term global stability. Such a trajectory may solidify the viability and credibility of the U.S. dollar as a global anchor, thereby stabilizing Emerging Markets economies and global growth.
JEL Classification: F33, F34, F41, F42, F55
Keywords
Debt Overhang, Emerging Markets, Macro Policies, Secular Stagnation, Global Currencies, Global Stability
HIGHLIGHTS
• We contrast two divergent US post COVID macroeconomics strategies: return to 2019 policies, versus a new two-pronged strategy.
• First prong – robust fiscal investment in high social payoff infrastructure investment with accommodating monetary stance.
• Second prong – following the resumption of growth, increasing over-time taxes, reaching down the road primary surpluses.
• The two-pronged policy is akin to upfront investment in greater long-term global stability
• It will solidify dollar’s global anchor positon and increase global stability.
According to the Manhattan Institute’s April 29, 2020 projection, the U.S. alone would run a budget deficit of $4.2 trillion, or 19% of its GDP – the largest share since the deficit peak during WWII. That would push the U.S. national debt held by the public to $41 trillion, or 128% of GDP, by 2030. This level of the national debt would exceed the level that occurred in 1946. With vaccinations for the virus in sight, it is time to ponder an effective economic exit strategy into the post-COVID era. This paper argues that given the size and the pivotal role of the U.S. dollar as the anchor of the global financial system, the road the U.S. will take will have overarching repercussions for the global economy. We illustrate these issues by reviewing two divergent U.S. post-COVID economic strategies, and the secular-stagnation versus debt-overhang debate. One may expect the realized path to be a weighted average of these strategies; the weights are affected by economic, social and political developments and shocks.
Framing our analysis in the context of the past two decades, we note that the ‘America First’ policy raised questions about the future role of the U.S. $ as the anchor of the global financial system. While some may view the November 2020 U.S. election outcome as a return to the pre-2016 global stance of the U.S., there remains ample uncertainty associated with a possible future return of “America First” populism. Furthermore, the prospects of a divided U.S. governance, where one party controls the House, and the other the Senate increases the risk of a legislative gridlock, intensifying headwinds working against the global dominance of the $.
Section 1 illustrates these issues by reviewing two divergent U.S. post-COVID macroeconomics strategies, and the secular-stagnation versus debt-overhang debate. Section 2 puts these strategies in the context of the on-going debates about the Fiscal Theory of the Price level, deflationary trends, and the challenges facing the Euro Zone. Section 3 links this discussion to the possible rise of new global currencies, and concludes.
1)The
2)
I. U.S. POST COVID ECONOMIC STRATEGIES AND GLOBAL STABILITY
Aizenman and Ito (2020) contrasted two divergent U.S. post COVID macroeconomics policies. The first is just ‘
The amplifications of a higher U.S. debt snowball effect into a sovereign default of EMs follow a similar script: sovereign spreads are determined by markets’ expectations, susceptible to ‘flight to quality’ and multiple equilibria. Affected countries are exposed to self-fulfilling prophecy dynamics associated with elevated sovereign spreads, where high enough sovereign spreads may morph liquidity crises into solvency crises. Left unchecked, these dynamics frequently propagate financial, banking, and currency calamities. The fragility of EMs was illustrated in the 1980s, when the U.S. disinflation triggered a lost growth decade for Latin America, inducing a drop of the annual GDP/Capita growth from 3% in 1970s, to – 1% in 1980s (Zettelmeyer, 2006). Similarly, the EZ crisis was a wakeup call for the growing exposure of the core EZ countries to the debt overhang of the GIIPS, putting in motion a self-fulfilling solvency crisis, backstopped by Mario Draghi’s “whatever it takes” speech on July 23, 2012 (see De Grauwe and Ji, 2013).
Alternatively, the U.S administration could adopt a two-pronged policy.
It may be tempting to presume that the new normal for the future comprises negative snowball effects associated with secular stagnation, as in Summers (2014). Accordingly, a decline in the full-employment equilibrium real interest rate coupled with low inflation could indefinitely prevent the attainment of full employment. This may reflect the confluence of several factors, including slower population growth, slower technological growth, and the drop in the relative prices of capital goods. Lower priced capital goods means that a given level of saving can purchase much more capital than was previously the case. Rising inequality operates to raise the share of income going to those with a lower propensity to spend. A rising desire on the part of central banks and governments to accumulate reserves coupled with conservative investment strategies operates to raise the demand for safe assets driving down safe interest rates. This effect is reinforced by requirements that encourage pension funds and insurance companies to hold their assets in safe bonds as to best match liabilities. The resultant drop in investment demand, and rise in saving induces low, possibly negative real interest rate, and deflationary biases. Ongoing disinflation also means that at any given real interest rate, real after-tax interest rates are higher. The path forward may include policies aiming at reducing real interest rates, and raising the demand by increasing investment and reducing saving. Blanchard (2019) provided a framework studying secular stagnation and debt policies, calling for a sizeable increase in debt financed fiscal policy, where the negative snowball effect associated with secular stagnation allows for running primary deficits without raising the public debt/GDP ratios.
Yet, there are several concerns to keep in mind. First, Wyplosz (2019) points out that negative snowball effects are not the rule; even in the U.S.,
An additional concern is that the record of predicting future changes of the snowball effects is mixed, at best.4 Presuming that the new normal is a negative snowball effect may increase the risk of a deeper future crisis over time. Specifically, with the illusive promise of ‘free fiscal lunch’ associated with negative snowball effects, governments may borrow more today, thereby increasing the exposure to costlier future crises. Similar dynamics occurred during the 1990s and early 2000s when the presumption of an enduring ‘Great Moderation’ infiltrated policymaking, inducing complacency and rapid increase of leverage ratios (see Rajan, 2006; Rogoff, 2015).5 Fiscal instability associated with unstable snowball effects was analyzed earlier by Barro (1979), Ball and Mankiw (1995), and Bohn (2008). They noted that the U.S. paid down a substantial portion of its debt by exploiting the differential between the interest rate on government debt and the growth rate of the economy. They caution that a government running a debt-Ponzi scheme when r < g might be subsequently faced with a sudden interest rate rise, necessitating a sharp and painful fiscal contraction.6
The history of the U.S. after WWII provides a vivid example of the success of a two-pronged approach in facilitating the exit from a public debt overhang, stabilizing the global economy, and solidifying the global role of the dollar. The rapid decline in public debt/GDP from 1946 to 1955, exhibited in Figure 2, was accommodated by financial repression inducing lower r, mild inflation (~ 4.2%), higher taxes, and robust GDP growth (Aizenman and Marion, 2011; Reinhart and Kirkegaard, 2012; Reinhart and Sbrancia, 2015; Reinhart et al., 2015). Figure 3 vividly shows the sharp drop of WWII U.S. fiscal revenue mobilization from 50% of GDP in 1944 towards 20% by 1946. This large revenue contraction was followed by an upwards trend, increasing the fiscal revenue/GDP to 35% in the 1970s. Remarkably, the U.S. government was running mostly primary fiscal surpluses during that period (Figure 4). These policies supported solid economic growth, reducing the public debt/GDP from 106% in 1946 to 23% in 1974. This post-WWII success story illustrates the feasibility and gains from a two-pronged fiscal strategy.
In contrast, during 1974-1984, the snowball effect became unsustainably high for many emerging market economies (EMs), triggering a series of financial crises. Aizenman and Ito (2020) investigated whether and to what extent the cost of serving the public debt affected real output growth. The flow cost of serving debt is estimated by the snowball effect times the public debt as a share of GDP. A higher flow cost of serving the debt may lead investors to question debt sustainability, raising the interest rate, reducing the growth rate, and further increasing the snowball effect. This negative feedback may induce costly market corrections, financial instability, and crisis. The emerging markets’ lost growth decade during the 1980s, and the euro area sovereign debt crisis affecting mostly the Southern euro area states illustrate these dynamics vividly.
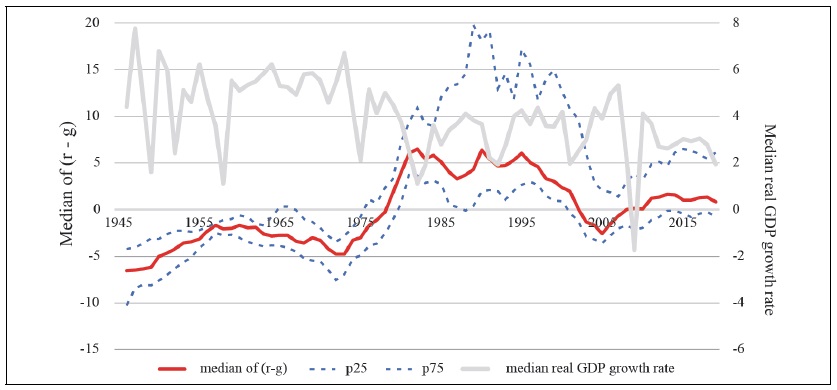
Figure 5 illustrates the post-WWII development of the interest-rate-growth differentials,
The grey solid line in Figure 5 is the median growth rate of real GDP (in local currency), measured by the right scale. A casual observation is that there is a negative correlation between real output growth and the interest-rate-growth differential. Our empirical work estimated the impact of a raise in the real GDP cost of serving sovereign debt associated with a rise of the snowball effect, Δ(
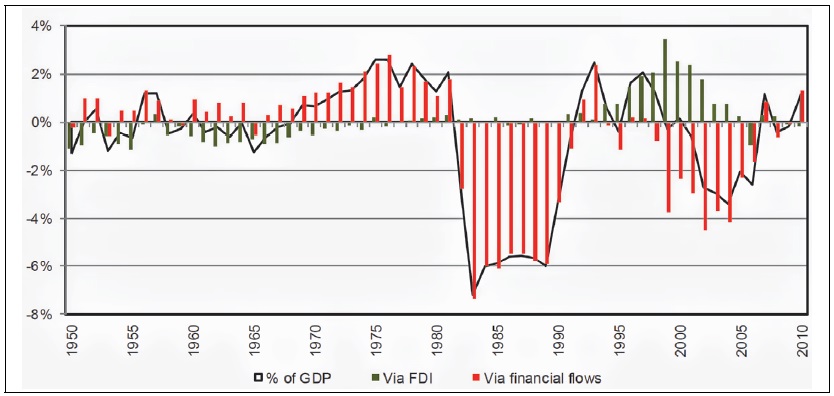
Figure 6 illustrates these issues by looking at the Net Resource Transfer/GDP to Latin America [LATAM], 1950-1990.10 The low interest rate in the U.S., following the petro-dollar glut associated with the 1974 sharp increase of oil prices by the OPEC cartel, induced growing external borrowing by LATAM and other emerging markets, resulting in an annual resource transfer of about 2% GDP points in LATAM during 1974-1978. This external funding contributed to a robust GDP/Capita growth of LATAM during the 1970s, at a rate of about 3%. Yet, it came with a growing accumulation of debt overhang, exposing LATAM to the full brunt of Volcker’s disinflationary policies aiming at curbing the double-digit U.S. inflation during 1979, crushing inflation to below 3% by 1983. This was facilitated by increasing the federal funds rate to about 20% in 1981, resulting in a sharp appreciation of the U.S. $, and a fast moving deep recession, reaching an unemployment rate of 10.5% in 1981. The impact of these steps on LATAM was devastating. The sharp increase in the borrowing interest rate, and LATAM’s large real exchange rate depreciation, coupled with the collapse of LATAM’s commodity terms of trade induced a perfect storm. The rapid rise of the U.S. snowball effect,
3)See
4)Notably,
5)
6)
7)For the interest rate, we use the 10-year government bond yields for the countries for which such data are available. The long-term interest rate data is limited in the case of EMs, especially those in Latin America and East Asia. Hence, to maximize the country coverage, we also use the lending rate. We measure potential output growth (g) with the growth rate of potential nominal GDP in U.S. dollars for which we use nominal GDP that is smoothed by applying the HP-filtering method.
8)The term △(
9)Higher real appreciation or lower depreciation rates reduce the domestic GDP cost of serving hard currency debt.
10)A net resource transfer is a current account deficit excluding any net interest payments.
11)Similar, though milder effects were documented in East Asia. By 1980 the S. Korean economy had entered a period of temporary decline: negative growth was recorded for the first time since 1962, inflation had soared, and the balance-of-payments position had deteriorated significantly
II. U.S. EXIT STRATEGY, FISCAL THEORY OF THE PRICE LEVEL AND DEFLATIONARY TRENDS
A common concern about exit strategies from the COIVD-19 crisis deals with the poor record of the ECB of reaching the 2% inflation target during the past decade. Similar though milder concerns apply to the U.S. FED. Are we doomed to be stuck at the zero lower boundary trap? Leeper (2020) provides an insightful interpretation for the Euro Zone [EZ] trap in the context of the fiscal policy of the price level. His starting point is that both monetary and fiscal policy issue interest-bearing liabilities deemed as relatively safe assets, in local currency controlled by the government. These liabilities are backed by the ability to tax the private sector, and by possible future budget surpluses. Thereby, the price level P must clear both the money and the bond markets. “In thinking about
Taking this perspective, the EZ failure to reach the targeted inflation reflects the dissonance between monetary and fiscal policies in the EZ. ECB’s monetary policy stance during the 2010s included zero and even negative policy interest rates, and large asset purchases. These policies induced negative bond yields of the core EZ countries from 2014, inducing a global ‘yield chasing’ by OECD savers. In 2019, a quarter of bonds issued by governments and companies worldwide were trading at negative yields (see Figure 7a and 7b).12 This deflationary bias was further magnified by tight fiscal policy, aiming at retiring debt as part of fiscal consolidation agenda, with a policy bias towards primary fiscal surpluses. In these circumstances, a desired inflation can be accomplished only as long as the expansionary monetary policy is backed properly by expansionary fiscal policy.
Applying Leeper’s interpretation, the two-pronged fiscal adjustment discussed in Section 1 entails in the first stage expansionary fiscal policy, with a properly accommodating monetary expansion, for the duration needed to a reach robust growth, with inflation reaching 2% and above. Once these goals would be reached, the second prong entails starting fiscal adjustment, raising taxes gradually. The goal is converging over time towards primary fiscal surpluses, at a speed that will keep supporting robust growth and mild inflation. The fine-tuning of this two-pronged path benefits by providing a mixed signal -- mild inflation above the missed target of 2% would be tolerated, but runaway inflation will be prevented by the willingness to move faster towards primary fiscal surplus. While some may view this path an impossible mission, U.S. post WWII policies show its feasibility. This view is in line with the FED’s formulation of new policy guidelines in August 2020, stating: “Our longer-run goal continues to be an inflation rate of 2 percent. Our statement emphasizes that our actions to achieve both sides of our dual mandate will be most effective if longer-term inflation expectations remain well anchored at 2 percent. However, if inflation runs below 2 percent following economic downturns but never moves above 2 percent even when the economy is strong, then, over time, inflation will average less than 2 percent. Households and businesses will come to expect this result, meaning that inflation expectations would tend to move below our inflation goal and pull realized inflation down. To prevent this outcome and the adverse dynamics that could ensue, our new statement indicates that we will seek to achieve inflation that averages 2 percent over time. Therefore, following periods when inflation has been running below 2 percent, appropriate monetary policy will likely aim to achieve inflation moderately above 2 percent for some time (Powell, 2020).”
The juxtaposition of ECB’s and FED’s inflationary trends below the target and the COVID-19 recession intensified calls for revising past economic presumptions. The use of ‘helicopter money’ was proposed to help combat the economic repercussions of the COVID-19 pandemic. While monetarist economists viewed this policy mostly as blasphemy in the past, Yashiv (2020) presented a political economy plan to break the taboo. Specifically, the creation of an emergency authority for central banks and the formation of a COVID-19 policy committee could help establish the policy as a one-off emergency money-financed plan, giving the central bank the authority to act quickly and then revert to the ‘no money-printing’ norm as the crisis subsides.
In the context of the EZ deflationary trends, De Grauwe and Diessner’s (2020) analysis pointed out that there is growing acceptance that some form of monetary finance is needed in light of the severity of the downturn in the euro area. Their analysis indicates that a monetization of the deficits induced by the COVID-19 crisis would eventually increase the price level. After a return to economic normalcy, inflation would rise for a couple of years, and this would be a price worth paying to avoid future sovereign debt crises in the euro area. They also expect that the ECB, as the most independent central bank in the world, would be well equipped to prevent the inflationary upsurge from becoming permanent.
These papers and the modified FED’s inflation targeting initiated in 2020 reflect the growing fears about deflationary biases, at times of substantial increase in debt overhang of the private and public sectors. These concerns are also in line with Fisher’s (1933) “Debt-deflation Theory of Great Depressions,” recommending inflation as a way to mitigate deflationary spirals. Leeper (2020) credits FDR with starting the U.S. recovery from the Great Depression 1933 by his decision to abrogate gold clauses in debts. The new policy induced a 59% devaluation of the dollar value of gold, making it clear that there would be no return to the old gold parity. Edwards (2018) recounts the evolving debates and litigations associated with the U.S. default on the gold clause.
While the inflationary trend induced by devaluing the U.S. $ by FDR policies resumed growth and reduced unemployment, it was not enough to end the Great Depression. At the eve of the Pearl-Harbor attack in December 1941, the U.S. unemployment was around 10%. The ultimate reduction of U.S. unemployment to pre-Great-Depression levels was the outcome of the massive fiscal stimulus associated with the U.S. War effort, started with the resource mobilization during and after 1941 (Vernon, 1994; Ohanian, 1997). This sequence illustrates that a faster exit from depressions benefits from coordinated fiscal and monetary stimuli, and that fiscal multipliers are larger in deeper recessions (Auerbach and Gorodnichenko, 2012). This result is also in line with Nakamura and Steinsson (2014), finding open economy fiscal multiplier of approximately 1.5, and that the closed economy aggregate multiplier is highly sensitive to how strongly aggregate monetary and tax policy ‘leans against the wind.’
Institutional factors in a federal system play a role in determining the ultimate fiscal stimuli, as local states may be constrained in their ability to spend. The U.S. delivered a very small fiscal expenditure stimulus during the Great Recession compared with its peers, despite being the epicenter of the crisis and enjoying “exorbitant privilege.” Contraction of state and local spending in the U.S. substantially negated the expansion by the federal government, leading to negligible net fiscal stimulus by the consolidated government during 2009Q1–2010Q1, reflecting the particular nature of the U.S. fiscal federation (Aizenman and Pasricha, 2013). Notably, the end of the WWII effort and the return of the GIs to the civilian labor market raised deflationary concerns -- the U.S. long-term Government interest rate dropped from 2.5% in 1945 to 2.1% in 1946 (Toma, 1992). Markedly, the implementation of a dynamic fiscal policy properly buffered with monetary policy prevented the return to recessionary times after 1945.
12)Starting in 2014, the ECB cut its interest charged on bank reserves five times below zero, reaching – 0.5% by 6/2020 [Bloomberg (August 4, 2020)
III. U.S. EXIT STRATEGIES, GLOBAL CURRENCIES, AND CONCLUDING REMARKS
The first decade of the 21th Century was dominated by two unprecedented global economic developments. First, China’s WTO accession in 2000-2001 accelerated China’s export led growth rate, supported by growing current account surpluses (Feng et al., 2017). By 2005, China reached annual growth rates of 10%, becoming over time ‘The World’s Factory,13 rapidly approaching the GDP size of the U.S. and the EU, PPP adjusted.
The second development was the emergence of the euro as a major new global currency. In 2006, Euro’s virtues were promoted by a senior member of the Executive Board of the ECB, Otmar Issing, stating that the Euro matured into a major success story.14 The celebratory assessment of the euro continued well into its tenth-year anniversary (Weber, 2008), but was dampened shortly after by the unfolding Eurozone crisis.
These developments raised the prospect of convergence towards a tri-polar world, dominated by 3 blocks, U.S., Eurozone, and China, each of them producing about 20% of global GDP, PPP adjusted. The World Bank’s (2011) Global Development Horizons report predicted a convergence towards
Taking stock of these predictions, by 2020 the dollar remained a pivotal anchor of the global financial system. A version of Lin’s prediction
The limited cooperation between the U.S., the Euro Zone and China is not a surprise, as global cooperation is limited, and predicted gains in practice are hard to negotiate. Frankel (2015) attributed shrinking global cooperation to countries disagreeing on the potential gains from coordination, “particularly because side payments in a global context are challenging to implement. These issues are likely to arise in situations where economic conditions differ across countries, creating differences in desirable fiscal or monetary policies among countries. In these instances, the scope for successful policy coordination may be limited.” Aizenman (2016) noted that in normal times, cooperation is associated with welfare gains akin to Harberger’s second-order magnitude triangle, and as such, the odds of cooperation are low. In circumstances in which bad tail events may induce an imminent collapse of the international financial system, the perceived losses have a first-order magnitude of terminating the total Marshalian surplus. This imminent threat may promote international cooperation, as was illustrated by the FED’s unprecedented supply of elastic swap lines to the ECB during the Global Financial Crisis. Similarly, the concerns regarding the economic cost of ignoring Europe WWII distraction induced the victors of WWII to negotiate the Bretton Woods agreement in 1944.
Jeanne (2012) concluded that an ideal global currency should have a proper combination of the following virtues: Liquid and safe; supplied in sufficient quantity; and delivering an ‘appropriate return.’ The depth and liquidity of the global bond market in a specific currency is a necessary condition for a vibrant global currency. Supplying the global currency entails also the provision of a global public good, granting the suppliers the benefit of the ‘exorbitant privilege’ (Eichengreen, 2011). At times of global peril, the public good is manifested by the willingness to provide global insurance at a ‘reasonable cost.’ Applying Jeanne’s framework, during the global financial crisis the U.S. provided important global insurance services: Bailing out Fannie Mae, Freddie Mac, and AIG in ways that shielded China and the Euro block, and providing Swap lines to 4 EMs and OECD countries (Gourinchas et al., 2010).
Yet, the record of the U.S. performance in providing the global public services associated with the global position of the U.S. dollar by 2020 is mixed. The “America First” policy induced BRICS to reduce their dependence overtime the on U.S. dollar, diversifying towards higher Gold reserves and other assets. Investable EMs also reduced their balance sheet exposure to the U.S. dollar, a process facilitated by a rapid increase of external borrowing in terms of their local currencies. This trend was magnified by the OECD countries’ quantitative easing (QE) policies slashing their interest rates towards zero and below, propagating ‘yield chasing’ by their households and financial institutions, compressing risk premia, and increasing the attractiveness of EMs’ local currency debts. Cavalier attitude to U.S. public debt management, the prospect of the U.S. divided governance between two parties at times of disappearing middle ground, and the possible future return of “America First” policies may debase the U.S. status as a stable safe haven providing global public services.15 Notably, China became in the past decade a major supplier of Yuan swap lines and debt funding to Emerging Markets and Developing countries. This is part of complex Chinese bundling arrangements, supplying finance and liquidity to outward FDI, and to the export of infrastructure construction services and capital goods to previously underserved countries (Aizenman et al., 2018; Horn et al., 2019).
Figure 8 plots the Real Effective Exchange Rates for the U.S. [Blue], China [Red] and the EZ [dotted green] during 1994-2020, where higher values indicate more appreciated real exchange rate. During that period, the Yuan was the currency that exhibited a clear real appreciation trend, while the U.S. and EZ real exchange rates fluctuated but were mostly trendless. Remarkably, the correlation between the U.S. and Chinese real exchange rates was positive and high, 0.74 before 2008, and 0.7 after 2008. In contrast, the correlation between the U.S. and the EZ exchange rates was negative, and sizable, – 0.8 before 2008, and – 0.5 after. These trends are consistent with viable gains in deeper global portfolio diversification, and in line with the rise in the demand for equities and bonds of investable EMs.16
Yet, the prospects of rapid increase in the global share of the euro and the yuan are challenged by their limited supply. ECB’s aggressive QE policies in the past decade reduced the supply of sovereign euro denominated bonds. The absence of deep euro sovereign bonds backed-stopped by the EU or the ECB limits the threat poised by the euro to the dollar’s dominance. The slow convergence towards a Yuan convertibility, and the limited though rising foreign participation in China’s Stock and Bond Markets restrain the viability of the Yuan as a global currency.17 Thereby, unlike Lin’s conjecture of converging by 2025 to a genuine tri-polar global currency world, it would take probably decades for the global share of the U.S. dollar to decline below half. Instead, we probably will witness the U.S., the Euro Zone and China competing with each other for a greater dominance of their corresponding currency and financial system within their geographic and geo-political periphery.
Some may view this as a second best outcome (Campanella, 2014). Yet, it may come with greater global uncertainty associated with a resultant limited supply of ‘public goods’ services induced by growing competition among the three global blocks. This concern is in line with Kindleberger’s (1981, 1986)’s hegemonic stability hypothesis, and his interpretation of the inter-wars financial instability. Krugman (1984) illustrated that the economies of scale associated with global currencies imply possible multiple equilibria of global vehicle currencies, concluding that the choice of a vehicle currency reflects both history and hysteresis.18 These observations are consistent with a persistence of the dollar dominance despite the sharp decline in the global GDP share of the U.S. Yet, it also suggests that adverse shocks and policy blunders may hasten dislodging dollar’s dominance. Such blunders may induce China to move faster towards greater convertibility, and the EZ to adopt a version of Eurozone bonds, possibly along Delpla and von Weizsäcker’s (2011) blue euro bond suggestion. 19 This transition may involve greater global instability, in line with Krugman’s (1984) reflection that “The moral, then, seems to be that it is not a collapsed but a collapsing role of the dollar that we should worry about.”
While we focused on two possible divergent U.S. macroeconomics policies in the post-COVID era, there should be many variations of fiscal and monetary policies, depending upon how the U.S. Treasury department and the Fed react ‘independently.’ For example: (1) No tax increase with a continuous quantitative easing (QE) and zero federal funds rate targeting. (2) A rapid tax increase with a rather rapid tapering off, transitioning out of QE policies to a more normal monetary policy. (3) A gradual tax increase with a smooth tapering off. (4) A gradual tax increase with a rapid tapering off. In the context of our discussion, deeper and longer QE is akin to financial repression and accommodative monetary policy (Reinhart and Sbrancia, 2015). Other things being equal, higher and longer QE policies would deliver lower snowball effects, allowing for larger fiscal stimuli for a given primary deficit.
There are several notable challenges associated with higher and longer QE. First, it requires a deeper coordination between the Treasury and the FED, running the risk of trimming the FED’s independence, a strategy that may be challenged by divided future governance in the U.S. Second, higher and longer QE would increase the search for yields, inducing higher private sector debt-to-GDP-ratio. This in turn would magnify moral hazard concerns regarding deeper bailouts in a future financial crisis, increasing the tail risk of global financial crisis (Rajan, 2006). Finally, it may induce deeper income and wealth inequalities associated with subsidizing private leverage by providing a subsidized Central Bank “financial put option.” This public sector put option is effective at stabilizing asset prices locally by boosting bank leverage. However, as ever-increasing leverage cannot be sustained indefinitely, future negative shocks may cause prices to fall drastically and volatility to surge. Thus, the FED’s financial put option reduces volatility in the short run at the potential expense of greater instability in the long-run. It also implies a larger step-increase of public debt/GDP triggered by a future financial crisis, when larger private losses would be socialized (Drechsler et al., 2018; Alvaredo et al., 2018). These dynamics may contribute to greater political polarization, increasing the odds of a future return of the ‘America First’ populism, and to greater global concerns regarding the future viability of the dollar as a safe global anchor. All these factors increase the benefit of the two pronged exit strategy outlined in our paper, where the goal of reaching future primary fiscal surplus may reducing global tail risks.
Looking forward, the U.S. fiscal policy described above, coupled with a properly accommodating monetary policy may deliver a trajectory that
13)According to data published by the United Nations Statistics Division, China accounted for almost 30 percent of global manufacturing output in 2018.
14)The opening speech of
15)Trump’s cavalier attitude to the U.S. dollar global position echoes President Nixon's Treasury Secretary, John Connally, stating in 1971 that the “
16)By the end of 2020, Vanguard, the largest provider of mutual funds, recommended in 2020 to U.S. portfolio investors (accessed November 21, 2020): “To get the full diversification benefits, we recommend that you consider investing about 40% of your stock allocation in international stocks and about 30% of your bond allocation in international bonds.”
17)
18)
19)According to the Blue bond proposal, sovereign debt in euro area countries is to be split into two parts. The first part, the senior tranche of up to 60% of GDP, would be pooled among participating countries and jointly and sovereignly guaranteed. The second part, the junior tranche, would keep debt in excess of 60% of GDP a purely national responsibility. This would imply the transformation of the Sovereign Bonds of EZ members valued by 60% of the EZ GDP into a mutualized Eurobond, backstopped by EZ wide taxes, analogous to Hamilton’s creation of the U.S. Treasury bond market. See also
Tables & Figures
Figure 1.
Global Debt-to-GDP Ratio
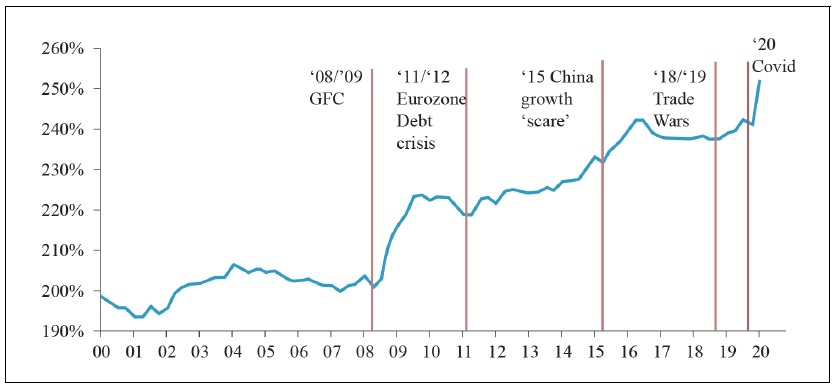
Source: BofA Global Research, BIS. Sample of 46 economies. Non-financial sector only. <
Figure 2.
U.S. national debt projection, September 2020
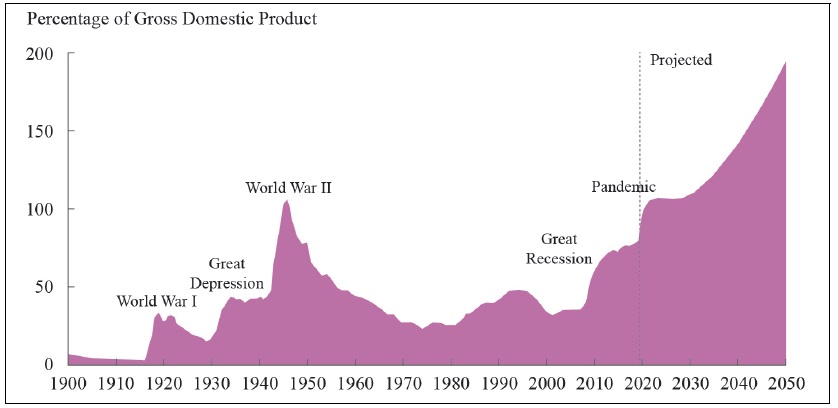
Source: Congressional Budget Office report, September 2020
Figure 3.
Total government spending and revenues as a % of GDP
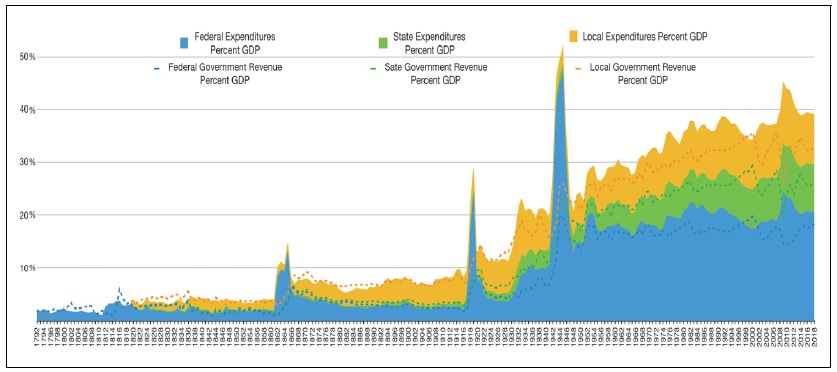
Source:
Figure 4.
U.S. fiscal surpluses/GDP after WWII
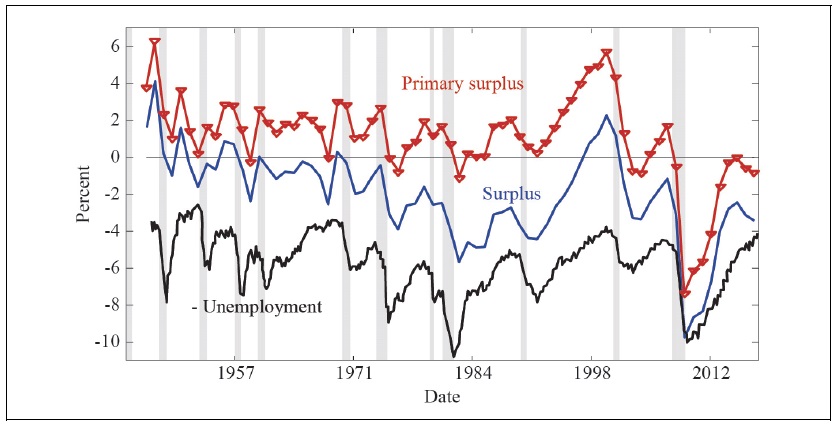
Source:
Figure 5.
The interest-rate-growth differential (percentage points)
Source:
Figure 6.
Net Resource Transfer (% of GDP at current prices)
Source:
Figure 7a.
European Sovereign Bond yields, November 2015
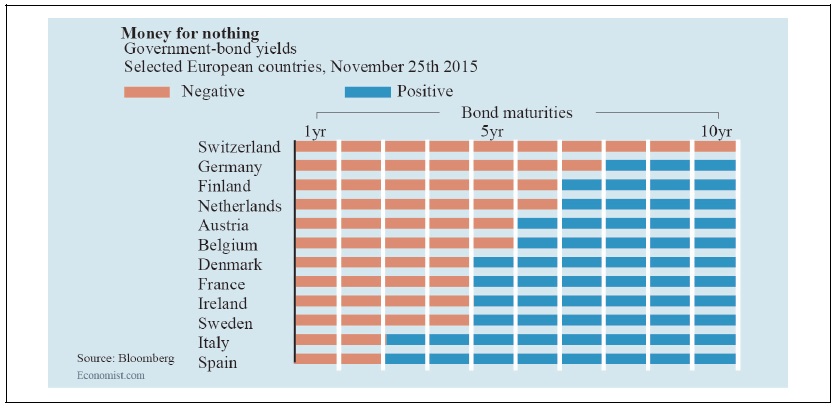
Source: The Economist (November 28, 2015)
Figure 7b.
In 2019, a quarter of bonds issued by governments and companies worldwide were trading at negative yields
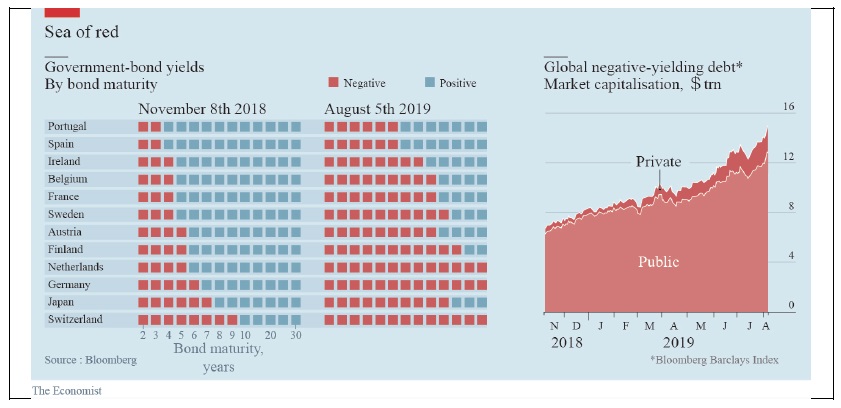
Source: The Economist (August 8, 2019)
Figure 8.
Real Effective Exchange Rates
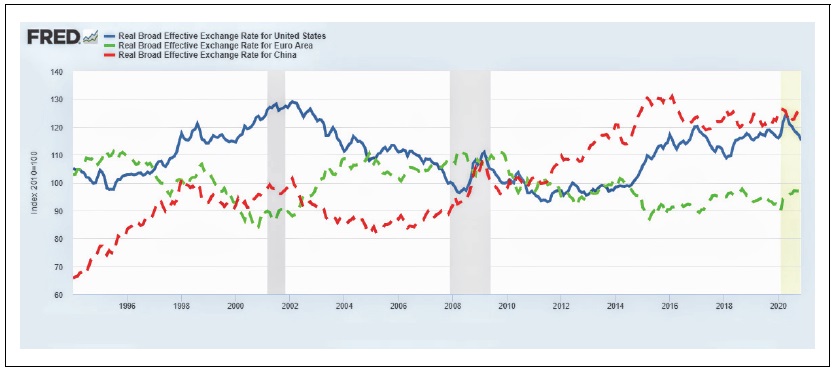
U.S. recessions are shaded; the most recent end date is undecided.
Source: Bank of International settlements.
References
-
Aizenman, J. 2016. “International Coordination and Precautionary Policies,”
International Economic Journal , vol. 30, no. 3, pp. 379-391.
-
Aizenman, J. and G. K. Pasricha. 2013. “Net Fiscal Stimulus during the Great Recession,”
Review of Development Economics , vol. 17, no. 3, pp. 397-413.
- Aizenman, J. and H. Ito. 2020. Post COVID-19 Exit Strategies and Emerging Markets Economic Challenges. NBER Working Paper, no. 27966.
-
Aizenman, J. and N. Marion. 2011. “Using Inflation to Erode the US Public Debt,”
Journal of Macroeconomics , vol. 33, no. 4, pp. 524-541.
-
Aizenman, J., Jinjarak, Y. and H. Zheng. 2018. “Chinese Outwards Mercantilism–The Art and Practice of Bundling,”
Journal of International Money and Finance , vol. 86, pp. 31-49.
-
Alvaredo, F., Chancel, L., Piketty, T., Saez, E. and G. Zucman. (eds.) 2018.
World Inequality Report 2018 . Cambridge, MA: Harvard University Press. -
Auerbach, A. J. and Y. Gorodnichenko. 2012. “Fiscal Multipliers in Recession and Expansion.” In Alesina. A. and F. Giavazzl. (eds.)
Fiscal Policy after the Financial Crisis . Chicago: University of Chicago Press. pp. 63-102. -
Baldwin, R and B. W. di Mauro. 2020.
Economics in the Time of COVID-19 . London: VoxEU.org eBook, CEPR Press. -
Ball, L. and N. G. Mankiw. 1995. “What Do Budget Deficits Do?” In
Proceedings-Economic Policy Symposium-Jackson Hole, August 31-September 2 , 1995. Federal Reserve Bank of Kansas City. pp. 95-119. -
Barro, R. J. 1979. “On the Determination of the Public Debt,”
Journal of Political Economy , vol. 87, no. 5, (Part 1), pp. 940-971.
-
Blanchard, O. 2019. “Public Debt and Low Interest Rates,”
American Economic Review , vol. 109, no. 4, pp. 1197-1229.
-
Bohn, H. 2008. “The Sustainability of Fiscal Policy in the United States.” In Neck R. and J.-E. Sturm. (eds.)
Sustainability of Public Debt . Cambridge, MA: MIT Press, pp.15-49. -
Calvo, G and R. Loo-Kung. 2010. “US Recovery: A New ‘Phoenix Miracle’?” VoxEU.org, 12 April. <
https://voxeu.org/article/us-recovery-new-phoenix-miracle > (accessed October 21, 2020) -
Campanella, M. 2014. “The Internationalization of the Renminbi and Prospects for A Multipolar Currency System,”
Journal of Self-Governance and Management Economics , vol. 2, no. 3, pp. 72-93. -
Capolongo, A., Eichengreen, B. and D. Gros. 2020. “Safely Increasing the Supply of Safe Assets: Internationalising the Euro in the Age of COVID-19.” VoxEU.org, 23 October. <
https://voxeu.org/article/internationalising-euro-age-covid-19 > (accessed November 21, 2020) -
Carney, M. 2019. “The Growing Challenges for Monetary Policy in the Current International Monetary and Financial System.” In
Proceedings-Economic Policy Symposium-Jackson Hole, August 22-24, 2019 . Federal Reserve Bank of Kansas City. pp. 295-329. - Cerutti, E. M. and M. Obstfeld. 2018. China’s Bond Market and Global Financial Markets. IMF Working Paper, no. 18/253.
-
Chitu, L., Eichengreen, B. and A. Mehl. 2014. “One or Multiple International Currencies? Evidence from the History of the Oil Market.” VoxEU.org, 17 March. <
https://voxeu.org/article/there-room-more-one-international-currency > (accessed October 21, 2020) -
Cochrane, J. 2020. “Perpetuities, debt crises, and inflation.” The Grumpy Economist, 8 June. <
https://johnhcochrane.blogspot.com/2020/06/perpetuities-debt-crises-and-inflation.html > (accessed October 21, 2020) -
Cordella, T., Ricci, L. A. and M. Ruiz-Arranz. 2010. “Debt Overhang or Debt Irrelevance?”
IMF Staff Papers , vol. 57, no. 1, pp. 1-24.
-
Das, S. 2018. “How the U.S. Has Weaponized the Dollar.” Bloomberg. 6 September. <
https://www.bloomberg.com/opinion/articles/2018-09-06/how-the-u-s-has-made-aweapon-of-the-dollar > (accessed October 21, 2020) -
De Grauwe, P. and S. Diessner. 2020. “What Price to Pay for Monetary Financing of Budget Deficits in the Euro Area.” VoxEU. 18 June. <
https://voxeu.org/article/what-price-paymonetary-financing-budget-deficits-euro-area > (accessed October 21, 2020) -
De Grauwe, P. and Y. Ji. 2013. “Self-fulfilling Crises in the Eurozone: An Empirical Test,”
Journal of International Money and finance , vol. 34, pp. 15-36.
- Delpla, J. and J. Von Weizsäcker. 2011. Eurobonds: The Blue Bond Concept and Its Implications. Bruegel Policy Contribution, issue. 1011/02.
-
Drechsler, I., Savov, A. and P. Schnabl. 2018. “A Model of Monetary Policy and Risk Premia,”
Journal of Finance , vol. 73, no. 1, pp. 317-373.
-
Edwards, S. 2018.
American Default: The Untold Story of FDR, the Supreme Court, and the Battle over Gold . Princeton: Princeton University Press. -
Eichengreen, B. 2011.
Exorbitant Privilege: The Rise and Fall of the Dollar and the Future of the International Monetary System . Oxford: Oxford University Press. - Escolano, J. 2010. A Practical Guide to Public Debt Dynamics, Fiscal Sustainability, and Cyclical Adjustment of Budgetary Aggregates. IMF Technical Notes and Manuals.
-
Feng, L., Li, Z. and D. L. Swenson. 2017. “Trade Policy Uncertainty and Exports: Evidence from China's WTO Accession,”
Journal of International Economics , vol. 106, pp. 20-36.
-
Fisher, I. 1933. “The Debt-Deflation Theory of Great Depressions,”
Econometrica , vol. 1, no. 4, pp. 337-357.
-
Frankel, J. 2011. “Historical Precedents for Internationalization of the RMB.” In
a Council on Foreign Relations/China Development Research Foundation Symposium, The Future of the International Monetary System and the Role of the Renminbi, Beijing (Vol. 1). -
Frankel, J. 2015. “International Coordination.” In Glick, R. and M. M. Spiegel. (eds.)
Policy Challenges in A Diverging Global Economy . Asia Economic Policy Conference San Francisco November 19-20, 2015. Federal Reserve Bank of San Francisco. -
Ghosh, A. R., Kim, J. I., Mendoza, E. G., Ostry, J. D. and M. S. Qureshi. 2013. “Fiscal Fatigue, Fiscal Space and Debt Sustainability in Advanced Economies,”
Economic Journal , vol. 123, no. 566, pp. F4-F30.
- Gourinchas, P.-O., Rey, H. and N. Govillot. 2010. Exorbitant Privilege and Exorbitant Duty. IMES Discussion Paper, no. 2010-E-20. Tokyo: Institute for Monetary and Economic Studies, Bank of Japan.
-
Gros, D. and C. Alcidi. 2010. “Is Greece Different? Adjustment Difficulties in Southern Europe.” VoxEU.org, 22 April. <
https://voxeu.org/article/greece-different-adjustment-difficultiessouthern-europe > (accessed October 21, 2020) - Horn, S., Reinhart, C. M. and C. Trebesch. 2019. China’s Overseas Lending. NBER Working Paper, no. 26050.
- Issing, O. 2008. The Euro: A Currency without a State. CFS Working Paper, no. 2008/51. Center for Financial Studies (CFS).
-
Jeanne, O. 2012. “The Dollar and Its Discontents,”
Journal of International Money and Finance , vol. 31, no. 8, pp. 1976-1989.
-
Jorda, O., Schularick, M. and A. M. Taylor. 2015. “Leveraged Bubbles,”
Journal of Monetary Economics , vol. 76, pp. S1-S20.
-
Kindleberger, C. P. 1981. “Dominance and Leadership in the International Economy: Exploitation, Public Goods, and Free Rides,”
International Studies Quarterly , vol. 25, no. 2, pp. 242-254.
-
Kindleberger, C. P. 1986.
The World in Depression, 1929-1939 . Berkeley: University of California Press. -
Kose, M. A., Nagle, P., Ohnsorge, F. and N. Sugawara. 2020.
Global Waves of Debt: Causes and Consequences . World Bank Publications. <https://www.worldbank.org/en/research/publication/waves-of-debt > (accessed October 21, 2020) -
Krugman, P. 1984. “The International Role of the Dollar: Theory and Prospect.” In Bilson, J. and R. C. Marston. (eds.)
Exchange rate theory and practice . Chicago: University of Chicago Press. pp. 261-278. -
Leeper, E. M. 2020. “How to Stop Deflation with Fiscal Policy: Past Lessons for the Future.” Hoover Institution, November webinar. <
htps://www.hoover.org/sites/default/files/leeper_jlpslides_hoover2020.pdf > (accessed December 2, 2020) -
Mussa, M. 2009. “Is the “Chicago School” to Blame in the Economic Crisis?” Recorded October 14, 2009. Peterson Institute for International Economics. <
https://www.piie.com/publications/papers/pp20091014mussa.pdf > (accessed October 21, 2020) -
Nakamura, E. and J. Steinsson. 2014. “Fiscal Stimulus in a Monetary Union: Evidence from US Regions,”
American Economic Review , vol. 104, no. 3, pp. 753-92.
-
Ocampo, J. A. 2014. “The Latin American Debt Crisis in Historical Perspective.” In Stiglitz, J. E. and Heymann, D. (eds.)
Life After Debt . London: Palgrave Macmillan. pp. 87-115. -
Ohanian, L. E. 1997. “The Macroeconomic Effects of War Finance in the United States: World War II and the Korean War,”
American Economic Review , vol. 87, no. 1, pp. 23-40. -
Powell, J. H. 2020. “New Economic Challenges and the Fed’s Monetary Policy Review.” Speech, August 27, 2020. Board of Governors of the Federal Reserve System. <
https://www.federalreserve.gov/newsevents/speech/powell20200827a.htm > (accessed October 21, 2020) -
Rajan, R. G. 2006. “Has Finance Made the World Riskier?”
European Financial Management , vol. 12, no. 4, pp. 499-533.
-
Reinhart, C. and J. Kirkegaard. 2012. “Financial Repression: Then and Now.” VoxEU.org, 16 March. <
https://voxeu.org/article/financial-repression-then-and-now > (accessed October 21, 2020) -
Reinhart, C. M., Reinhart, V. and K. Rogoff. 2015. “Dealing with Debt,”
Journal of International Economics , vol. 96, suppl. 1, pp. S43-S55.
-
Reinhart, C. M. and M. B. Sbrancia. 2015. “The Liquidation of Government Debt,”
Economic Policy , vol. 30, no. 82, pp. 291-333.
-
Rey, H. 2001. “International Trade and Currency Exchange,”
Review of Economic Studies , vol. 68, no. 2, pp. 443-464.
-
Rogoff, K. 2015. “Debt Supercycle, Not Secular Stagnation.” VoxEU.org, 22 April. <
https://voxeu.org/article/debt-supercycle-not-secular-stagnation > (accessed October 21, 2020) -
Savada, A. M. and W. Shaw. (eds.) 1997.
South Korea: A Country Study . Washington, DC: US Government Printing Office. -
Sims, C. 2020. “How to Worry about Government Debt.” Princeton University Bendheim Center for Finance, 15 October. <
https://bcf.princeton.edu/events/christopher-sims-how-toworry-about-government-debt > (accessed October 21, 2020) -
Summers, L. H. 2013. “On Secular Stagnation.” Reuters, 16 December. <
http://blogs.reuters.com/lawrencesummers/2013/12/16/on-secular-stagnation > (accessed October 21, 2020) -
Summers, L. H. 2014. “Reflections on the New ‘Secular Stagnation Hypothesis’” VoxEU.org, 30 October. <
https://voxeu.org/article/larry-summers-secular-stagnation > (accessed October 21, 2020) -
Toma, M. 1992. “Interest Rate Controls: The United States in the 1940s,”
Journal of Economic History , vol. 52, no. 3, pp. 631-650.
-
Vernon, J. R. 1994. “World War II Fiscal Policies and the End of the Great Depression,”
Journal of Economic History , vol. 54, no. 4, pp.850-868.
- Weber, A. 2008. “The Eurosystem and its Prospects–History in the Making.” Keynote Speech, 18th Conference of the European Association for Banking and Financial History e. V. Frankfurt am Main, May 30, 2008.
-
World Bank. 2011.
Global Development Horizons 2011: Multipolarity-The New Global Economy . -
Wyplosz, C. 2019. “Olivier in Wonderland.” VoxEU.org, 17 June. <
https://voxeu.org/content/olivier-wonderland > (accessed October 21, 2020) -
Yashiv, E. 2020. “Breaking the Taboo: The Political Economy of COVID-Motivated Helicopter Drops.” VoxEU.org, 26 March. <
https://voxeu.org/article/political-economy-covid-motivatedhelicopter-drops > (accessed October 21, 2020) - Zettelmeyer, J. 2006. Growth and Reforms in Latin America: A Survey of Facts and Arguments. IMF Working Paper, no. 06/210.