

- EAER>
- Journal Archive>
- Contents>
- articleView
Contents
Citation
| No | Title |
|---|---|
| 1 | Policy Suggestions to Improve Patient Access to New Drugs in Korea / 2021 / Korean Journal of Clinical Pharmacy / vol.31, no.1, pp.1 / |
Article View
East Asian Economic Review Vol. 24, No. 2, 2020. pp. 127-164.
DOI https://dx.doi.org/10.11644/KIEP.EAER.2020.24.2.374
Number of citation : 1View
209
Download
88
The Health Impact of, and access to, New Drugs in Korea
|
|
Columbia University, National Bureau of Economic Research, and CESifo |
|---|

Abstract
We perform an econometric assessment of the role that pharmaceutical innovation—the introduction and use of new drugs—has played in improving the health of Koreans, by investigating whether diseases for which more new drugs were launched had larger subsequent increases in longevity and smaller subsequent increases in hospitalization. Drugs launched during 1993-2012 are estimated to have increased mean age at death from all diseases by 1.71 years between 1995 and 2015 and 1.09 years between 2005 and 2015. We also estimate that new drugs increased the five-year relative survival rate from all cancers combined by 23.2 percentage points—78.5% of the total increase—between 1993-1995 and 2011-2015, and that new drugs launched during 2008-2010 reduced the number of hospital days in 2017 by 13.0 million. If the drugs launched during 2003-2012 had had no effect on other medical expenditure in 2015, the cost per life-year gained would not have exceeded 6332 USD. Therefore, even if we ignore the effect of new drugs on hospital utilization, the drugs launched during 2003-2012 were very cost–effective, overall. When reduced hospital utilization is accounted for, the evidence indicates that, in the long run, pharmaceutical innovation was cost-saving as well as life-year saving.
JEL Classification: J11, O33, L65
Keywords
Longevity, Pharmaceutical, Innovation, Korea, Hospitalization, Cancer
I. INTRODUCTION
The health status of Koreans has improved significantly during the past few decades. Life expectancy at birth increased from 78.17 years in 2005 to 82.02 years in 2015. Yang et al. (2010) concluded that rapid increases in life expectancy in South Korea during the period 1970-2005 were mostly achieved by reductions in infant mortality and in diseases related to infections and blood pressure. But reductions in infant mortality account for a very small part of recent increases in life expectancy at birth. The ratio of the 1999-2009 increase in life expectancy at age 1 to the 1999-2009 increase in life expectancy at birth was 96% for males and 93% for females (Statistics Korea, 2010). Also, the 5-year relative survival rate of Korean patients diagnosed with cancer increased from 41.2% in 1993-1995 to 70.7% in 2011-2015 (Jung et al., 2018).
The purpose of this study is to assess econometrically the role that pharmaceutical innovation—the introduction and use of new drugs—has played in improving the health of Koreans. During the period 1988-2018, 775 new drugs (new molecular entities1) were launched in Korea: about 25 new drugs per year, on average.2 The vast majority of new drugs launched in Korea were developed in other countries. Hence if life-years were gained by Koreans from the launch of new drugs, they might be considered “gains from international trade.”
Longevity increase is a very important part of economic growth, broadly defined. Nordhaus (2005) argued that “improvements in health status have been a major contributor to economic welfare over the twentieth century. To a first approximation, the economic value of increases in longevity in the last hundred years is about as large as the value of measured growth in non-health goods and services.” There is a consensus among macroeconomists that technological progress (which includes the introduction of new products) is the principal source of economic growth. Jones (2002) argued that “long-run growth is driven by the discovery of
Most scholars agree with Jones’ (1998, pp. 89-90) statement that “technological progress is driven by research and development (R&D) in the advanced world.” Dorsey et al. (2010) showed that, in 2008, 88% of private U.S. biomedical research expenditure was funded by pharmaceutical and biotechnology firms; the remaining 11% was funded by medical device firms.
The analysis will be performed using a difference-in-differences (or two-way fixed effects) research design: we will investigate whether diseases for which more new drugs were launched had larger subsequent increases in longevity and smaller subsequent increases in hospitalization. This design controls for the effects of general economic and societal factors (e.g. income, education, and behavioral risk factors), to the extent that those effects are similar across diseases, e.g. smoking increases mortality from respiratory and cardiovascular disease as well as lung cancer, and education reduces mortality from all diseases.
The number of new drug launches varied considerably across diseases. For example, as shown in Figure 1, during the period 1988-2018, 22 new drugs for treating influenza and pneumonia, and 21 new drugs for treating inflammatory polyarthropathies, were launched. Only 5 new drugs for treating dermatitis and eczema, and 4 new drugs for treating other diseases of intestines (ICD-10 block K55-K63), were launched.
We will analyze the impact that new drug launches had on three important health outcomes: (1) mean age at death from all types of diseases; (2) cancer survival rates; and (3) hospitalization from all types of diseases. We will also provide evidence about how access to new drugs in Korea compares to access in other “high-income” (as defined by the World Bank) countries.
In the next section, we will describe the econometric models that we will use to assess the role that pharmaceutical innovation played in reducing mortality and hospitalization in Korea. The data sources used to estimate these models are discussed on Section III. Empirical results are presented in Section IV. Some implications of the estimates, and evidence about access to new drugs in Korea, are discussed in Section V. Section VI provides a summary.
1)New Molecular Entities (NMEs) are compounds that emerge from the process of medicine discovery, that are not a version or derivative of an existing, previously investigated/approved substance. They have promising activity against a particular target thought to be important in a disease. <
2)These figures refer to the number of post-1981 new chemical entities (NCEs) launched in Korea. A post-1981 NCE is an NCE that was first launched anywhere in the world after 1981.
3)The discovery of new ideas could increase economic output for two different reasons. First, output could simply be positively related to the quantity (and variety) of ideas ever discovered. Second, output could be positively related to the (mean or maximum) quality of ideas ever discovered, and new ideas may be better (of higher quality), on average, than old ideas.
II. METHODS
1. Mean Age at Death from All Types of Diseases
To assess the impact that pharmaceutical innovation had on mean age at death from all types of diseases, we will estimate models based on the following 2-way fixed effects equation:

where
AGE_DEATHdt= mean age at death from disease d in year t (t = 1995, 2005, 2015)
CUM_DRUGd,t-k= Σm INDmd LAUNCHEDm,t-k = the number of chemical substances to treat disease d that had been launched in Korea by the end of year t-k (k = 0, 1, 2,…)
INDmd= 1 if chemical substance m is used to treat (indicated for) disease d 4
= 0 if chemical substance m is not used to treat (indicated for) disease d
LAUNCHEDm,t-k= 1 if chemical substance m had been launched in Korea by the end of year t-k
= 0 if chemical substance m had not been launched in Korea by the end of year t-k
αd= a fixed effect for disease d
δt= a fixed effect for year t
Eq. (1) may be considered a health production function (Koç, 2004), and the number of chemical substances ever launched may be considered a measure of the stock of pharmaceutical “ideas.”
The measure of longevity that is the dependent variable in eq. (1) is mean age at death. An alternative, and better known, measure of longevity is life expectancy at birth. 5 Mean age at death can be computed for specific diseases, whereas life expectancy at birth cannot. However, the 2005-2015 change in life expectancy at birth is strongly positively correlated (p-value < .0001) across countries with the 2005-2015 change in mean age at death (from all diseases combined). Appendix Figure 1 shows a bubble plot of this relationship based on data for 35 European countries.
The launch of a drug indicates that patients
Since patients can access drugs that have been included in the National Health Insurance System (NHIS) of Korea with less financial burden, it might also be preferable to replace CUM_DRUGd,t-k with CUM_NHISd,t-k, where CUM_NHISd,t-k = the number of chemical substances to treat disease d that had been included in the NHIS by the end of year t-k. Unfortunately, we were unable to obtain data on the year in which each chemical substance was included in the NHIS.6 But CUM_DRUGd,t-k is likely to be fairly highly correlated with CUM_NHISd,t-k.
Since our drug launch variables are imperfect measures of exposure to pharmaceutical innovation, the estimated coefficients on those variables are likely to be biased towards zero, and our estimates of the number of life-years saved by new drugs are likely to be conservative. Here is the first paragraph of the eminent MIT econometrician Jerry Hausman’s (2001 p. 57) article on mismeasured variables in econometric analysis:
The effect of mismeasured variables in statistical and econometric analysis is one of the oldest known problems, dating from the 1870s in Adcock (1878). In the most straightforward regression analysis with a single regressor variable, the least squares estimate is downward biased in magnitude toward zero. While a mismeasured righthand side variable creates this problem, a mismeasured left-hand side variable under classical assumptions does not lead to bias. The only result is less precision in the estimated coefficient and a lower t-statistic.
Due to data limitations, CUM_DRUGc,t-k is the only disease-specific, time-varying regressor in eq. (1). If the data were available, we would like to include other regressors in eq. (1), e.g. the number of non-pharmaceutical medical innovations (e.g. medical device innovations) that had been launched in Korea.7 Failure to control for non-pharmaceutical medical innovation (e.g. innovation in diagnostic imaging, surgical procedures, and medical devices) is also unlikely to bias estimates of the effect of pharmaceutical innovation on the burden of disease, for two reasons. First, as noted earlier, 88% of privately-funded U.S. funding for biomedical research came from pharmaceutical and biotechnology firms (Dorsey et al., 2010).8 Second, previous research based on U.S. data (Lichtenberg, 2014a; 2014b) indicated that non-pharmaceutical medical innovation is not positively correlated across diseases with pharmaceutical innovation. Third, a study of pharmaceutical innovation and longevity growth in 30 developing and high-income countries during the period 2000-2009 (Lichtenberg, 2014c) found that controlling for ten other potential determinants of longevity change (real per capita income, the unemployment rate, mean years of schooling, the urbanization rate, real per capita health expenditure (public and private), the DPT immunization rate among children ages 12-23 months, HIV prevalence and tuberculosis incidence)
We will use data for three years: 1995, 2005 and 2015.9 Substituting the first and last values of t into eq. (1) yields:


Subtracting eq. (2) from eq. (3) yields:

ΔAGE_DEATHd = AGE_DEATHd,2015 - AGE_DEATHd,1995
ΔCUM_DRUG_kd = CUM_DRUGd,2015-k - CUM_DRUGd,1995-k
δ = δ2015 - δ1995
εd’ = εd,2015 - εd,1995
Eq. (4) is a simple regression of the 20-year (1995-2015)
In addition to estimating models of the 20-year (1995-2015) change in mean age at death, we will estimate models of the 10-year (2005-2015) change in mean age at death.
There is likely to be a lag between the launch of a new drug and its maximum impact on mean age at death. Utilization of recently-launched drugs tends to be much lower than utilization of drugs launched many years earlier. Evidence about the shape of the drug-age (number of years since launch) drug-utilization profile can be obtained by estimating the following equation:

N_SUmn = the number of standard units of molecule m sold in Korea n years after it was first launched (n = 0, 1,…, 20)
ρm = a fixed effect for molecule m
πn = a fixed effect for age n
The expression exp(πn - π10) is a “relative utilization index”: it is the mean ratio of the quantity of a drug sold n years after it was launched to the quantity of the same drug sold 10 years after it was launched. We estimated eq. (5), using annual data for the period 2007-2017 on 631 molecules. Estimates of the “relative utilization index” are shown in Figure 2. These estimates indicate that utilization of a drug reaches a peak about 16-18 years after it was launched. It is used about twice as much then as it was 3-4 years after launch.11,12
Due to gradual diffusion of new drugs, the maximum impact of a drug on mean age at death is likely to occur years after it was launched, but the peak effect could occur either more than or less than 16-18 years after launch. The lag might be longer because some drugs for chronic diseases (e.g. statins) may have to be consumed for several years to achieve full effectiveness. But the lag might be shorter because the impact of a drug on mean age at death is likely to depend on its quality (or effectiveness) as well as on its quantity (utilization), and drugs launched more recently are likely to be of higher quality than earlier-vintage drugs.13
2. 5-year Relative Cancer Survival Rates
To assess the impact that pharmaceutical innovation had on 5-year relative cancer survival rates, we will estimate models based on the following 2-way fixed effects equation:

SURVst = the 5-year relative survival rate of patients diagnosed with cancer at cancer site s (breast, colon, lung, etc.) between year t and year t+2 or t+4 (t = 1993, 1996, 2011)14
CUM_DRUGs,t-k = the number of chemical substances to treat cancer at site s that had been launched in Korea by the end of year t-k (k = 0, 1, 2,…)
The following model of the 19-year (1993-1995 to 2011-2015)
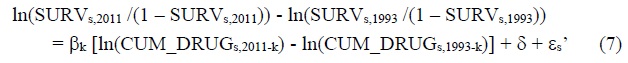
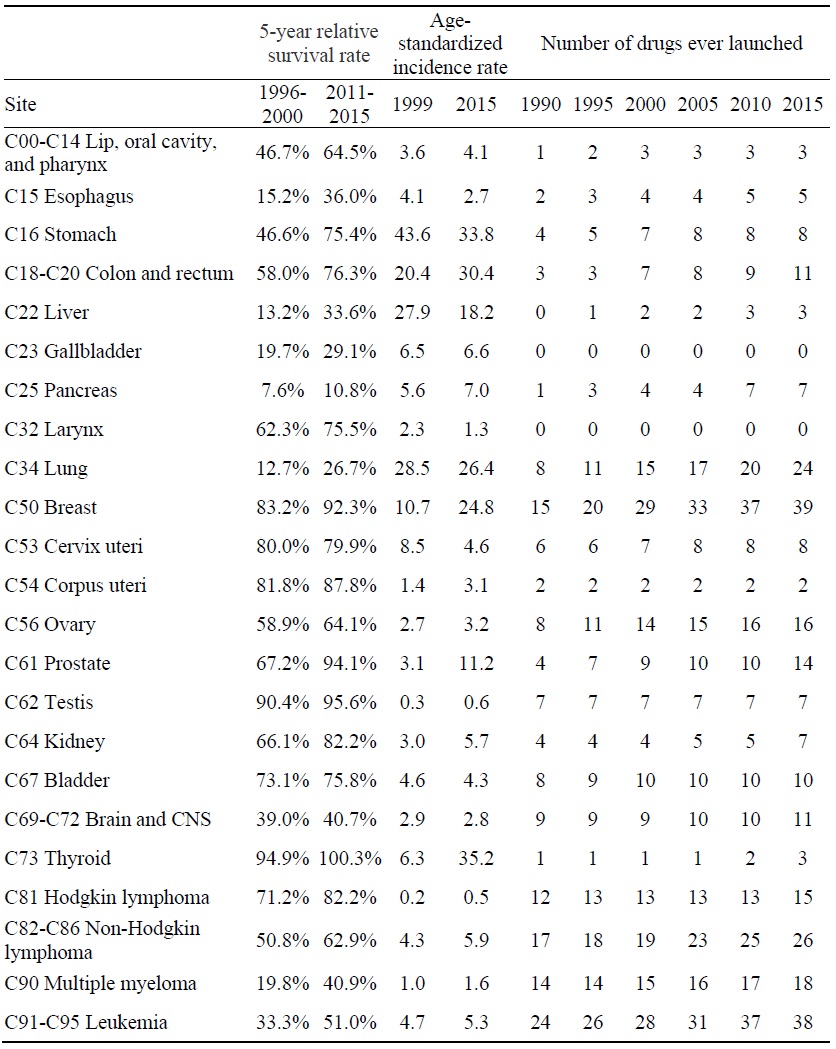
We will also estimate a similar model of the 15-year (1996-2000 to 2011-2015) change in the log-odds of cancer survival. To address the issue of heteroskedasticity, eq. (7) will be estimated by weighted least squares, weighting by 1/((1/INCIDENCEs,1999) + (1/INCIDENCEs,2015)), where INCIDENCEst = the age-standardized incidence rate of cancer at site s in year t. Jung et al. (2018)’s cancer site classification will be used.
3. Hospital Utilization
Studies have shown that new drugs for Crohn’s disease, transthyretin amyloid cardiomyopathy, and some types of cystic fibrosis have reduced hospitalization:
• Data from the Phase 3 IM-UNITI study showed that treatment with ustekinumab lowered the risk of Crohn's disease (CD)-related hospitalization, surgery, and the need for alternative biologic therapy in patients with moderate-to-severe CD when compared with placebo. At 2 years, patients in the ustekinumab q12w group were 52% less likely to be hospitalized or require surgery vs patients in the placebo group (hazard ratio [HR] 0.477; 95% CI, 0.238, 0.957; P =.033). Patients in the ustekinumab q8w group were 40% less likely to be hospitalized or require surgery (HR 0.601; 95% CI, 0.411, 0.879; P =.006).15
• A phase three clinical trial has shown that tafamidis significantly reduces deaths and hospitalizations in patients with transthyretin amyloid cardiomyopathy, a progressive form of heart failure. Compared to a placebo, the drug reduced deaths by 30 percent and reduced cardiovascular-related hospitalizations by 32 percent.16
• Ivacaftor is a small molecule drug originally developed to treat the G551D CFTR gene variant that causes about 3-4% of Cystic fibrosis (CF) cases. Inpatient admissions decreased by 55% from 0.57 inpatient admissions per person-year pre-ivacaftor to 0.26 admissions post-ivacaftor, with similar decreases for children and adults.17
Other studies have provided more general evidence about cost offsets from prescription drug innovation. Lichtenberg (2009) analyzed the impact of pharmaceutical innovation on hospitalization for a single (albeit important) disease—cardiovascular disease—in 20 OECD countries during the period 1995-2003. Lichtenberg (2014d) analyzed the impact of pharmaceutical innovation on hospitalization for 131 medical conditions in a single country—the United States—during the period 1996-2010. The measure of pharmaceutical innovation used in both studies was the mean
To assess the impact that pharmaceutical innovation had on hospital utilization in Korea, we will estimate models based on the following 2-way fixed effects equation:

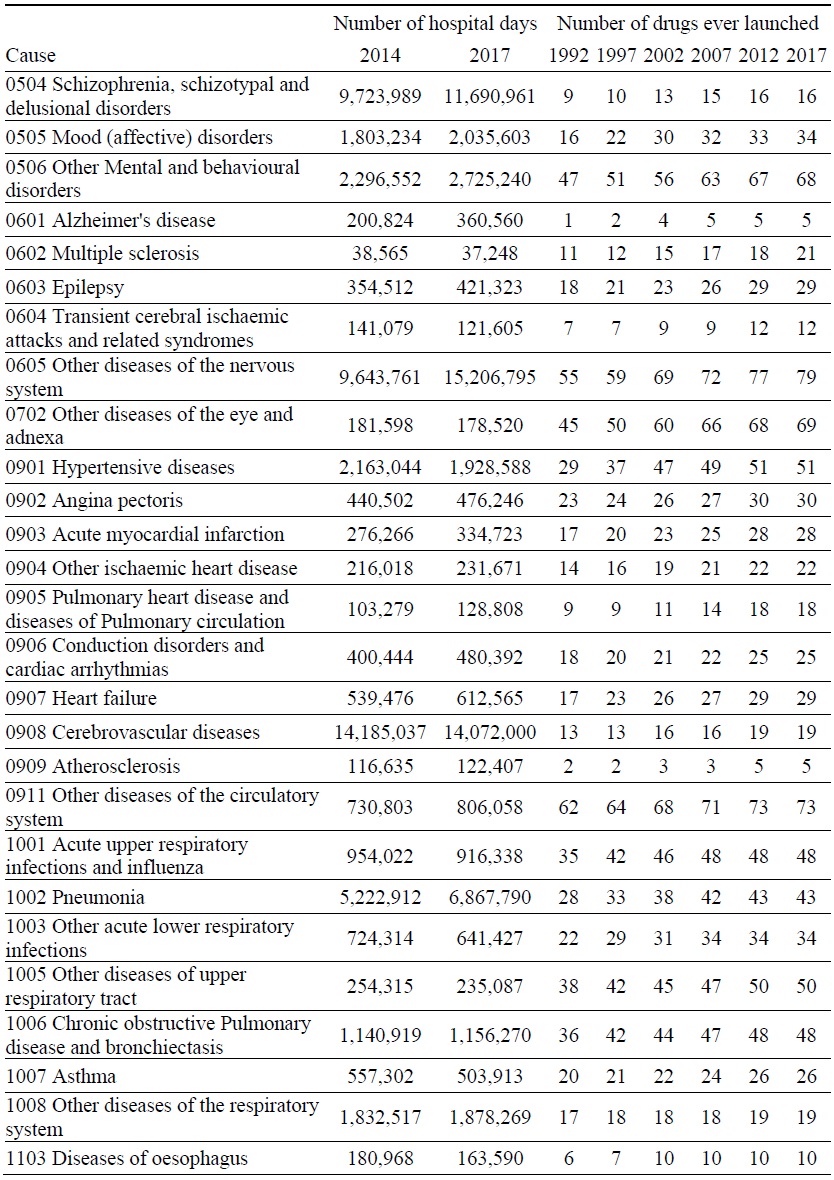
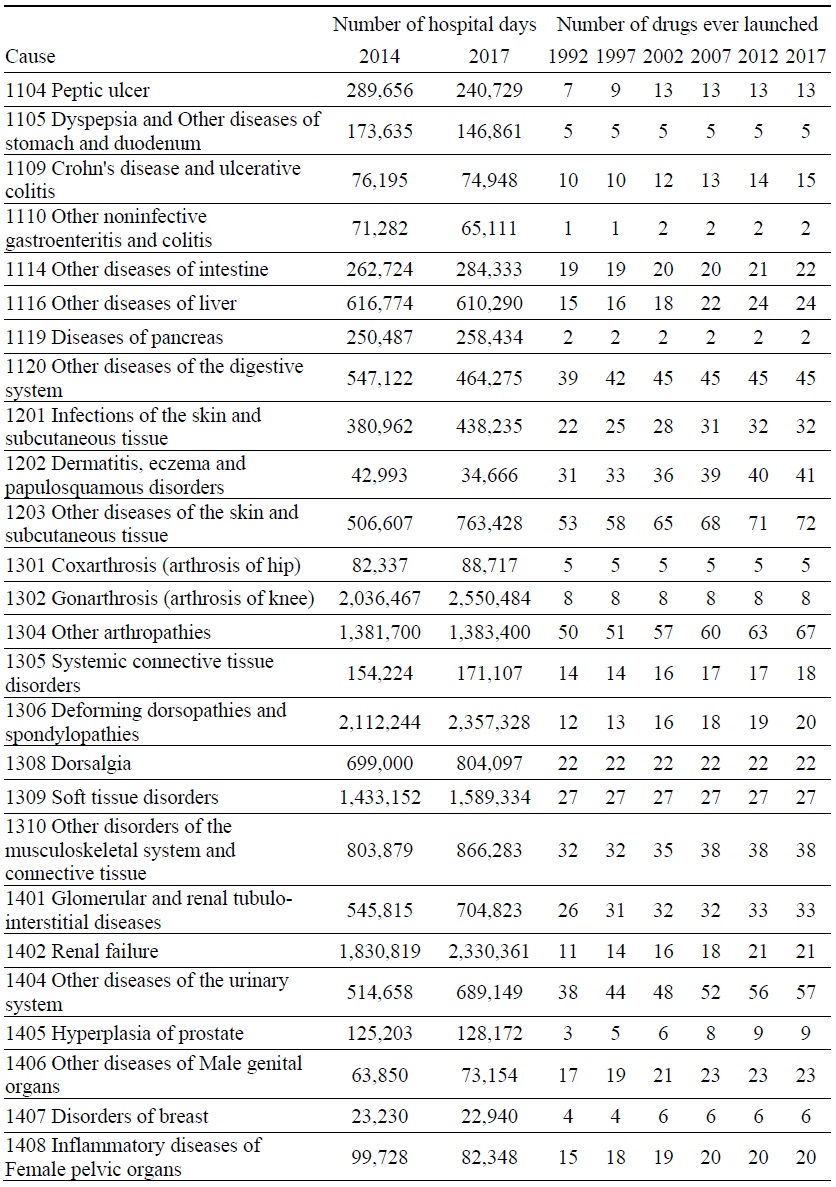
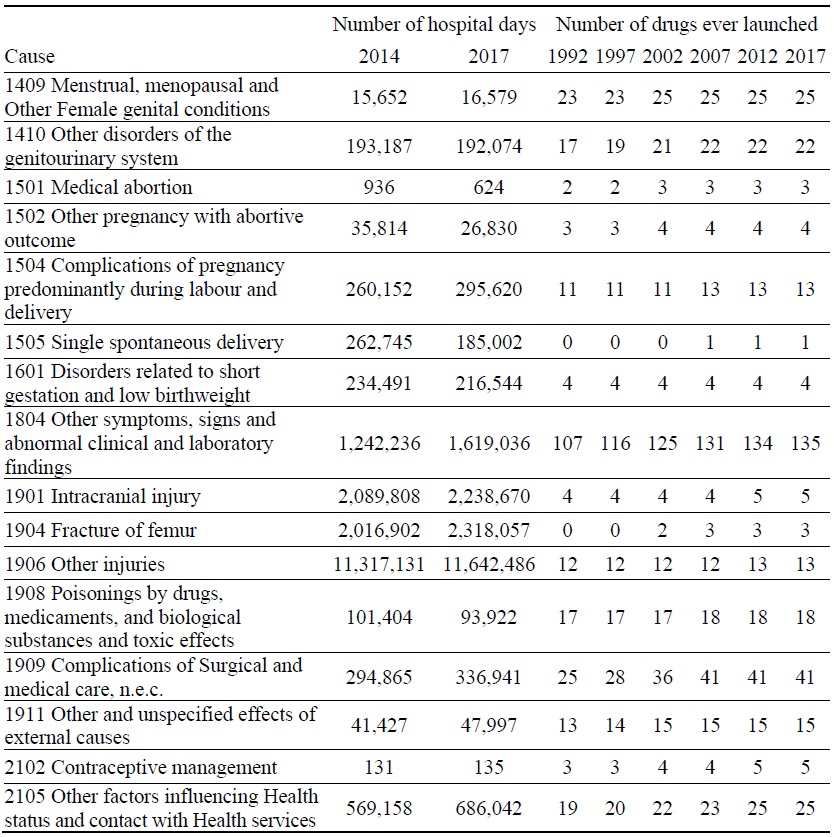
DAYSdt = the number of days of hospital care18 provided to patients with diagnosis d in year t (t = 2014, 2017)19
The following model of the 3-year

Δln(DAYSd) = ln(DAYSd,2017) - ln(DAYSd,2014)
Δln(CUM_DRUG_kd) = ln(CUM_DRUGd,2017-k) - ln(CUM_DRUGd,2014-k)
Eq. (9) will be estimated by weighted least squares, weighting by 1/((1/DAYSd,2014) + (1/DAYSd,2017)). The disease classification is the Eurostat/OECD/WHO
4)Many drugs have multiple indications: 50% of drugs have 2 or more indications (causes of disease in the WHO Global Health Estimates disease classification), and 7% of drugs have 5 or more indications.
5)Mean age at death represents the actual mean age at which patients died in a given year. Life expectancy at birth represents the hypothetical mean number of years until death of patients born in a given year.
6)Those data may be available upon request to the NHIS.
7)Some major studies have not found there to be health benefits of some nonpharmaceutical innovations. A large U.S. government study found that drug therapy alone may save lives as effectively as bypass or stenting procedures
8)Much of the rest came from the federal government (i.e. the NIH), and new drugs often build on upstream government research
9)1995 and 2015 are the first and last years for which the ICD10 disease classification was used in available Korean mortality data.
10)The parameter δ in eq. (4) is an estimate of the change in mean age at death in the absence of any drug launches between 2005 – k and 2015 – k.
11)The estimate of a 16-18 year lag from drug launch to peak drug utilization in Korea is 8 years longer than the average 8-10 year lag in 22 countries (Australia, Austria, Belgium, Brazil, Canada, Switzerland, Chile, Colombia, Germany, Ecuador, Spain, Finland, France, United Kingdom, Ireland, Italy, Japan, Mexico, Portugal, Singapore, Sweden, and the U.S.) estimated in
12)Diffusion of cancer (WHO ATC anatomical main group L) drugs is slower than diffusion of drugs in general: cancer drugs are used 6 times as much 16-18 years after launch as they are 3-4 years after launch.
13)The impact on mortality may depend on the interaction (quantity * quality) of the two variables. The mortality impact will increase with respect to drug age (time since launch) if the rate of increase of quantity with respect to age is greater than the rate of decline of quality with respect to age; otherwise the mortality impact will decline.
14)The survival rates cover three periods: patients diagnosed in 1993-1995, 1996-2000, and 2011-2015.
15)<
16)<
17)<
18)The number of days of hospital care equals the number of hospital discharges (or admissions) times average length of stay.
19)Due to a change in the data source, there was a break in the hospital time series in 2014. From 2014, administrative data (the Health Insurance Review & Assessment Service, Statistics of Health Care Utilization) were used. Until 2013, patient survey data (The Patient Survey Report, produced by the Korea Institute for Health and Social Affairs, Ministry of Health and Welfare) were used. See
III. DATA SOURCES
20)Thériaque provides data only on labeled indications; it does not provide data on off-label indications.
IV. EMPIRICAL RESULTS
1. Mean Age at Death from All Types of Diseases
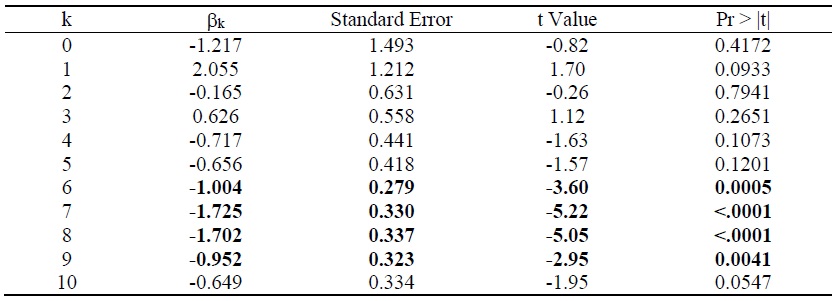
Estimates of the parameter βk from the model of the 20-year (1995-2015) change in mean age at death from all diseases (eq. (4)) are presented in rows 1-8 of Table 1. Each estimate is from a separate model. The table shows estimates for 8 values (k = 0, 1,…, 6, 7) of the lag (k) from cumulative drug launches to mean age at death. All 8 estimates are positive and statistically significant (p-value < .05).21 The largest, and most significant, estimate is for k = 3: the 1995-2015 change in mean age at death from a disease is most strongly related to the 1992-2012 change in the number of drugs used to treat the disease ever launched, i.e. to the number of drugs launched during 1993-2012.
The weighted (by 1/((1/N_DEATHSd,1995) + (1/N_DEATHSd,2015))) mean value of ΔAGE_DEATH is 8.39, and the intercept of eq. (4) when k = 3 is 6.67, so the 1995-2015 increase in mean age at death attributable to drugs launched during 1993-2012 is 1.71 (=8.39 – 6.67) years. This is about one fifth (20.4%) of the actual increase in mean age at death during that period. There were 275,854 deaths in Korea in 2015. If drugs launched during 1993-2012 did not affect the total number of deaths or their distribution across diseases, those drug launches increased the number of life-years (or reduced the number of life-years lost) in 2015 by 472,990 (= 1.71 years * 275,854 deaths).
Estimates of the parameter βk from the model of the 10-year (2005-2015) change in mean age at death from all diseases are presented in rows 9-16 of Table 1. Once again, all 8 estimates are positive and statistically significant (p-value < .01), and the most significant, estimate is for k = 3: the 2005-2015 change in mean age at death from a disease is most strongly related to the 2002-2012 change in the number of drugs used to treat the disease ever launched, i.e. to the number of drugs launched during 2003-2012. Figure 3 is a bubble plot of the correlation across diseases between the number of drugs launched during 2003-2012 and the 2005-2015 increase in mean age at death. The estimate of β3 in row 12 is 45% larger than the estimate of β3 in row 4. A possible explanation for this is that the average quality of drugs launched during 2003-2012 was higher than the average quality of drugs launched during 1993-2002.
The weighted (by 1/((1/N_DEATHSd,2005) + (1/N_DEATHSd,2015))) mean value of ΔAGE_DEATH is 4.14, and the intercept of eq. (4) when k = 3 is 3.05, so the 2005-2015 increase in mean age at death attributable to drugs launched during 2003-2012 is 1.09 (= 4.14 – 3.05) years.22 Drugs launched during 2003-2012 are estimated to have increased mean age at death by slightly more than one year between 2005 and 2015. This is about one fourth (26.3%) of the actual increase in mean age at death during that period. If drugs launched during 2003-2012 did not affect the total number of deaths or their distribution across diseases, those drug launches increased the number of lifeyears (or reduced the number of life-years lost) in 2015 by 300,057 (= 1.09 years * 275,854 deaths).
2. 5-year Relative Cancer Survival Rates
Estimates of the parameter βk from the model of the 19-year (1993-1995 to 2011-2015) change in the log-odds of cancer survival (eq. (7)) are presented in rows 1-7 of Table 2. For k < 3, the estimates are not statistically significant. However, the estimates of β4, β5 and β6 are positive and highly significant.23 The 19-year change in the log-odds of cancer survival is most strongly related to the log change in the number of drugs ever launched 6 years earlier. Figure 4 is a bubble plot of the correlation across cancer sites between the 1988-2003 log change in the number of drugs ever launched and the log change in the 5-year relative survival rate, 1996-2000 to 2011-2015.
Between 1993-1995 and 2011-2015, the five-year relative survival rate from all cancers combined increased by 29.5 percentage points, from 41.2% to 70.7%. The estimate of β6 in row 4 of Table 2 indicates that 78.5% of this increase in the log-odds of survival was due to new drug launches during 1988-2005.24 Hence, we estimate that new drugs launched during 1989-2003 increased the five-year relative survival rate from all cancers combined by 23.2 percentage points (= 78.5% * 29.5 percentage points).
Estimates of the parameter βk from the model of the 15-year (1996-2000 to 2011-2015) change in the log-odds of cancer survival (eq. (7)) are presented in rows 8-17 of Table 2. For k ≤ 6, the estimates are not statistically significant. However, the estimates of β7, β8 and β9 are positive and highly significant. The 15-year change in the log-odds of cancer survival is most strongly related to the log change in the number of drugs ever launched 7 years earlier. Between 1996-2000 and 2011-2015, the five-year relative survival rate from all cancers combined increased by 26.7 percentage points, from 44.0% to 70.7%. The estimate of β7 in row 15 of Table 2 indicates that 75.7% of this increase in the log-odds of survival was due to new drug launches during 1990-2004. Hence, we estimate that new drugs launched during 1990-2004 increased the five-year relative survival rate from all cancers combined by 20.2 percentage points (=75.7% * 26.7 percentage points).
3. Hospital Utilization
Estimates of the parameter βk from the model of the 2014-2017 log change in hospital utilization (eq. (9)) are presented in Table 3. When k ≤ 5, the estimate is not statistically significant, but when 6 ≤ k ≤ 9, the estimates are negative and highly significant. The growth in the number of hospital days is inversely related across diseases to the growth in the number of drugs that had ever been launched 6-9 years earlier. It is most strongly related to the growth in the number of drugs that had ever been launched 7 years earlier. Figure 5 is a bubble plot of the correlation across diseases between the 2007-2010 log change in the number of drugs ever launched and the 2014-2017 log change in the number of hospital days.
Between 2014 and 2017, the number of hospital discharges increased by 7%, from 8.20 million to 8.74 million, average length of stay increased by 9%, from 17.0 to 18.5 days, and the number of hospital days increased by 16%, from 139.4 million to 161.7 million. Our estimates imply that, if no new drugs had been launched during 2008-2010, the number of hospital days would have increased even more during 2014-2017, and the number of hospital days in 2017 would have been 8.1% higher than it actually was. We estimate that the new drugs that were launched during 2008-2010 reduced the number of hospital days in 2017 by 13.0 million (= 8.1% * 161.7 million).
21)Since Korean drug launch data are not available for years prior to 1988, the longest lag we can estimate is 7 years.
22)This figure is fairly similar to
23)Because data on Korean drug launches before 1988 are not available, it is not possible to estimate models for k > 8.
24)The weighted mean of the dependent variable of eq. (7) is 1.086. The intercept of eq. (7) when k = 6 is 0.234. This is an estimate of the 19-year change in the log-odds of cancer survival in the absence of any increase in the number of drugs ever launched 6 years earlier (when [ln(CUM_DRUGs,2011-6) - ln(CUM_DRUGs,1993-6)] = 0). Hence the fraction of the increase in the log-odds of survival that was due to new drug launches during 1988-2005 is 78.5% (= 1 – (0.234/1.086)).
V. DISCUSSION
We estimated that drugs launched during 2003-2012 (which increased the number of drugs that had ever been launched between the end of 2002 and the end of 2012) increased mean age at death by 1.09 years between 2005 and 2015, and that they reduced the number of life-years lost in 2015 by 300,057. IQVIA data indicate that 2015 expenditure on drugs launched during 2003-2012 was 1.90 billion USD.25 Hence if the drugs launched during 2003-2012 had had no effect on other medical expenditure in 2015, the cost per life-year gained would not have exceeded 6332 USD (= 1.90 billion USD / 300,057 life-years).26
As noted by Bertram et al. (2016), authors writing on behalf of the WHO’s
When the effect of new drugs on hospital utilization is accounted for, the evidence indicates that, in the long run, pharmaceutical innovation was cost-saving as well as life-year saving. We estimated that, if no new drugs had been launched during 2008-2010, the number of hospital days in 2017 would have been 8.1% higher than it actually was. It is reasonable to assume that hospital expenditure in 2017 would have been 8.1% higher than it actually was. 2017 expenditure on inpatient curative and rehabilitative care was 37.4 billion USD, so new drugs launched during 2008-2010 may have reduced 2017 hospital expenditure by 3.0 billion USD (= 8.1% * 37.4 billion USD). This figure is 10.5 times as high as 2017 expenditure on drugs launched during 2008-2010 (287 million USD).28
We conclude by comparing the extent of access to new drugs in Korea to the extent of access in other high-income countries. One measure of access is the number of post-2005 new chemical entities (NCEs) sold. As shown in Figure 6, 173 post-2005 NCEs were sold in Korea in 2018. The average number of post-2005 NCEs sold in 31 high-income countries was 183. Korea ranked 19 out of 31 countries.
A second measure of access to new drugs is the ratio of the number of post-2005 drugs sold in 2018 to the total number of drugs sold in 2018. The total number of drugs sold in Korea in 2018 (1703) was higher than mean total number of drugs sold in the 31 countries (1455). Consequently, as shown in Figure 7, Korea’s rank with respect to this ratio was lower (25 out of 31) than its rank with respect to the number of new (post-2005) drugs sold in 2018.
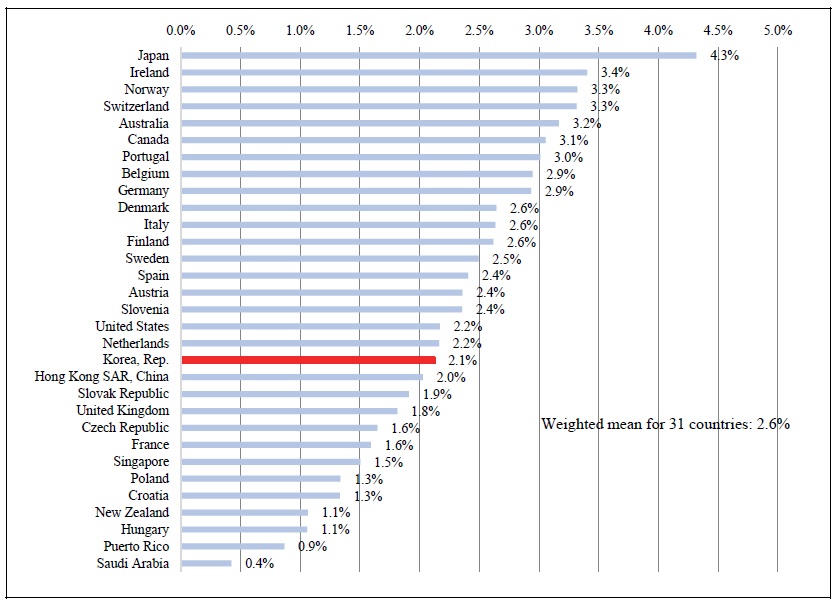
A third, and perhaps most meaningful, measure of access to new drugs is the fraction of standard units (e.g. the fraction of pills) sold that were units of post-2005 drugs. As shown in Figure 8, 2.1% of the standard units sold in Korea in 2018 were units of post-2005 drugs. This figure is lower than the weighted mean figure for 31 high-income countries: 2.6%. Korea ranked 19 out of 31 countries.
25)This is 15% of IQVIA’s estimate of total pharmaceutical expenditure in 2015: 12.98 billion USD. According to the
26)This calculation does not account for the fact that expenditure on other (older) drugs may have been reduced by the use of these drugs.
27)Other authorities use reasonably similar cost-effectiveness thresholds. The U.K.
28)This estimate is about twice as high as the estimate obtained in a study
VI. SUMMARY AND CONCLUSIONS
We have performed an econometric assessment of the role that pharmaceutical innovation—the introduction and use of new drugs—has played in improving the health of Koreans, by investigating whether diseases for which more new drugs were launched had larger subsequent increases in longevity and smaller subsequent increases in hospitalization. The number of new drug launches varied considerably across diseases.
Drugs launched during 1993-2012 are estimated to have increased mean age at death by 1.71 years between 1995 and 2015. Drugs launched during 2003-2012 are estimated to have increased mean age at death by 1.09 years between 2005 and 2015. This is about one fourth of the actual increase in mean age at death during that period. If drugs launched during 2003-2012 did not affect the total number of deaths or their distribution across diseases, those drug launches reduced the number of life-years lost in 2015 by 300,057. The average effect on mean age at death of a drug approved during the second half of the 1993-2012 period was 45% larger than the average effect of a drug approved during the entire period; a possible explanation for this is that the average quality of drugs launched during 2003-2012 was higher than the average quality of drugs launched during 1993-2002.
Between 1993-1995 and 2011-2015, the five-year relative survival rate from all cancers combined increased by 29.5 percentage points, from 41.2% to 70.7%. We estimated that new drugs launched during 1989-2003 increased the survival rate by 23.2 percentage points—78.5% of the total increase.
The 2014-2017 growth in the number of hospital days is inversely related across diseases to the growth in the number of drugs that had ever been launched 6-9 years earlier. It is most strongly related to the growth in the number of drugs that had ever been launched 7 years earlier. Our estimates implied that, if no new drugs had been launched during 2008-2010, the number of hospital days in 2017 would have been 8.1% higher than it actually was. We estimated that the new drugs that were launched during 2008-2010 reduced the number of hospital days in 2017 by 13.0 million.
If the drugs launched during 2003-2012 had had no effect on other medical expenditure in 2015, the cost per life-year gained would not have exceeded 6332 USD. These estimates indicate that, even if we ignore the effect of new drugs on hospital utilization, the drugs launched during 2003-2012 were very cost–effective, overall.
When the effect of new drugs on hospital utilization is accounted for, the evidence indicates that, in the long run, pharmaceutical innovation was cost-saving as well as life-year saving. The estimated reduction in 2017 hospital expenditure attributable to new drugs launched during 2008-2010 was 10.5 times as high as 2017 expenditure on those drugs.
Access to new drugs in Korea in 2018 was somewhat lower than access to new drugs in other high-income countries. Korea ranked 19 out of 31 countries with respect to the fraction of standard units (e.g. the fraction of pills) sold that were units of post-2005 drugs.
Tables & Figures
Figure 1.
Number of Drugs used to Treat 6 Diseases ever Launched in Korea, 1988-2018
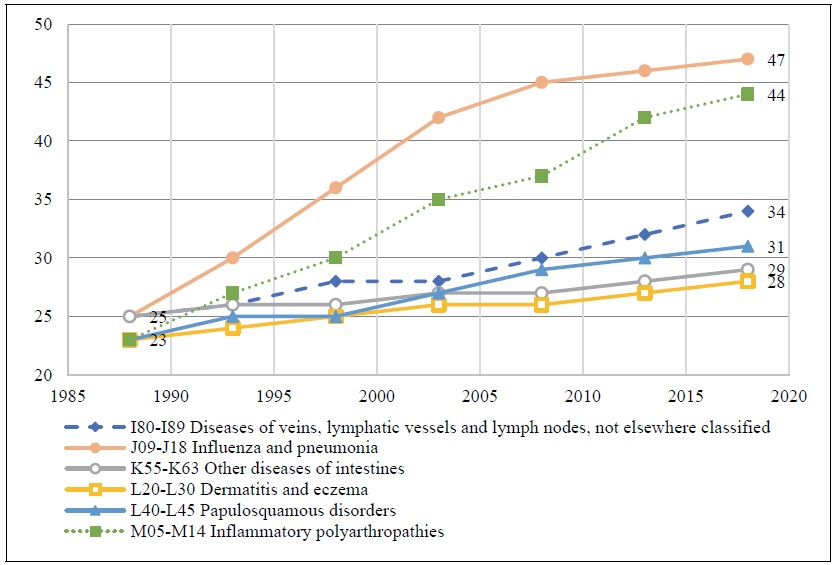
Source: Author’s calculations based on data contained in Theriaque database and IQVIA New Product Focus and MIDAS databases.
Figure 2.
Mean Ratio of Quantity of a Drug Sold k Years after Launch to Quantity of the Same Drug Sold 10 Years after Launch
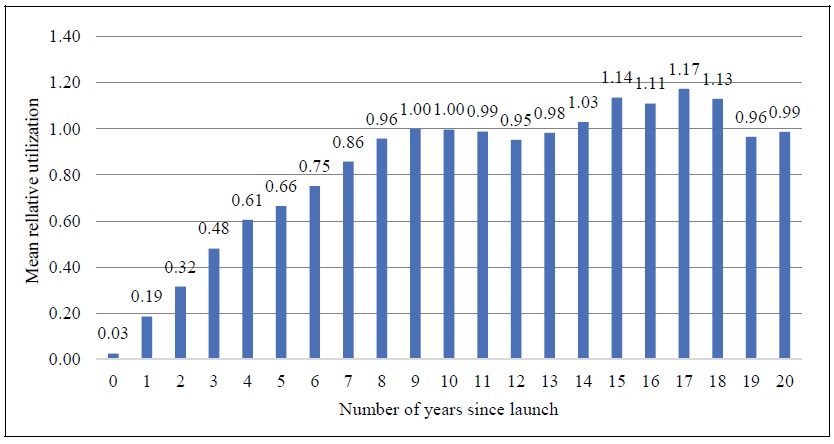
Table 1.
Weighted Least-squares Estimates of the Parameter βk from the Model of the Change in Mean Age at Death from All Diseases (eq. (4)): ΔAGE_DEATHd = βk ΔCUM_DRUG_kd + δ+ εd’
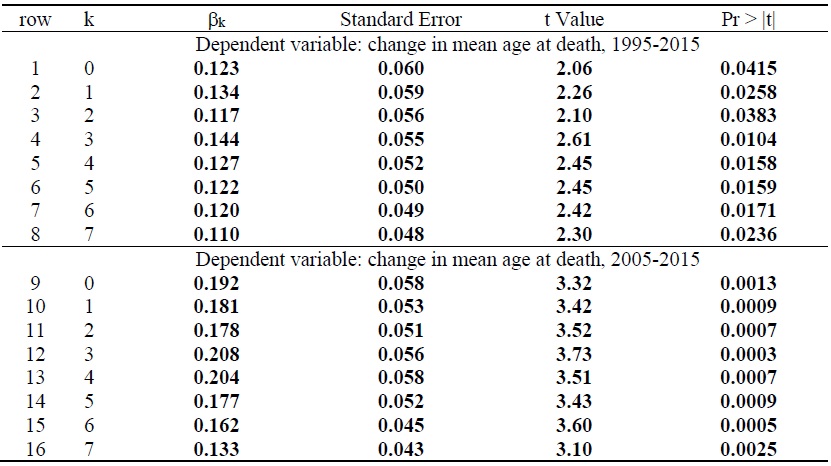
N = 104.
Estimates in bold are statistically significant (p-value < .05).
In rows 1-8, observations are weighted by 1/((1/N_DEATHSd,1995) + (1/N_DEATHSd,2015)), where N_DEATHSdt = the number of deaths caused by disease d in year t. In rows 9-16, observations are weighted by 1/((1/N_DEATHSd,2005) + (1/N_DEATHSd,2015)).
Table 2.
Weighted least-squares estimates of the parameter βk from the model of the the long-run change in the log-odds of cancer survival (eq. (7)): ln(SURVs,2011 /(1 – SURVs,2011)) - ln(SURVs,t0 /(1 – SURVs,t0)) = βk [ln(CUM_DRUGs,2011-k) - ln(CUM_DRUGs,t0-k)] + δ + εs’
![Weighted least-squares estimates of the parameter β<sub>k</sub> from the model of the the long-run change in the log-odds of cancer survival (eq. (7)): ln(SURV<sub>s,2011</sub> /(1 – SURV<sub>s,2011</sub>)) - ln(SURV<sub>s,t0</sub> /(1 – SURV<sub>s,t0</sub>)) = β<sub>k</sub> [ln(CUM_DRUG<sub>s,2011-k</sub>) - ln(CUM_DRUG<sub>s,t0-k</sub>)] + δ + ε<sub>s</sub>’](/S_Img/JE0001/2020/v24n2/JE0001_2020_v24n2_127_t013.jpg)
N = 18.
Estimates in bold are statistically significant (p-value < .01).
Observations are weighted by 1/((1/INCIDENCEs,1999) + (1/INCIDENCEs,2015)), where INCIDENCEst = the age-standardized incidence rate of cancer at site s in year t.
Table 3.
Weighted least-squares estimates of the parameter βk from the model of the 2014-2017 log change in hospital utilization (eq. (9)): Δln(DAYSd) = βk Δln(CUM_DRUG_kd) + δ + εd‘
N = 92.
Estimates in bold are statistically significant (p-value < .01).
Observations are weighted by 1/((1/DAYSd,2014) + (1/DAYSd,2017)), where DAYSdt = the number of days of hospital care provided to patients with diagnosis d in year t.
Figure 3.
Correlation across Diseases between Number of Drugs Launched during 2003-2012 and 2005-2015 Increase in Mean Age at Death
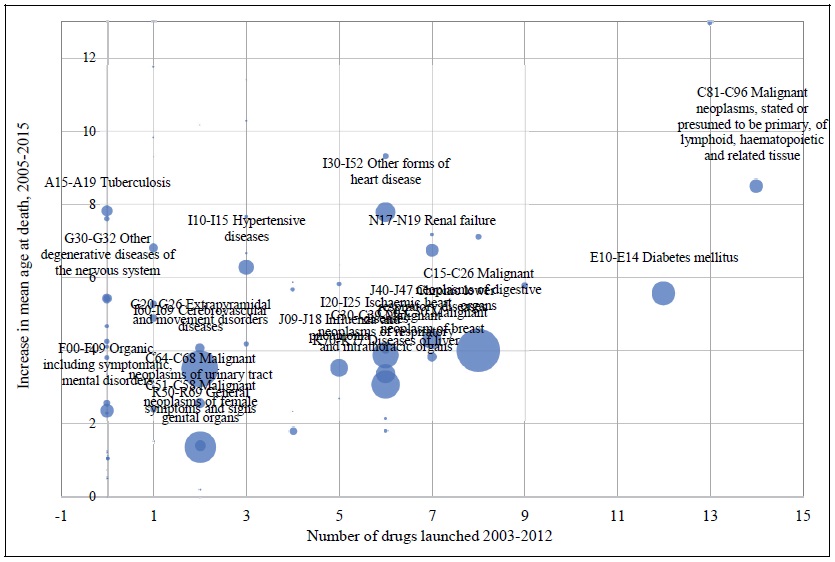
Bubble area is proportional to (1/((1/N_DEATHSd,2005) + (1/N_DEATHSd,2015))), where N_DEATHSd,t = the number of deaths due to disease d in year t.
Figure 4.
Correlation across Cancer Sites between the 1987-2005 Log Change in the Number of Drugs ever Launched and the Log Change in the 5-year Relative Survival Rate, 1993-1995 to 2011-2015
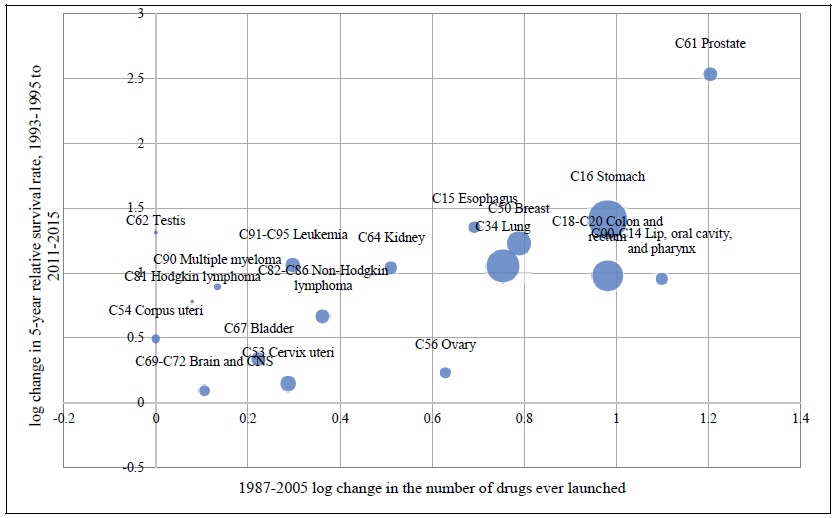
Bubble area is proportional to by 1/((1/INCIDENCEs,1999) + (1/INCIDENCEs,2015)), where INCIDENCEst = the age-standardized incidence rate of cancer at site s in year t.
Figure 5.
Relationship across Diseases between 2007-2010 Log Change in Number of Drugs ever Launched and 2014-2017 Log Change in number of Hospital Days
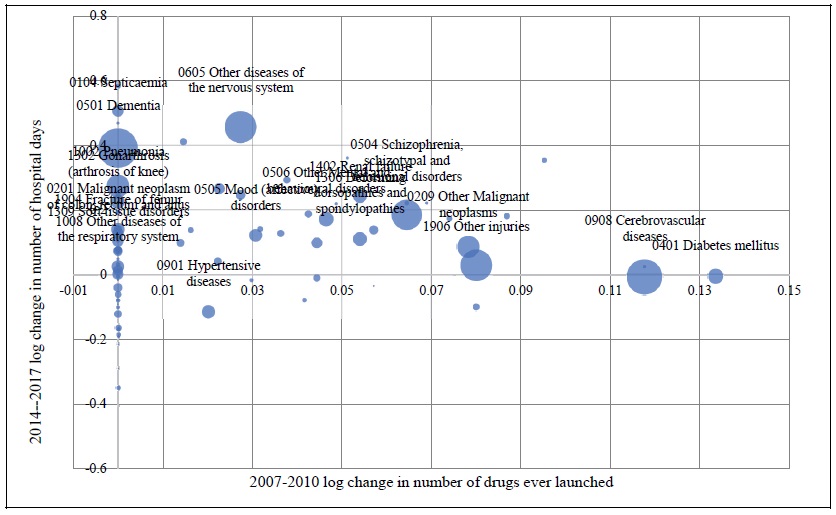
Bubble size is proportional to 1/((1/DAYSd,2014) + (1/DAYSd,2017)), where DAYSdt = the number of days of hospital care provided to patients with diagnosis d in year t. To improve legibility, only the 20 largest diseases are labeled.
Figure 6.
Number of Post-2005 Drugs Sold in 2018: High-income Countries
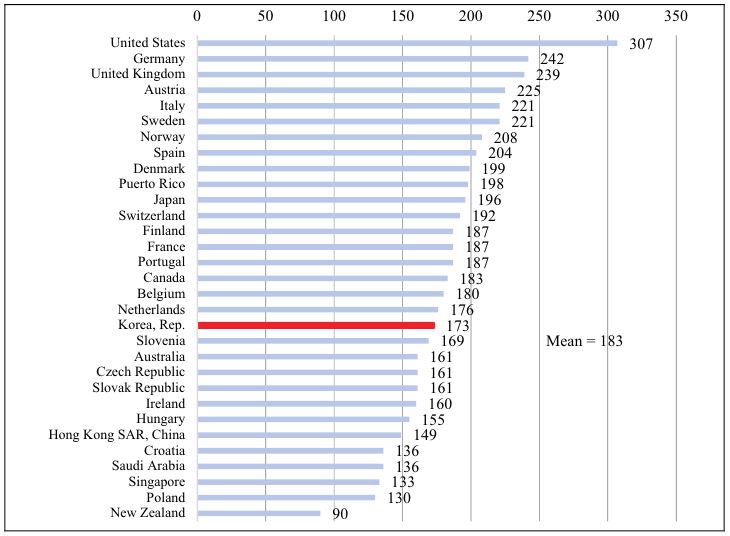
Figure 7.
Number of Post-2005 Drugs Sold in 2018 as % of All Drugs Sold in 2018: High-income Countries
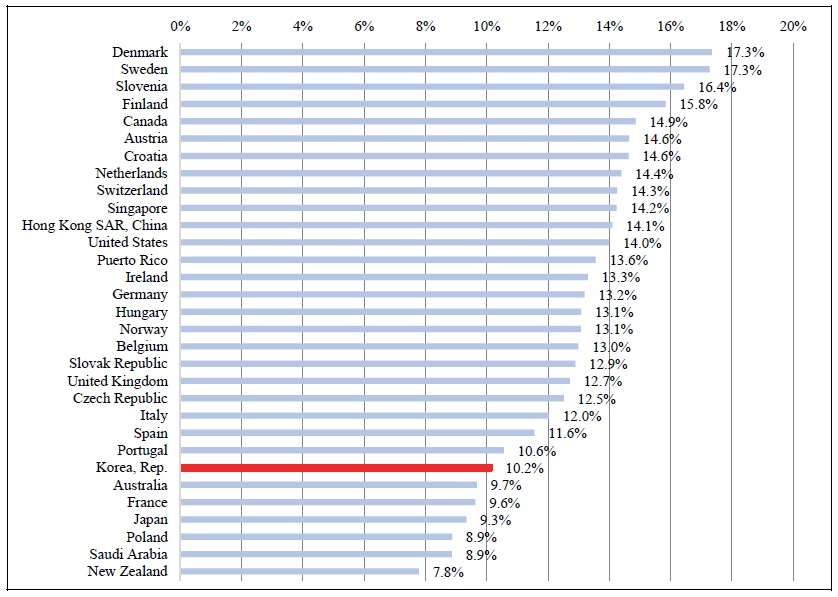
Figure 8.
Number of Post-2005 Standard Units Sold in 2018 as % of Total Number of Standard Units Sold in 2018: High-income Countries
Appendix Figure 1.
Correlation across 35 European Countries between 2005‐2015 Changes in Mean Age at Death and Life Expectancy at Birth
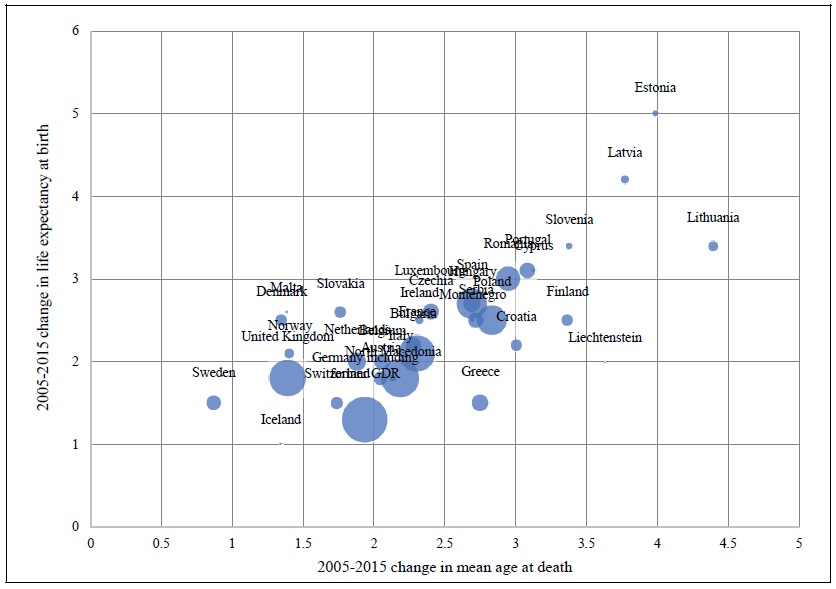
Bubble size is proportional to the number of deaths in 2015.
Source: Author’s calculations based on data from Eurostat database.
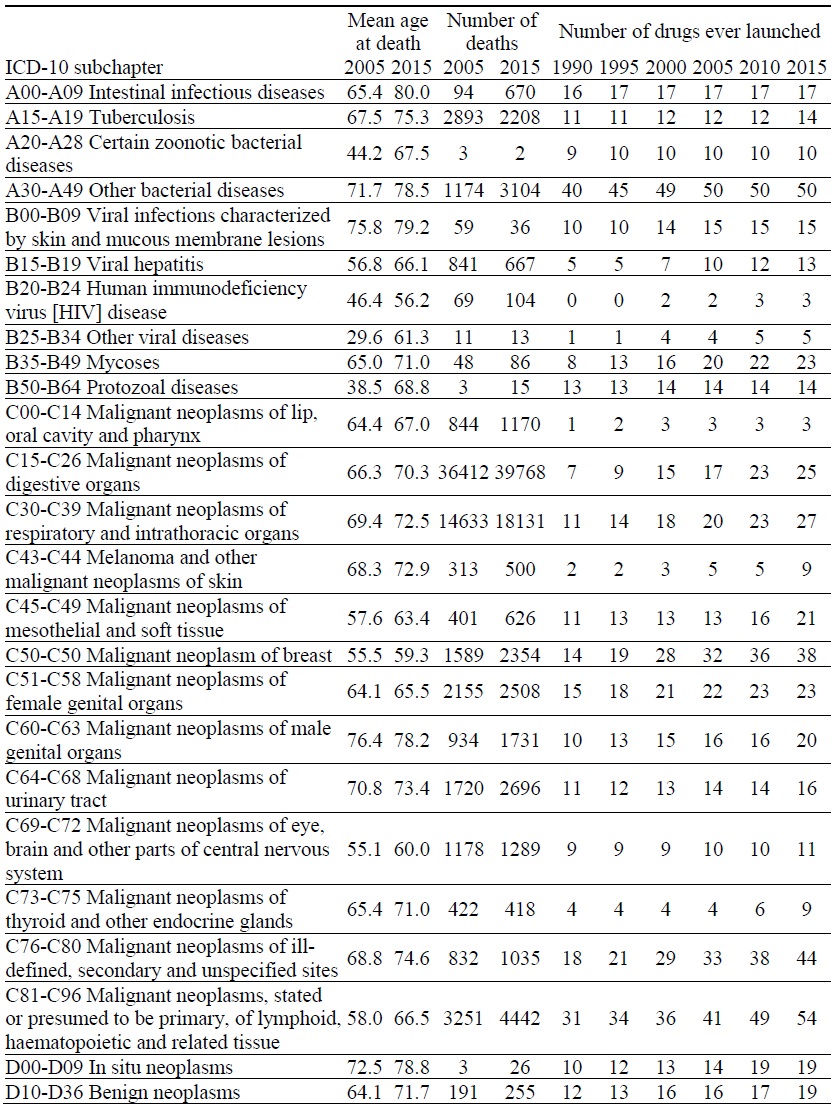
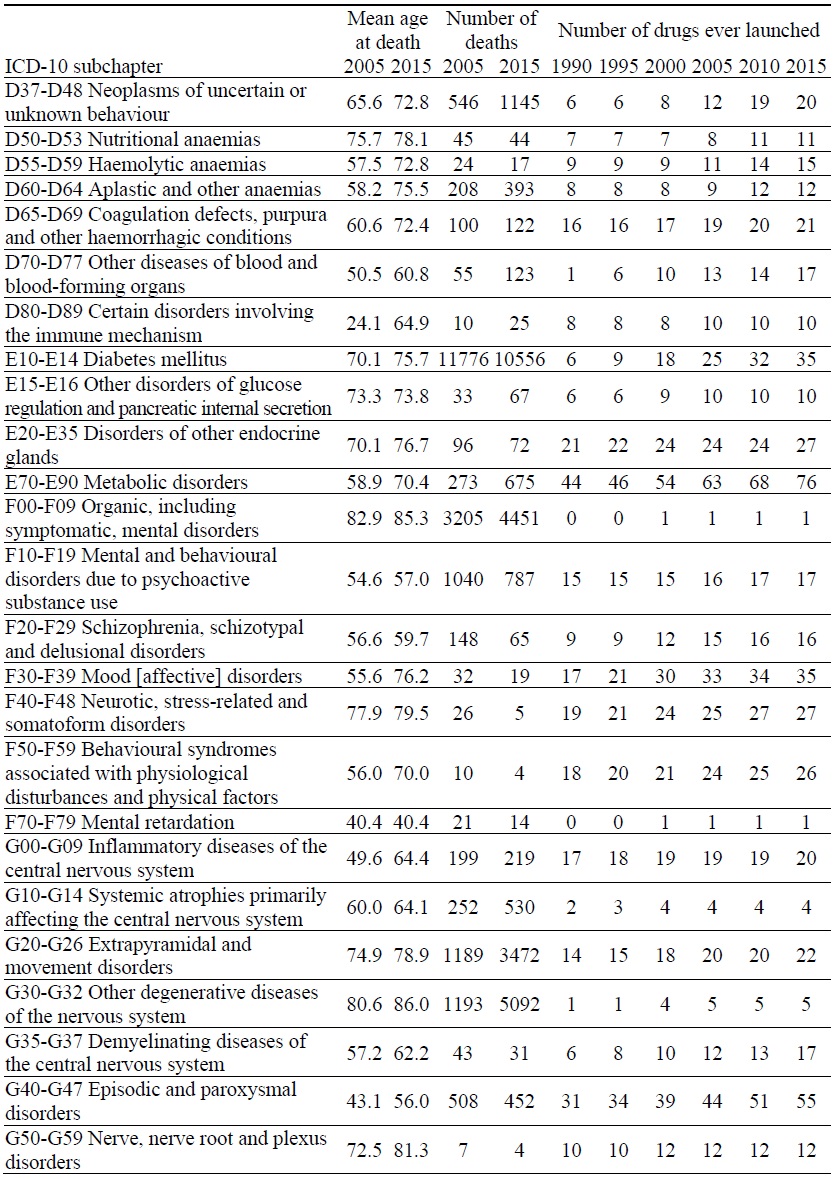
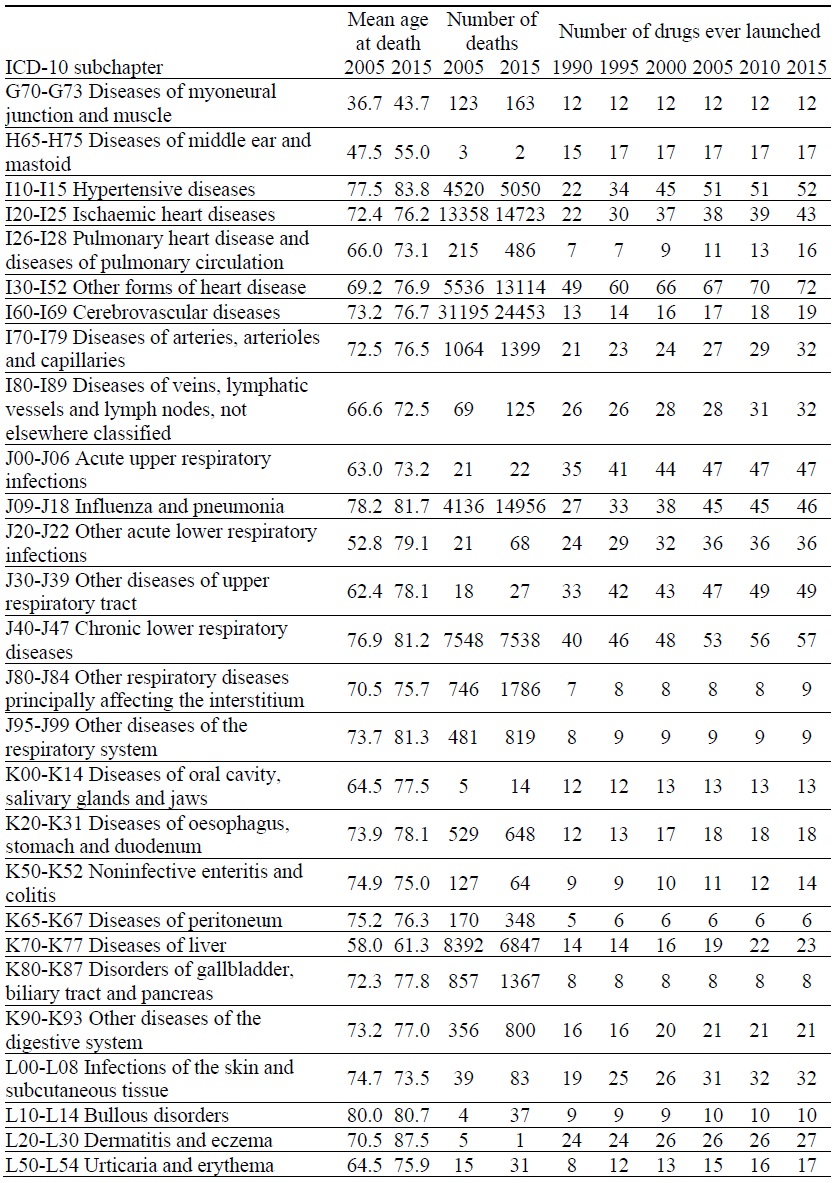
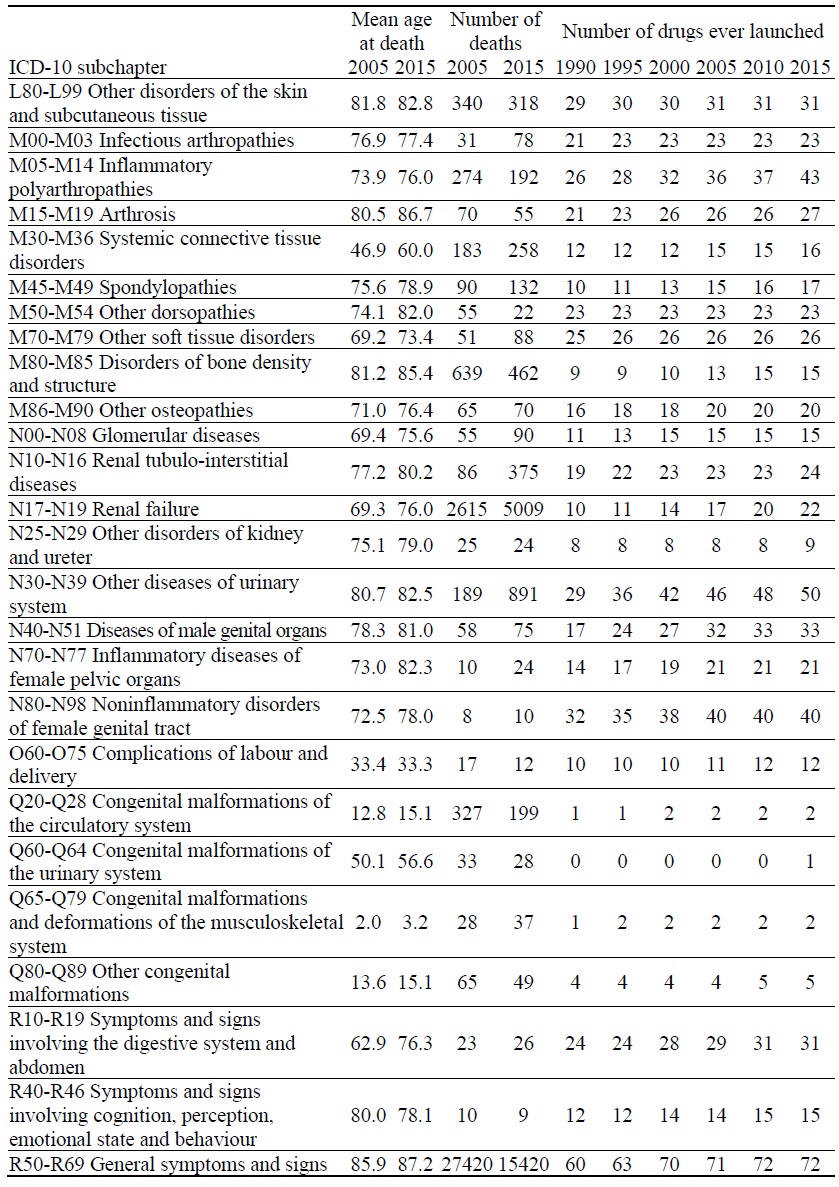
Appendix Table 1.
Data on Mortality and Number of Drugs ever Launched, by ICD-10 Block
Appendix Table 2.
Data on Cancer Survival and Incidence Rates and Number of Drugs ever Launched, by Cancer Site
Appendix Table 3.
Data on Number of Hospital Days and Number of Drugs ever Launched, by Disease

References
-
Aghion, P. and P. Howitt. 2005. Growth with Quality-Improving Innovations: An Integrated Framework. In Aghion, P. and S. N. Durlauf. (eds.)
Handbook of Economic Growth . vol. 1, part A, Amsterdam: Elsevier. pp. 67-110. -
Bertram, M. Y., Lauer, J. A., De Joncheere, K., Edejer, T., Hutubessy, R., Kieny, M. P. and S. R. Hill. 2016. “Cost-Effectiveness Thresholds: Pros and Cons,”
Bulletin World Health Organization , vol. 94, no. 12, pp. 925-930.
- Bils, M. 2004. Measuring the Growth from Better and Better Goods. NBER Working Paper, no. 10606.
-
Bresnahan, T. F. and R. J. Gordon. 1996.
The Economics of New Goods . Chicago: University of Chicago Press. -
Centre National Hospitalier d’Information sur le Médicament. 2019. Thériaque database. <
http://www.theriaque.org/apps/contenu/accueil.php > (accessed January 21, 2020) -
Dorsey, E. R., de Roulet, J., Thompson, J. P., Reminick, J. I., Thai, A. White-stellato, Z., Beck, C. A., George, B. P., and H. Moses III. 2010. “Financial Anatomy of Biomedical Research, 2003-2008,”
Journal of the American Medical Association , vol. 303, no. 2, pp. 137-143.
-
Grossman, G. M. and E. Helpman. 1991.
Innovation and Growth in the Global Economy . Cambridge: MIT Press. -
Hausman, J. 2001. “Mismeasured Variables in Econometric Analysis: Problems from the Right and Problems from the Left,”
Journal of Economic Perspectives , vol. 15, no. 4, pp. 57-67.
-
International Federation of Pharmaceutical Manufacturers & Associations. 2017. The Pharmaceutical Industry and Global Health: Facts and Figures 2017. <
https://www.ifpma.org/wp-content/uploads/2017/02/IFPMA-Facts-And-Figures-2017.pdf > (accessed January 21, 2020) -
Jones, C. I. 1998.
Introduction to Economic Growth . New York: W.W. Norton. -
Jones, C. I. 2002. “Sources of U.S. Economic Growth in a World of Ideas,”
American Economic Review , vol. 92, no. 1, pp. 220-239.
-
Jovanovic, B. and Y. Yatsenko. 2012. “Investment in Vintage Capital,”
Journal of Economic Theory , vol. 147, no. 2, pp. 551-569.
-
Jung, K.-W., Won, Y.-J., King, H.-J., Lee, E. S. and The Community of Population-Based Regional Cancer Registries. 2018. “Cancer Statistics in Korea: Incidence, Mortality, Survival, and Prevalence in 2015,”
Cancer Research and Treatment , vol. 50, no. 2, pp. 303-316.
-
Koç, C. 2004. “The Productivity of Health Care and Health Production Functions,”
Health Economics , vol. 13, no. 8, pp. 739-747.
-
Kolata, G. 2019. Surgery for Blocked Arteries Is Often Unwarranted, Researchers Find.
New York Times , vol. 169, no. 58,514, Section A, p. 19. (Print November, 17, Online November, 16) -
Lichtenberg, F. R. 2009. “Have Newer Cardiovascular Drugs Reduced Hospitalization? Evidence from Longitudinal Country-Level Data on 20 OECD Countries, 1995-2003,”
Health Economics , vol. 18, no. 5, pp. 519-534.
-
Lichtenberg, F. R. 2014a. “Has Medical Innovation Reduced Cancer Mortality?”
CESifo Economic Studies , vol. 60, no. 1, pp. 135-177.
-
Lichtenberg, F. R. 2014b. “The Impact of Pharmaceutical Innovation on Longevity and Medical Expenditure in France, 2000-2009,”
Economics and Human Biology , vol. 13, pp. 107-127.
-
Lichtenberg, F. R. 2014c. “Pharmaceutical Innovation and Longevity Growth in 30 Developing and High-income Countries, 2000-2009,”
Health Policy and Technology , vol. 3, no. 1, pp. 36-58.
-
Lichtenberg, F. R. 2014d. “The Impact of Pharmaceutical Innovation on Disability Days and the Use of Medical Services in the United States, 1997-2010,”
Journal of Human Capital , vol. 8, no. 4, pp. 432-480.
-
Lichtenberg, F. R. 2018. “The Impact of New Drug Launches on Hospitalization in 2015 for 67 Medical Conditions in 15 OECD Countries: a Two-Way Fixed-Effects Analysis,”
Forum for Health Economics & Policy , vol. 21, no. 2. <https://doi.org/10.1515/fhep-2018-0009 > (accessed January 21, 2020)
-
National Cancer Institute. 2012. Long-Term Trial Results Show No Mortality Benefit from Annual Prostate Cancer Screening. <
https://www.cancer.gov/types/prostate/research/screening-psa-dre > (accessed December 7, 2019) -
National Cancer Institute. 2019. Enhancing Drug Discovery and Development. <
https://www.cancer.gov/research/areas/treatment/enhancing-drug-discovery > (accessed December 7, 2019) -
National Institute for Health and Care Excellence. 2019. The Guidelines Manual: Assessing cost effectiveness. <
https://www.nice.org.uk/process/pmg6/chapter/assessing-cost-effectiveness > (accessed December 7, 2019) -
Nordhaus, W. D. 2005. “Irving Fisher and The Contribution of Improved Longevity to Living Standards,”
American Journal of Economics and Sociology , vol. 64, no. 1, pp. 367-392. -
Organisation for Economic Co-operation and Development (OECD). 2019a. OECD Health Statistics 2019 Definitions, Sources and Methods Hospital discharges by diagnostic categories. <
http://stats.oecd.org/wbos/fileview2.aspx?IDFile=1aac08d9-99d5-4b52-9aa8-b bc8da33454b > (accessed March 21, 2020) -
Organisation for Economic Co-operation and Development (OECD). 2019b. International shortlist for hospital morbidity tabulation. <
http://stats.oecd.org/wbos/fileview2.aspx?IDFile=e477970b-3024-4188-8dc6-13f3db201846 > (accessed March 21, 2020) -
Organisation for Economic Co-operation and Development (OECD). 2019c. OECD Health Statistics database. <
https://stats.oecd.org/Index.aspx?ThemeTreeId=9 > (accessed December 7, 2019) -
Sampat, B. and F. R. Lichtenberg. 2011. “What are the Respective Roles of the Public and Private Sectors in Pharmaceutical Innovation?”
Health Affairs , vol. 30, no. 2, pp. 332-339.
-
Statistics Korea. 2010. 2009 Life Tables for Korea. <
http://kostat.go.kr/portal/eng/pressReleases/8/6/index.board?bmode=download&bSeq=&aSeq=273094&ord=1 > (accessed January 21, 2020) -
U.S. Department of Veterans Affairs, Health Economics Resource Center. 2019. Budget Impact Analysis. <
https://www.herc.research.va.gov/include/page.asp?id=budget-impact-analysis > (accessed January 21, 2020) -
World Health Organization (WHO). 2019. Cause of Death Query online database. <
https://apps.who.int/healthinfo/statistics/mortality/causeofdeath_query/start.php > (accessed January 21, 2020) -
Yang, S., Khang, Y.- H., Harper, S., Davey Smith G., Leon, D. A. and J. Lynch. 2010. “Understanding the rapid increase in life expectancy in South Korea,”
American Journal of Public Health , vol. 100, no. 5, pp. 896‐903.