

- EAER>
- Journal Archive>
- Contents>
- articleView
Contents
Citation
Article View
East Asian Economic Review Vol. 19, No. 3, 2015. pp. 275-322.
DOI https://dx.doi.org/10.11644/KIEP.JEAI.2015.19.3.299
Number of citation : 7View
2200
Download
348
Study on Return and Volatility Spillover Effects among Stock, CDS, and Foreign Exchange Markets in Korea
|
Taly I |
Korea Research Institute for Human Settlements (KRIHS) |
|---|

Abstract
The key objective of this study is to investigate the return and volatility spillover effects among stock market, credit default swap (CDS) market and foreign exchange market for three countries: Korea, the US and Japan. Using the trivariate VAR BEKK GARCH (1,1) model, the study finds that there are significant return and volatility spillover effects between the Korean CDS market and the Korean stock market. In addition, the return spillover effects from foreign exchange markets and the US stock market to the Korean stock market, and the volatility spillover effect from the Japanese stock market to the Korean stock market are both significant.
JEL Classification: F31, F41, G15
Keywords
Spillover Effect, CDS Spread, Stock Price, Foreign Exchange Rate, Multivariate VAR GARCH
I. INTRODUCTION
A number of studies have examined the effect of macroeconomic variables on financial asset returns. Since the work of Ross (1976), various macroeconomic variables such as GDP, inflation, and the trade balance as well as financial market variables such as interest rates and exchange rates have been tested to identify the influential factors for the expected return of a financial asset. However, few studies have been conducted about the relationships between macroeconomic volatility and asset market volatility. Schwert (1989) states that volatility in macroeconomic fundamentals and financial market factors are helpful in predicting stock return volatility, and vice versa.
The key objective of this study is to investigate the return and volatility spillover effects between domestic and international financial and asset markets focused on the Korean economy. In particular, the presence of return and volatility spillover effects from country risk and advanced economy asset markets to Korean asset markets is the primary interest in this study.
Before approaching the main subject, it is necessary to specify the concept of country risk. The Credit Default Swap (CDS) spread underlying government bonds is used as a measure of country risk in this paper.1 The CDS premium generally rises when credit risk of the underlying asset increases. Hence, the CDS premium is interpreted as a measure of credit rating of the authorities or the institutions which issue the underlying asset. For this reason, the CDS premium which is on the basis of bond in foreign money issued by the each country’s government is used well as an indicator which reflects the country’s credit rating.
There have been considerable studies which show when external or internal economic and financial shocks affect the country’s economy, the CDS market reacts sensitively and shows the current state through its index, called the CDS spread (see Remolona et al., 2008; Baum and Wan, 2010; Longstaff et al., 2011). However, compared with the substantial amount of empirical and theoretical studies on the foreign CDS market since 2000, most studies related to credit risk in Korea have focused on the credit premium in the bond market because of immature market conditions and deficiency of data for the Korean CDS market. Recently, several pioneering works for the Korean CDS spread are in progress. Nam and Byun (2006) conduct empirical analysis to find deterministic elements of the Korean CDS spread. They find that variations of the Korean CDS spread is affected by the variations of past value of CDS spread itself, domestic macroeconomic fundamentals, and financial variables such as yields on government bonds, stock prices, and the won/dollar exchange rate. They also find that the CDS market is more efficient in reflecting the change of credit status in the underlying asset to the change of credit risk spread than is the bond market. Considering the determinants of the CDS premium underlying Korean government bonds, Kim (2009) finds that typically well-known determinants of the CDS premium such as the short-term foreign debt ratio, exchange rate, and stock prices are ascertained to be statistically significant in the Korean CDS market. That is, he finds that the CDS premium decreases when stock prices increase and the exchange rate decreases.
Early studies on the relationship between CDS spread and other macroeconomic or financial market variables usually focus on the link between the levels of the series without considering the link between the returns or volatilities of the series. However, examining the relationship between returns or volatilities of the series reflects the current trend of studies on the analysis for the relationship between financial markets. In a study on the relationship between CDS spread change and stock return, Norden and Weber (2009) analyse the relationship among CDS, bond and stock markets empirically. They find that stock returns affect CDS and bond spread changes, and the CDS market is significantly more sensitive to the stock market than the bond market is.
It has become clear that globalization of financial markets requires advanced econometric models capturing the correlation between the financial markets in the aspect of return and volatility. The multivariate GARCH (MGARCH) model has been commonly used to estimate the relationships between the volatilities of several financial markets since the studies by Bollerslev et al. (1988) and Engle and Kroner (1995). The latest trend of research using the MGARCH model focuses on the persistence and transmission of volatility from one market to other markets, and now it is widely accepted that financial volatilities move together over time and across assets and markets (Bauwens et al., 2006). Recent study using the MGARCH model to examine the volatility spillover effect between CDS market and other financial markets is performed by Meng et al. (2009). They investigate the volatility transmission among CDS, equity, and bond markets, and they find that volatility in any of the three markets is commonly transmitted to the other two markets. In a recent study on volatility spillover effects for Korean financial markets, Kim (2007) investigates the return and volatility spillover effects among stock, bond, and foreign exchange markets using the MGARCH model. He finds that the volatility spillover effect from the stock market to the foreign exchange market is statistically significant.
This paper follows the stream of earlier studies about the relation between CDS market and other financial markets. However, the difference of the paper is to investigate the return and volatility spillover effects among stock market, CDS market and foreign exchange market for Korea, the US and Japan using a trivariate VAR GARCH model.
To specify the main objective, the following four questions are suggested. First, are there return and volatility spillover effects among foreign exchange markets, the Korean CDS market, and the Korean stock market? Second, are there return and volatility spillover effects from US and Japanese stock markets to the Korean stock market and Korean CDS market? Third, how do the Korean CDS spread change, exchange rate change, and Korean stock return respond to each increasing return (change) shock? Fourth, how do the Korean stock return and Korean CDS spread change respond to increasing shocks in US and Japanese stock returns? To answer these questions, weekly data of CDS spread, foreign exchange rates, and stock prices for three countries are used over the period of 2002 to 2010 using a multivariate GARCH model.
The answers to these questions can be briefly summarized that there are significant return and volatility spillover effects between the Korean CDS market and the Korean stock market. In addition, the return spillover effects from foreign exchange markets and the US stock market to the Korean stock market, and the volatility spillover effect from the Japanese stock market to the Korean stock market are both significant.
The rest of the paper is organized as follows. Section 2 presents descriptive statistics and results of the tests on data. Section 3 lays out the econometric methodology. The main results are presented in section 4, and section 5 concludes the paper.
1)A CDS is a swap contract between two parties, a protection buyer, and a protection seller. A protection buyer who wants to transfer the credit risk pays a premium (spread) to the protection seller in exchange for a payment if a credit event occurs with a reference entity. As a bond holder buys a CDS to hedge the default risk, the characteristics of a CDS are similar to that of credit insurance. Another characteristic of a CDS is that it is a financial good which can be bought and sold by investors.
II. DESCRIPTIONS OF DATA AND STATISTICAL CHARACTERISTICS
Weekly data for Korean, US and Japanese stock returns, Korean CDS spread change, and Korean-US and Korean-Japanese exchange rate (hereafter W/D denotes Korean-US exchange rate and W/Y denotes Korean-Japanese exchange rate.) changes are used to compose financial and asset market variables for the MGARCH model.2 KOSPI, S&P 500, and NIKKEI 225 are used for Korean, US and Japanese stock market indices, respectively, which are obtained from the Korea Centre for International Finance (KCIF). The CDS spread underlying the five-year maturity Korean government bond is used, because the five-year is not only the most common liquid maturity in the swap market but it is also widely announced to the public. The Korean CDS spread data are obtained from the KCIF. The data source of the two exchange rates is the Bank of Korea. The data period starts from the first week of January 2002 and ends at the fourth week of February 2010. All weekly data are composed on the basis of Friday’s observation. When there is no observation on Friday due to reasons such as public holiday, observation of the day before (Thursday) is used as a replacement.
Figure 1 shows the time series of the CDS spread underlying Korean government bonds and the Korean stock market index (KOSPI). With the exception of the moment that CDS spread rose rapidly due to the SK accounting fraud and the credit card debacle in March 2003, the CDS spread maintained its downward stability for several years due to some favourable factors such as reduced risk of North Korea’s nuclear problem and the prospect of upgrading Korea’s sovereign credit rating since 2004. However, the highest point of the CDS spread was recorded at the time of the Lehman Brothers’ collapse in September 2008, and thereafter, it showed a sharp decline due to the currency swap contract between the US and Korea in November 2008. In this way, increase in the CDS spread underlying government bonds implies increasing sovereign risk and, in contrast, decrease in the CDS spread means decreasing sovereign risk.
For the Korean stock market index, Korea Composite Stock Price Index (KOSPI) is used to represent the asset market condition as well as the general Korean economic condition. The time path of Korean stock market index illustrated in Figure 1 shows negative process compared to the time path of CDS spread. This implies that the Korean stock market booms during economically stable periods of low country risk. Figure 1 displays the gradual increase in the Korean stock market index to more than double when the CDS spread was low during the stable period from 2004 to 2007. However, the Korean stock market index dropped immediately when the CDS spread soared in 2008. Hence, it is expected that there might be a negative relationship between Korean stock price and country risk.
Another interesting issue of this paper is the identification of the contagion from the advanced asset market to the Korean asset market. Figure 2 shows the time series of stock market indices for the US and Japan. The stock market is employed in this paper as a representative asset market for three countries: Korea, the US and Japan. The US stock price is adopted as a global stock price, and the Japanese stock price is adopted as a regional stock price. The time paths of two indices look very similar to that of the Korean stock market index in Figure 1. From these figures, it is also expected that the Korean stock market has a close relationship with the US and Japanese stock market.
Along with the CDS spread, fluctuations in the exchange rate also reflect variation of domestic country risk since the exchange rate generally shows a sensitive response to the credit status of the country. In addition, the foreign exchange market plays a role in establishing the first contact from the variation in international financial markets through the exchange rate, and it spreads the effect to the domestic economy. The time series of the W/D and W/Y are illustrated in Figure 3.
The two time series of exchange rates show similar fluctuations through the time path, and their fluctuations are also similar to the CDS spread variation in Figure 1. Hence, it is expected that there is a positive relationship between the CDS spread underlying Korean government bonds and exchange rates. In addition, time paths of two exchange rates show a negative process in comparison to the time path of the Korean stock market index. Thus, it is expected that exchange rates have a negative relationship with the Korean stock price.
The first difference of the log of stock prices, exchange rates, and CDS spreads are used for computing stock returns and changes in exchanges rates and CDS spread. Let

When using the first difference variables, some information regarding a possible linear combination between the levels of the variables may be lost. However, relationships between financial markets are analysed using the first difference of the log of returns and changes instead of using the original level series of financial data in this paper. I concentrate on returns and changes because financial time series usually do not satisfy the basic assumption of the stationary process required to avoid spurious inferences based on regression analysis.
1. Autocorrelation Test
The Ljung-Box Q-statistics are used to test for independence of higher relationships as manifested in volatility clustering by the MGARCH model (Huang and Yang, 2000). The Ljung-Box Q-statistics and their
2. Characteristics of Financial Time Series
Although volatility is not directly observable, it has some characteristics that become known empirically and are commonly seen in financial market returns (changes) as cases of stylized fact.3 First, financial market returns exhibit volatility clustering, which means that large volatilities tend to be followed by large volatilities and small volatilities tend to be followed by small volatilities. Second, volatility varies within some fixed range over time. Third, the empirical distribution of financial market returns shows characteristics of non-normal distribution such as leptokurtic, skew, and fat tail. Before modelling and estimating the spillover effects, investigation regarding the presence of these stylized facts in three asset market returns and three financial market changes is performed.
In Figure 4, the left column displays the time plots of returns and changes in each financial market ( regarded as a proxy of variance for the period from the first week of January 2002 to the fourth week of February 2010. According to the right columns in Figure 4, the volatility clustering is observed in six asset market returns and financial market changes. Figures show that large returns (changes) tend to be followed by large returns (changes). Moreover, the fact that volatility varies within some fixed range over time is also observed.
To examine another characteristic of non-normal distribution, Table 2 provides a summary of the descriptive statistics of each asset market return and financial market change. According to the Jarque-Bera statistic in Table 2, the null hypothesis that return (change) is a normal distribution is rejected, because probability is 0. On the other hand, leptokurtic and fat tail can be acknowledged by observing statistics for skewness and kurtosis. US, Japanese, and Korean stock returns show left-skewed tails (-1.037, -1.372, and -0.713, respectively), and changes in the CDS spread and two exchange rates have right-skewed tails (1.284, 0.863, and 0.843, respectively). Since kurtosis of normal distribution is theoretically 3, all returns and changes are leptokurtic due to excess kurtosis over 3.
Under this circumstance, the assumption of constant variance (homoskedasticity) is inappropriate. When modelling with non-constant variance (heteroskedasticity), there is a way to model the changing variance due to the characteristics of leptokurtic and fat tail in data. ARCH- and GARCH-related models are useful to capture the nonlinear data.
2)Weekly data provide a number of advantages compared to the use of daily data in a multinational analysis. First, the use of weekly data can help avoid the interference due to the different trading days and public holidays between countries. Second, the use of weekly data can help avoid the time zones associated with different opening and closing times
3)Here volatility refers to the conditional variance of the underlying financial market return. Volatility can be applied to measurement of uncertainty as well as measurement of risk.
III. METHODOLOGY
In this paper, the trivariate GARCH model is constructed to provide an insight into the nature of interaction among domestic and foreign financial markets. There is a reason that the trivariate GARCH model is employed; MGARCH models have a well-known weak point that the number of parameters to estimate increases very rapidly as the number of variables increases. Thus, a trivariate GARCH model is suitable to analyse the return and volatility spillover effects among the Korean CDS market, Korean stock market, and one other financial market.
The autoregressive stochastic process of financial market returns (changes) is given in the following conditional mean Equation (2).

where
Since BEKK model ensures a positive semi-definite conditional variance and covariance matrix, which is a requirement needed to guarantee non-negative estimated variances, BEKK model from Engle and Kroner (1995) is used.4 The BEKK parameterization is written as follows:5

The individual elements for C, A, B,

where  and covariances (
variance and covariance equations used to program are presented in Appendix A. The conditional variance equations show how volatilities are transmitted across financial markets over time.
The following log-likelihood function is maximized for the trivariate GARCH model with the assumption that errors are normally distributed:

where
4)The two common parameterizations for the MGARCH model used in previous research are the VECH model introduced by
5)According to the naming way of
6) tiεis the alternative value of past volatility shock during for the case of for the case of
IV. EMPIRICAL RESULTS
To examine the return and volatility spillover effects between change in Korean CDS spread and the Korean stock return, these return and change are commonly included in all four cases. In addition, the W/D change, W/Y change, US stock return, and Japanese stock return are used one after another for the third financial market return or change in each case to investigate another spillover effect from the third financial market return or change to the Korean stock return and Korean CDS spread change.
Estimation for return and volatility spillover effects is conducted using a trivariate GARCH model, and analysis for dynamic interactions between returns and changes are performed using impulse response functions obtained from the unrestricted VAR (1) framework of conditional mean Equation (2). The structure of the four cases is organized as follows:
Case I : W/D change – CDS spread change – Korean stock return
Case II : W/Y change – CDS spread change – Korean stock return
Case III : US stock return – CDS spread change – Korean stock return
Case IV : Japanese stock return – CDS spread change – Korean stock return
1. Foreign Exchange Markets, the Korean CDS Market, and the Korean Stock Market
The estimated coefficients and standard errors of the conditional mean equations and conditional variance equations for Case I and Case II, which include foreign exchange markets as a third financial market, are reported in Table 3. Estimated coefficients of equations (2) and (4) which are based on computing the coefficients of ARCH term and GARCH term in Table 3 are also reported in Appendix B.
First, seeing the results of the conditional mean equation in Case I, which considers the W/D market, Korean CDS market, and Korean stock market, all return spillover effects from the lagged change of the W/D to the current own-market-change, current Korean CDS spread change, and current Korean stock return are significant. Each coefficient is 0.187(
Second, seeing the result of the conditional variance equation in Case I, each persistence of volatility (see the significance of
Third, in comparison to Case I, seeing the result of the conditional mean equation in Case II, which considers the W/Y market, the Korean CDS market and the Korean stock market, return spillover effects from the lagged change of the W/Y to the current own-market-return, the current Korean CDS spread change, and the current Korean stock return are -0.279 (
Fourth, seeing the result of the conditional variance equation in Case II, the persistence of volatility (see the significance of
For better understanding, simple figures for the results of return and volatility spillover effects for Case I and Case II are presented in Figure 5. Some empirical research provides evidence of return spillover effects between the stock market and the foreign exchange market (see Roll, 1992; Dumas and Solnik, 1995; Choi et al., 1998; Phylaktis and Ravazzolo, 2005). They find the presence of bidirectional return spillover effects between the foreign exchange market and the stock market. In contrast to these results, during the data period for Korea, there is a unidirectional return spillover effect from foreign exchange markets to the Korean stock market.
In the meantime, although there are significant unidirectional volatility spillover effects from two foreign exchange markets to the Korean CDS market, there is no significant volatility spillover effect from two foreign exchange markets to the Korean stock market. Some empirical research provides different results of volatility spillover effects between the stock market and the foreign exchange market. Francis et al. (2002) and Wu (2005) find significant bidirectional volatility spillovers between the stock market and the foreign exchange market. Beer and Hebein (2008) find significant volatility spillovers from the foreign exchange market to the stock market for several countries. To the contrary, Kanas (2000) and Kim (2001) find the presence of unidirectional volatility spillover from the stock market to the foreign exchange market. Although there are no volatility spillover effects between the W/D market and the Korean stock market, the significant unidirectional volatility spillover effect from the Korean stock market to the W/Y market is in line with the results of Kanas (2000) and Kim (2001).
In terms of the relationship among the CDS, foreign exchange, and stock markets, Nam and Byun (2006) claim a significant effect from the variations of stock prices and the exchange rate to the variation of the Korean CDS spread. Baum and Wan (2010) indicate the significant effect from the second moment of the stock index to the CDS spread. The results of this study are consistent with those of foregoing studies that there is a significant return spillover effect from the foreign exchange market to the CDS market and from the CDS market to the stock market, and a significant volatility spillover effect from the stock market to the CDS market.
Considering the relationships in mean equations from a different angle, time varying impulse responses to positive one standard deviation of each return (change) shock are provided to illustrate the dynamics of the trivariate GARCH system for the conditional mean returns (changes) of financial markets. Impulse response functions are reported based on the mean Equation (2). The errors (
Figures 6 and 7 show similar impulse responses for each case. First, carrying out a thorough inspection of the results, the Korean CDS spread change increases immediately and returns to a steady-state level in one month to one standard deviation increasing shocks of the two exchange rate changes. Since increase in the exchange rate, which implies an increasing risk premium in foreign exchange market, is related to increasing country risk, the result of the increasing Korean CDS spread change is reasonable. This result is consistent with that of Kim (2009). To the contrary, the Korean stock return shows negative response immediately and recovers to the pre-shock level within one month to increasing shocks of the two exchange rate changes. This result is the same as previous research that draws the conclusion of a negative relationship between foreign exchange rate change and the Korean stock return (Chung, 2002).
The flow approach of Dornbusch and Fischer (1980) affirms that currency movements affect international competitiveness and the balance of trade position. As a result, the real output of the country is changed, and then this changed economic activity affects current and future cash flows of companies and stock prices. From this perspective, a depreciation in the Korean currency leads to increasing Korean exports, and consequently this will cause an increase in Korean stock prices due to increased output. In contrast, when the Korea currency is depreciated, prices rise because of increased import prices, and this will cause domestic interest rates to rise. The stock prices will fall because of higher interest rates. In addition, because of expected foreign-exchange loss stemming from the sudden rise in exchange rate, investment of foreign capital in the Korean asset market will not increase. Consequently, for the Korean economy during the data period, the Korean stock return responds negatively to the increasing exchange rate change shock.
The data also support these results of impulse responses. As I mentioned in Figure 1, the time path of KOSPI which represent the asset market condition as well as the general Korean economic condition shows negative process compared to the time path of CDS spread which means domestic country risk. Hence, the result of decrease in stock return to increasing CDS spread change shock is in accordance with the characteristics of negative relation between two financial markets.
Second, two exchange rate changes do not respond at first to the increasing Korean CDS spread change shock. However, they show delayed overshooting after the initial stage and return to the steady-state level in one month. The reason that the Korean currency depreciates is due to the increased country credit risk reflected by the increased CDS spread underlying Korean government bonds. In comparison to the exchange rate change responses, the impulse response in the Korean stock return to the increasing Korean CDS spread change shock displays immediate falling, and then afterward, the Korean stock return goes back to the pre-shock level in one month. Since investment is sensitively affected by the risk in assets, increased country risk due to increasing country credit spread causes decreasing foreign investment in the Korean asset market. It goes without saying that this condition makes the Korean stock return fall. This response pattern is very similar to the case of an increasing exchange rate change shock. The reason is that, according to the time paths displayed in Figure 3, the two time series of W/D and W/Y which imply another country risk show similar fluctuations and their fluctuations are also similar to the CDS spread variation in Figure 1. Hence, the results of decrease in stock return and increase in CDS spread change to increasing W/D and W/Y change shock is in line with the characteristics of negative relation between foreign exchange market and stock market and positive relation between foreign exchange market and CDS market.
Third, impulse responses in the two exchange rate changes and the Korean CDS spread change to the increasing Korean stock return shock look similar. There are no responses at the initial stage, but they show delayed overshooting and return to the pre-shock level in one month. According to economic theory and previous empirical results, the change in the stock market has an influence on the change in the foreign exchange market negatively or positively (see Aggarwal, 1981; Phylaktis and Ravazzolo, 2005; Pan et al., 2007; Rahman and Uddin, 2009).
These conflicting results are explained by several economic theories related to the determinants of the exchange rate. According to the perspective of the flow approach, an increase in the Korean stock market conveys information about improved performance in the Korean economy, and it can be expected that imports in Korea will increase due to the better economic state. For this reason, demand for foreign currency leads to a depreciation in Korean currency. On the other hand, according to the monetary approach and portfolio balance approach, agents allocate their wealth among alternative assets such as foreign stocks and domestic money, bonds, and stocks. The role of the exchange rate is to balance the foreign and domestic asset demands and supplies. Hence, if there is a change in the demand and supply of Korean stock, this will change the equilibrium exchange rate. If the Korean stock price rises, it will persuade foreign investors to buy more Korean stock by selling foreign assets to obtain Korean currency. Increase in demand for Korean currency will lead to appreciation of the Korean currency (see Frankel, 1983). In addition, if the Korean stock price rises, this will lead to the growth of wealth, which will increase the demand for money. The excess demand for money will cause interest rates in Korea to rise, and in this situation, more foreign capital will be attracted and increase the foreign demand for the Korean currency (see Gavin, 1989). As a result, the Korean currency will appreciate. Thus, the overall effect on the exchange rate will depend on the relative strength of the various competing effects (Phylaktis and Ravazzolo, 2005). For the Korean economy during the data period, increase in the Korean stock return shock has a positive influence on exchange rate changes.
2. US and Japanese Stock Markets, the Korean CDS Market, and the Korean Stock Market
The empirical results for Case III and Case IV, which include two large countries’ stock returns, the Korean CDS spread change and the Korean stock return are reported in Table 4. Estimated coefficients of equations (2) and (4) which are based on computing the coefficients of ARCH term and GARCH term in Table 4 are also reported in Appendix B.
First, seeing the results of the conditional mean equation in Case III which considers the US stock market, the Korean CDS market, and the Korean stock market, return spillover effects from the lagged US stock return to the current CDS spread change and the current Korean stock return are -0.774 (
Second, seeing the result of the conditional variance equation in Case III, the only significant persistence of volatility (see the significance of
Third, in comparison with Case III, the result of the conditional mean equation in Case IV, which considers the Japanese stock market, the Korean CDS market, and the Korean stock market, indicates that there is no meaningful return spillover effect among the three financial markets.
Fourth, as indicated by the result of the conditional variance equation in Case IV, the persistence of volatility (see the significance of
For better understanding, simple figures for the results of return and volatility spillover effects for Case III and Case IV are presented in Figure 8. Considering synthetically Case IV together with Case III examining the return and volatility spillover effects among the Korean CDS market, the Korean stock market, and the US or Japanese stock markets, there are significant cross-market return spillover effects from the US stock market to the Korean CDS market and the Korean stock market. In contrast, there are significant cross-market volatility spillover effects from the Japanese stock market to the Korean CDS market and the Korean stock market. This result is consistent with Scheicher (2001), who shows that the regional influences are the cause of volatility in the markets, whereas international volatility has no impact on small stock markets. Beirne et al. (2010) conclude that return and volatility spillover effects exist from global or regional stock markets to local emerging markets. Studies by Karolyi (1995), Chou et al. (1999), Worthington and Higgs (2004), Harris and Pisedtasalasai (2006), and Sun and Zhang (2009) are also in line with this result. They show that there are return and volatility spillover effects from the advanced stock market to the smaller stock market.
Commonly in these two cases, although there is no significant bidirectional cross-return-spillover effect between the Korean CDS market and the Korean stock market besides the significant effect from the Korean stock market to the Korean CDS market in Case III, bidirectional cross-market volatility spillover effects between two Korean financial markets are significant. Through the results of volatility spillover effects between the Korean CDS market and the Korean stock market from Case I to Case IV, there are significant bidirectional volatility spillover effects between two Korean financial markets except only one unidirectional effect. This can be interpreted that a decrease in the Korean CDS spread uncertainty, which implies that the country state is stable, leads to a decrease in the Korean stock market uncertainty and, as a result, there is a decrease in volatility and persistence in the Korean stock market. On the other hand, a decline in the Korean stock return uncertainty, which implies the stable state of asset markets, causes the volatility and persistence in the Korean CDS market to decrease because of the decreased Korean CDS spread uncertainty.
Although a study by Bala and Premaratne (2003) shows that the volatility spillover effect from the smaller stock market to the dominant stock market is plausible, most of the other earlier research concludes that spillover effects are significant only from the dominant market to the smaller market. Because the Korean stock market is relatively small, it is plausible that the influence from the Korean stock market and the Korean CDS market to global stock market such as that of the US and a regional stock market such as that of Japan is insignificant, although some statistics indicate significance. Hence, only results are reported without further explanation.
To observe the time varying impulse responses of return and change series to positive financial market return and change shocks in the unrestricted VAR(1) model reported in Equation (2), the results with one standard error bands are presented in Figure 9 for Case III and in Figure 10 for Case IV. Figures 9 and 10 illustrate the impulse response functions of Case III and Case IV including US and Japanese stock markets along with the Korean CDS market and the Korean stock market, which show similar responses in each case. Basically, impulse responses of the Korean CDS spread change and the Korean stock return to one standard deviation increasing US and Japanese stock return shocks show similarities except for the different numerical values and the required periods to return to the steady-state level.
Describing the detailed results, the Korean CDS spread change falls immediately and returns to the pre-shock level to increasing US and Japanese stock return shocks. In contrast, the Korean stock return rises immediately and returns to the pre-shock level to the same shocks. This result is consistent with the findings of Phylaktis and Ravazzolo (2005), who argue that an increase in the US stock market causes the local stock market to rise as a result of the greater integration between Pacific Basin countries’ markets and world markets. Compared to the required period to return to the steady-state level, responses in the Korean CDS spread change and the Korean stock return to increasing Japanese stock return shock are shorter by about one period (week) than responses in the Korean CDS spread change and the Korean stock return to the increasing US stock return shock. This implies that change in the US stock market has a longer effect on the movement in the Korean CDS market and the Korean stock market than change in the Japanese stock market does.
Since the characteristics of CDS spread underlying government bonds is an indicator of country risk, the global financial crisis period is included in the data period. However, since the financial crisis has a temporary effect on the long-run co-movement of financial markets generally, there is a possibility that the trivariate GARCH model induces distorted results if the estimation process undergoes the data period which includes a structural break like a financial crisis (Phylaktis and Ravazzolo, 2005). Hence, I also conduct the empirical test under the same conditions with a different data period, which excludes the global financial crisis period.7 In comparison with the results for the whole period, there is no remarkable difference between the two without the fact that more significant return and volatility spillover effects exist in the case of the whole period than that of pre-global financial crisis period. It can be expected that risk transmission during the global financial crisis period works more strongly than usual. The results from the test with data for the pre-global financial crisis period are reported in Appendix C.
7)I segment the pre-global financial crisis period on the basis of the collapse of Lehman Brothers in September 2008 (37th week of 2008) from the whole data period used in the main text.
V. CONCLUSION
This study examines the return and volatility spillover effects among several domestic and foreign financial markets in Korea for the period from the first week of January 2002 to the fourth week of February 2010. In particular, the relationship between the CDS underlying the Korean government bond market, which uses CDS spread as an indicator implying country risk, and the Korean stock market, which is a representative domestic asset market, is the main focus. Foreign exchange markets and advanced stock markets are added to investigate the relationships along with the Korean stock market and the Korean CDS market in a model. This study employs the trivariate GARCH model to capture the return and volatility transmission mechanism. In addition, to account for the dynamic interactions among financial market returns and changes, impulse response analysis is conducted.
The answers to questions presented in the introductory section 1 can be briefly summarized as follows. First, there are significant return spillover effects from the two foreign exchange markets to the Korean CDS market and Korean stock market and unidirectional volatility spillover effects from foreign exchange markets to the Korean CDS market. Second, return spillover effects from the US stock market to the Korean CDS market and the Korean stock market are significant, whereas volatility spillover effects from the Japanese stock market to the Korean CDS market and the Korean stock market are significant. In most cases, there are bidirectional return and volatility spillover effects between the Korean CDS market and Korean stock market. Third, increase in exchange rate changes leads to increase in Korean CDS spread change and decrease in Korean stock return. Fourth, increase in US and Japanese stock returns lead to decrease in Korean CDS spread change and increase in Korean stock return.
This study on return and volatility spillover effects among the CDS market, stock market, and foreign exchange market can provide useful information for risk analysis to domestic and foreign financial market participants. It is due to the evidence that volatility transmission exists among these financial markets, which means increasing volatility in one financial market is a clear signal of increasing volatility in other financial markets.
Tables & Figures
Figure 1.
Korean CDS Spread and KOSPI

Note: Solid line of KCDS denotes the CDS spread underlying Korean government bonds. Dotted line of KSI denotes the Korean stock market index (KOSPI). Numerical values on the left side are KCDS, and numerical values on the right side are KSI.
Figure 2.
S&P 500 and NIKKEI 225

Note: Solid line of USI denotes the US stock market index (S&P 500). Dotted line of JSI denotes the Japanese stock market index (NIKKEI 225). Numerical values on the left side are USI, and numerical values on the right side are JSI.
Figure 3.
Won/Dollar Exchange Rate and Won/Yen Exchange Rate

Note: Solid line of KUER denotes the W/D. Dotted line of KJER denotes the W/Y. Numerical values on the left side are KUER, and numerical values on the right side are KJER.
Table 1.
Ljung-Box Q-statistics of returns and changes

Note: The numbers in parentheses denote p-value.
Figure 4.
Time Plots of Returns (Changes) and Squared Series

Note: Left column displays the time plots of returns and changes. Right column displays the squared series from original returns and changes.
Table 2.
Descriptive statistics for the financial series

Note: Changes and returns of the level variables.
Table 3.
Estimates of trivariate GARCH model for Case I and Case II

Note: (Case I) i=1: W/D change, i=2: Korean CDS spread change, i=3: Korean stock return. (Case II) i=1: W/Y change, i=2: Korean CDS spread change, i=3: Korean stock return. The values in parentheses are standard errors. *** indicates significance at the 1% level, ** indicates significance at the 5% level, and * indicates significance at the 10% level.
Figure 5.
Return and Volatility Spillover Effects for Case I and Case II

Note: Solid line denotes significant spillover effect and dotted line denotes insignificant spillover effect.
Figure 6.
Impulse Response Functions for Case I

Note: Solid lines depict impulse responses of each one standard deviation increasing shock, and broken lines depict the upper and lower one standard error bands.
Figure 7.
Impulse Response Functions for Case II

Note: Solid lines depict impulse responses of each one standard deviation increasing shock, and broken lines depict the upper and lower one standard error bands.
Table 4.
Estimates of trivariate GARCH model for Case III and Case IV

Note: (Case III) i=1: US stock return, i=2: Korean CDS spread change, i=3: Korean stock return. (Case IV) i=1: Japanese stock return, i=2: Korean CDS spread change, i=3: Korean stock return. The values in parentheses are standard errors. *** indicates significance at the 1% level, ** indicates significance at the 5% level, and * indicates significance at the 10% level.
Figure 8.
Return and Volatility Spillover Effects for Case III and Case IV

Note: Solid line denotes significant spillover effect and dotted line denotes insignificant spillover effect.
Figure 9
Impulse Response Functions for Case III

Note: Solid lines depict impulse responses of each one standard deviation increasing shock, and broken lines depict the upper and lower one standard error bands.
Figure 10
Impulse Response Functions for Case IV

Note: Solid lines depict impulse responses of each one standard deviation increasing shock, and broken lines depict the upper and lower one standard error bands.
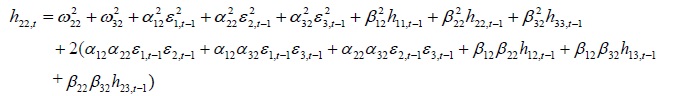
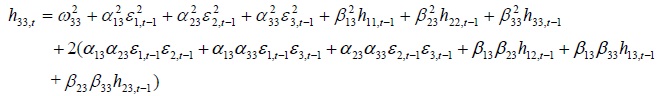
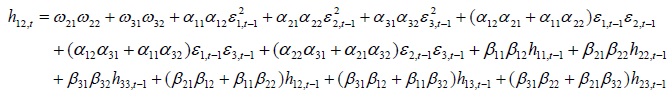
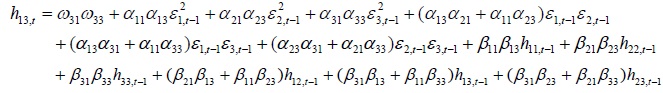
Appendix A. The conditional variance and covariance equations

Appendix B. Coefficients of Trivariate GARCH Model
Appendix C. Estimates for the Pre-Global Financial Crisis Period
The estimated coefficients and standard errors of the conditional mean equations and conditional variance equations for Case I and Case II, which include foreign exchange markets as a third financial market, are reported in Table C.1. Estimated coefficients of equations (2) and (4), which are based on computing the coefficients of ARCH term and GARCH term in Table C.1, are reported in Table C.3. The data period is from the first week of January 2002 to the second week of September 2008.
First, seeing the result of the conditional mean equation in Case I, the return spillover effect from the lagged change of the W/D to the current own-market-change is significant. The coefficient is 0.147 (
Second, seeing the result of the conditional variance equation in Case I, the persistence of volatility (see the significance of
Third, seeing the result of the conditional mean equation in Case II, return spillover effects from the lagged change of the W/Y to the current Korean CDS spread change and the current Korean stock return are 0.124 (
Fourth, seeing the result of the conditional variance equation in Case II, the persistence of volatility (see the significance of
The estimated coefficients and standard errors of the conditional mean equations and conditional variance equations for Case III and Case IV, which include advanced economy stock markets as the third financial market, are reported in Table C.2. Estimated coefficients of equations (2) and (4), which are based on computing the coefficients of the ARCH term and GARCH term in Table C.2, are reported in Table C.4. The data period is from the first week of January 2002 to the second week of September 2008.
First, the result of the conditional mean equation in Case III indicates that return spillover effects from the lagged U.S. stock return to the current Korean CDS spread change is significant. The coefficient is -0.923 (
Second, the result of the conditional variance equation in Case III indicates that the persistence of volatility (see the significance of
Third, the result of the conditional mean equation in Case IV indicates that the lagged return of Korean stock has a conditional return spillover effect on the current own-market return at the 10% significance level with a coefficient value of -0.127 (
Fourth, the result of the conditional variance equation in Case IV indicates that the persistence of volatility (see the significance of
For better understanding, simple figures for the results of return and volatility spillover effects for Case I and Case II are presented in Figure C.1 and for Case III and Case IV are presented in Figure C.2.
Upon comparison of the results in Figure C.1 with those of Figure 5, two remarkable differences appear. One is the significant return spillover effect from the W/D market on the two Korean financial markets, and another is the significant volatility spillover effect from the two foreign exchange markets on the Korean CDS market. This implies that amplified economic and financial market uncertainty in the world during the global financial crisis was transmitted to the Korean economy through the foreign exchange market.
Comparison of the results in Figure C.2 with those of Figure 8 reveals a difference; that is, a significant return spillover effect from the U.S. stock market on the Korean stock market. This finding is in line with the finding of Angkinand et al. (2010), who indicate that the degree of interdependence and spillover effects between the U.S. stock market and advanced economy stock markets are greatest after the collapse of Lehman Brothers in September 2008.
Appendix Tables & Figures
Table B.1
Coefficients of Multivariate GARCH Model for Case I and Case II

Note: (Case I)
Table B.2
Coefficients of Multivariate GARCH Model for Case III and Case IV

Note: (Case III)
Table C.1
Estimates of Trivariate GARCH Model for Case I and Case II

Note: (Case I)
Table C.2
Estimates of Trivariate GARCH Model for Case III and Case IV

Note: (Case III)
Figure C.1
Return and Volatility Spillover Effects for Case I and Case II

Note: Solid line denotes significant spillover effect, and dotted line denotes insignificant spillover effect.
Figure C.2
Return and Volatility Spillover Effects for Case III and Case IV

Note: Solid line denotes significant spillover effect, and dotted line denotes insignificant spillover effect.
Table C.3
Coefficients of Multivariate GARCH Model for Case I and Case II

Note: (Case I)
Table C.4
Coefficients of Multivariate GARCH Model for Case III and Case IV

Note: (Case III)
References
-
Aggarwal, R. 1981. “Exchange Rates and Stock Prices: a Study of the US Capital Markets under Floating Exchange Rates,”
Akron Business and Economic Review , vol. 12, no. 3, pp. 7-12. -
Angkinand, A. P., Barth, J. R. and H. W. Kim. 2010. “Spillover Effects from the US Financial Crisis: Some Time-Series Evidence from National Stock Return,” In Gup, B. E. (ed.)
The Financial and Economic Crises: An International Perspective . Northampton, MA: Edward Elgar Publishing. - Bala, L. and G. Premaratne. 2003. “Stock Market Volatility: Examining North America, Europe and Asia,” Economics Working Paper. Singapore: Department of Economics, National University of Singapore.
-
Baum, C. F. and C. Wan. 2010. “Macroeconomic Uncertainty and Credit Default Swap Spreads,”
Applied Financial Economics , vol. 20, no. 15, pp. 1163-1171.
-
Bauwens, L., Laurent, S. and J. V. K. Rombouts. 2006. “Multivariate GARCH Models: a Survey,”
Journal of Applied Econometrics , vol. 21, no. 1, pp. 79-109.
-
Beer, F. and F. Hebein. 2008. “An Assessment of the Stock Market and Exchange Rate Dynamics in Industrialized and Emerging Markets,”
International Business & Economics Research Journal , vol. 7, no. 8, pp. 59-70. -
Beirne, J., Caporale, G. M., Schulze-Ghattas, M. and N. Spagnolo. 2010. “Global and Regional Spillovers in Emerging Stock Markets: a Multivariate GARCH-in-Mean Analysis,”
Emerging Markets Review , vol. 11, no. 3, pp. 250-260.
-
Bollerslev, T., Engle, R. F. and J. M. Wooldridge. 1988. “A Capital Asset Pricing Model with Time-Varying Covariances,”
Journal of Political Economy , vol. 96, no. 1, pp. 116-131.
-
Choi, J. J., Hiraki, T. and N. Takezawa. 1998. “Is Foreign Exchange Risk Priced in the Japanese Stock Market?,”
Journal of Financial and Quantitative Analysis , vol. 33, no. 3, pp. 361-382.
-
Chou, R. Y., Lin, J. and C. Wu. 1999. “Modeling the Taiwan Stock Market and International Linkages,”
Pacific Economic Review , vol. 4, no. 3, pp. 305-320.
-
Chung, J. S. 2002. “Financial Market Intergration East Asian Countries,”
Sogang Eonomic Papers , vol. 31, no. 1, pp. 73-99. (in Korean) - Dark, J., Raghavan, M. and A. Kamepalli. 2005. “Return & Volatility Spillovers between the Foreign Exchange Market and the Australian All Ordinaries Index,” Working Paper. Melbourne: Department of Econometrics and Business Statistics, Monash University.
-
Dornbusch, R. and S. Fischer. 1980. “Exchange Rates and the Current Account,”
American Economic Review , vol. 70, no. 5, pp. 960-971. -
Dumas, B. and B. Solnik. 1995. “The World Price of Foreign Exchange Risk,”
Journal of Finance , vol. 50, no. 2, pp. 445-479.
-
Engle, R. F. and K. F. Kroner. 1995. “Multivariate Simultaneous Generalized ARCH,”
Econometric theory , vol. 11, no. 1, pp. 122-150.
- Francis, B. B., Iftekhar, H. and M. H. Delroy. 2002. “Return Volatility Linkages in International Equity and Currency Markets,” Bank of Finland Discussion Paper, no. 9.
-
Frankel, J. A. 1983. “Monetary and Portfolio Balance Models of Exchange Rate Determination,” In Bhandari, J. S. and B. H. Putnam. (eds.)
Economic Interdependence and Flexible Exchange Rates . Cambridge, MA: MIT Press. -
Gavin, M. 1989. “The Stock Market and Exchange Rate Dynamics,”
Journal of International Money and Finance , vol. 8, no. 2, pp. 181-200.
-
Harris, R. D. F. and A. Pisedtasalasai. 2006. “Return and Volatility Spillovers between Large and Small Stocks in the UK,”
Journal of Business Finance and Accounting , vol. 33, no. 9-10, pp. 1556-1571.
-
Hassan, S. A. and F. Malik. 2007. “Multivariate GARCH Modeling of Sector Volatility Transmission,”
Quarterly Review of Economics and Finance , vol. 47, no. 3, pp. 470-480.
-
Higgs, H. and A. C. Worthington. 2004. “Transmission of Returns and Volatility in Art Markets: a Multivariate GARCH Analysis,”
Applied Economics Letters , vol. 11, no. 4, pp. 217-222.
-
Huang, B. N. and C. W. Yang. 2000. “The Impact of Financial Liberalization on Stock Price Volatility in Emerging Markets,”
Journal of Comparative Economics , vol. 28, no. 2, pp. 321-339.
-
Kanas, A. 2000. “Volatility Spillovers between Stock Returns and Exchange Rate Changes: International Evidence,”
Journal of Business Finance & Accounting , vol. 27, no. 3-4, pp. 447-467.
-
Karolyi, G. A. 1995. “A Multivariate GARCH Model of International Transmissions of Stock returns and Volatility: The Case of the United States and Canada?”
Journal of Business and Economic Statistics , vol. 13, no. 1, pp. 11-25. - Karunanayake, I., Valadkhani, A. and M. O’Brien. 2009. “Modelling Australian Stock Market Volatility: A Multivariate GARCH Approach,” University of Wollongong, Economics Working Paper, no. 09-11.
-
Kearney, C. and A. J. Patton. 2000. “Multivariate GARCH Modeling of Exchange Rate Volatility Transmission in The European Monetary System,”
Financial Review , vol. 35, no. 1, pp. 29-48.
-
Kim, J. S. 2001. “The Causes of Won/Dollar Exchange Rate Volatility: a Transmission Model among Major Financial Markets,”
The Bank of Korea, Economic Analysis , vol. 7, no. 1, pp. 92-120. (in Korean) -
Kim, K. S. 2007. “A Study on Spillover Effects Across Volatility of Stock Returns, Interest rate and Exchange rate,”
Korea International Accounting Review , vol. 19, pp. 83-107. (in Korean) - Kim, Y. B. 2009. “Effect from Stigma Effect and Capital Mobility to CDS Premium Underlying Government Bond,” Monetary and Economic Research Working Paper, no. 388. Seoul: The Bank of Korea. (in Korean)
-
Longstaff, F. A., Pan, J., Pederson, L. H. and K. J. Singleton. 2011. “How Sovereign is Sovereign Credit Risk?”
American Economic Journal: Macroeconomic , vol. 3, no. 2, pp. 75-103.
-
Meng, L., Gwilym, O. and J. Varas. 2009. “Volatility Transmission Among the CDS, Equity and Bond Markets,”
Journal of Fixed Income , vol. 18, no. 3, pp. 33-46.
- Nam, J. W. and S. J. Byun. 2006. “Study on the Investment of National Pension Services in Credit Derivatives,” Institute for National Pension Research Working Paper, no. 08, Seoul: Institute for National Pension Research. (in Korean)
-
Norden, L. and M. Weber. 2009. “The Co-movement of Credit Default Swap, Bond and Stock Markets: An Empirical Analysis,”
European Financial Management , vol. 15, no. 3, pp. 529-562.
-
Pan, M. S., Fok, R. C. and Y. A. Liu. 2007. “Dynamic Linkages between Exchange Rates and Stock Prices: Evidence from East Asian Markets,”
International Review of Economics and Finance , vol. 16, no. 4, pp. 503-520.
-
Phylaktis, K. and F. Ravazzolo. 2005. “Stock Prices and Exchange Rate Dynamics,”
Journal of International Money and Finance , vol. 24, no. 7, pp. 1031-1053.
-
Rahman, M. L. and J. Uddin. 2009. “Dynamic Relationship between Stock Prices and Exchange Rates: Evidence from Three South Asian countries,”
International Business Research , vol. 2, no. 2, pp. 167-174. -
Remolona, E., Scatigna, M. and E. Wu. 2008. “The Dynamic Pricing of Sovereign Risk in Emerging Markets: Fundamentals and Risk Aversion,”
Journal of Fixed Income , vol. 17, no. 4, pp. 57-71.
-
Roll, R. 1992. “Industrial Structure and the Comparative Behavior of International Stock Market Indices,”
Journal of Finance , vol. 47, no. 1, pp. 3-41.
-
Ross, S. 1976. “The Arbitrage Pricing Theory of Capital Asset Pricing,”
Journal of Economic Theory , vol. 13, no. 3, pp. 341-360.
-
Scheicher, M. 2001. “The Comovements of Stock Markets in Hungary, Poland and the Czech republic,”
International Journal of Finance and Economics , vol. 6, pp. 27-39.
-
Schwert, G. W. 1989. “Tests for Unit Roots: A Monte Carlo Investigation,”
Journal of Business& Economic Statistics , vol. 7, no. 2, pp. 147-159. -
So, R. W. 2001. “Price and Volatility Spillovers between Interest Rate and Exchange Value of the US Dollar,”
Global Finance Journal , vol. 12, no. 1, pp. 95-107.
- Sun, T. and X. Zhang. 2009. “Spillovers of the US Subprime Financial Turmoil to Mainland China and Hong Kong SAR: Evidence from Stock Market,” IMF Working Paper, no. 09/166.
-
Worthington, A. and H. Higgs. 2004. “Transmission of Equity Returns and Volatility in Asian Developed and Emerging Markets: A Multivariate GARCH Analysis,”
International Journal of Finance and Economics , vol. 9, no. 1, pp. 71-80.
-
Wu, R. 2005. “International Transmission Effect of Volatility between the Financial Markets during the Asian Financial Crisis,”
Transition Studies Review , vol. 12, no. 1, pp. 19-35.