

- EAER>
- Journal Archive>
- Contents>
- articleView
Contents
Citation
Article View
East Asian Economic Review Vol. 21, No. 1, 2017. pp. 81-100.
DOI https://dx.doi.org/10.11644/KIEP.EAER.2017.21.1.324
Number of citation : 7View
756
Download
442
Dollarization in North Korea: Evidence from a Survey of North Korean Refugees
|
|
Economic Statistics Department, The Bank of Korea |
|---|---|
|
|
Economic Research Institute, The Bank of Korea |

Abstract
This study measures the degree of dollarization in North Korea using results from a survey of 231 North Korean refugees. Specifically, we compare foreign currency use of households as both store-of-value substitutes (i.e., asset substitution) and transaction substitutes (i.e., currency substitution) before and after the confiscatory currency reform of 2009. The degree of dollarization has advanced since the currency reform in terms of both asset and currency substitutions. Survey results also indicate that the Chinese yuan is frequently used in the Sino-North Korean border area, whereas the US dollar is predominantly used in non-border areas. Furthermore, foreign currency increasingly serves as a medium of exchange not only for large transactions but also for smaller transactions, such as food purchases.
JEL classification: P2, P3, E26, E42
Keywords
North Korea, Dollarization, Confiscatory Currency Reform, Asset Substitution, Currency Substitution
I. INTRODUCTION
Dollarization in North Korea began after the sudden collapse of the Soviet Bloc in the early 1990s (Yang, 2010; Park, 2011; Lee at al., 2012). North Korea faced a serious shortage of hard currency at that time because of the end of “socialist friendly” trade. The former Soviet Union and China started to demand payments for goods in hard currency at global prices. Firms and farms, previously having been operated with financial support from the government, were allowed to engage in foreign trade to obtain foreign currencies which were necessary not only to secure resources for operations, but also to provide the targeted amounts of “loyalty funds” to the nation’s leader or party. The US dollar (USD) and the Chinese yuan (CNY) from commercial activities in the formal sector flowed into the informal sector/black markets, causing breaches in the system of centralized state control over foreign currencies (Kim, 2008). The chronically high levels of inflation after the July 1 Reform Measures (the July 1st Economic Management Improvement Measures) in 2002 can also be considered an important factor of dollarization. The market price of rice in North Korea showed an average annual rate of inflation of 62.4% between 2003 and 2008 since the authoritarian regime increased official prices 25 folds on average to resolve the price gap with the market in 2002 (Lee et al., 2012; Cho et al., 2002). However, the confiscatory currency reform of 2009 was a decisive incident that brought in changes in the nature of dollarization.3 The loss of confidence in the NKW and the consequent hyperinflation in the aftermath of the reform led to a massive flight from the domestic money to more stable foreign currencies, such as the CNY and the USD (Lee et al., 2012).
Most studies on this novel economic phenomenon rely on qualitative analyses based on the in-depth interviews of a few North Korean refugees who were mainly engaged in foreign trade (Lee et al., 2010, 2012; Lim, 2015). By contrast, this article extends the existing literature on dollarization in North Korea by employing a quantitative method to assess its degree. We use the 2015 survey data on North Korean refugees. The sample is those who came to South Korea after escaping from the North between 2007 and 2015. The timeline allows us to compare the household usage of foreign currencies before and after the currency reform. Following the dollarization literature (Rojas-Suárez, 1992; Calvo and Vegh, 1992; Baliño et al., 1999; Feige, 2003; Levy Yeyati, 2006), we measure the extent of the de facto dollarization in North Korea in two dimensions. One is the extent to which households hold foreign currencies as assets (i.e., asset substitution index), and the other is the extent to which they use foreign currencies for their daily transactions (i.e., currency substitution index).
The rest of this study is organized as follows. The next section provides the outline of the survey and discusses the degree of dollarization in North Korea. The third section discusses the sources of dollarization. The final section summarizes the core findings of this study and examines policy implications for the North Korean economy.
1)By contrast, official dollarization is defined as a nation’s
2)Foreign currency usually, but not necessarily, pertains to the US dollar. In this paper, the term “dollarization” serves as shorthand for the uses of both the US dollar and the Chinese yuan.
3)During the reform period, the communist regime restricted the amount of the former currency that each household could exchange for the new one (to 100,000 old North Korean won or NKW per household), allowed an extremely short period for conversion (one week), and applied the punitive conversion rates for cash holdings (100:1), comparing conversion rates for savings (10:1) with those for wages (1:1). These measures in effect contributed to confiscating all old currency that was not converted by its holders
II. MEASURING DOLLARIZATION IN NORTH KOREA
1. Survey and Descriptive Statistics
The survey was conducted between April and October in 2015, of a total of 231 individuals who had defected from North Korea after 2007, aged 18 years or above at the time of defection. The summary statistics are reported in Table 1. Each respondent answered the questionnaire based on the situation of the year prior to his/her defection, in case he/she had been presumably involved in economic activities on a regular basis (66.7% of respondents come under the post-reform period). Over 70% of the respondents stated that their origins were the Sino-North Korean border regions, in contrast to the composition found in the DPRK’s 2008 Census showing a higher proportion (69% of the total population aged 20 or older) living in non-border areas. The distribution of origins of the survey is similar to that of all refugees residing in South Korea. As of March 2016, 29,137 North Korean refugees are living in South Korea, and 75% of them came from either North Hamgyong or Ryanggang, two provinces bordering China (Ministry of Unification, 2016). Presumably, it is relatively easier for residents in these regions to escape from the North due to the vicinity of China even though the regions are economically poorer than Pyongyang and other provinces. However, if dollarization is more prevalent in border regions than in non-border regions, the total extent of dollarization may be overestimated. To avoid such overestimation, we conduct separate analyses for the “Sino-NK border regions” and “non-border regions.”
Among the respondents, 22.9% are male and 77.1% female;4 with 84.8% in their 40s or younger, implying their active involvement in economic activities. We conclude that the unbalanced sex ratio does not affect our findings because the survey mainly concerns household income and expenditure, and females generally tend to have higher credibility with regard to household matters than their male counterparts in North Korea’s patriarchal society.5
2. Asset Substitution of North Korean Households
Asset substitution is generally measured with the Asset Substitution Index (ASI), as expressed in Equation (1) (Baliño et al., 1999; Feige, 2003; Alvarez-Plata and Garcia-Herreo, 2008). ASI cannot be applied to North Korea, however, because North Koreans are reluctant to use the bank for saving; the country has no commercial banks and people distrust the state bank. Thus, we use an alternate measure which shows the ratio of household’s foreign currency assets to its total cash assets as described in Equation (2).


We employ two methods to calculate North Korea’s annual ASI. In the first method, we averages the individual ASIs of all households for each year, as in Equation (3). In the second, the total foreign currency assets of all households are divided by their total cash assets each year, as in Equation (4). In the latter, the assets in the NKW are calculated as the sum of cash, seed money for business and private loans in the NKW; the assets in the yuan are the sum of cash, seed money and private savings in the CNY in Chinese banks; and the dollar assets are the sum of cash, seed money and private loans in the USD. The “household cash assets” are calculated by converting the sum of the assets held in foreign currencies into the NKW according to the North Korea’s market exchange rates then.

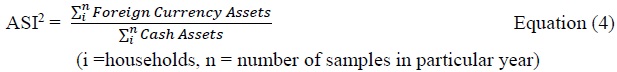
One of the drawbacks of using AS11 in Equation (3) is that inter-household asset differences may not be taken into account because AS11 gives the same weight for all households. On the contrary, ASI2 in Equation (4) reports a greater number than AS11 when the portion of total foreign assets to total cash assets is high. That is because dollar-rich households may overly influence the entire index even though their number is only meager.
Although we use both measures to report annual ASI trends, we only use ASI1 to analyze distributional and regional differences because the disadvantage of ASI2 may lead to significant errors.
Table 2 presents the annual ASI trends of North Korean households. A considerable progression in asset substitution is observed before the currency reform, which intensifies after the reform. The two indices show that North Korea’s ASIs increase from 0.39 and 0.63 in 2009 to 0.67 and 0.99 in 2010, and then to 0.93 and 0.97 in 2012 respectively. ASI2 has been constantly higher than 0.95 since 2010, right after the currency reform. Therefore, this outcome indicates that wealthier households have been more likely to hold foreign asset than average households since the reform.
Figure 1 illustrates the relative frequency distributions of ASI before and after the reform. The percentage of households holding more than 90% of their cash assets in foreign currencies is approximately 51.2% before the reform, but that figure increases to 70.7% afterward. At the same time, the percentage of households holding less than 10% of their cash assets in foreign currencies falls to 14.7% from 32.6%. Ultimately, most households holding cash assets have kept their assets in foreign currencies since the reform.
At the regional level, the preferred foreign currency in the Sino-NK border regions is the CNY even before the currency reform, whereas the USD is preferred in other regions. This regional difference has become even more distinct since the reform (Table 3). The share of currency held in the CNY has spiked from 48.0% to 78.3% in the border regions, while the share in the USD has risen from 32.0% to 50.4% in non-border areas.
From a cross-country perspective, we compare the asset substitution trend in North Korea with those in three transitional countries in Southeast Asia. Table 4 indicates that the North Korean trend is similar to those of the highly dollarized states with the high shares (over 50%) of foreign currency deposits in total savings such as Cambodia and Laos in the early 2000s, especially after the 2009 reform. Although the different approach is taken for measurement, the discrepancy between ASI (NK) and the standard ASI is insignificant given North Korea’s low rate of savings driven by distrust against banks.
3. Currency Substitution of North Korean Households
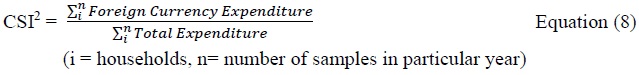
Currency substitution can be measured with Currency Substitution Index (CSI) of Feige (2003), as expressed in Equation (5). A method for estimating foreign currencies in circulation has not been agreed on. Some studies have used econometric models (de Zamacroczy and Sa, 2003; Beaugrand 2003), while others have conducted household surveys (Zoryan, 2005). The CSI (NK) is calculated on the basis of survey data. We use the ratio of household’s monthly average foreign currency expenditure to its monthly average total expenditure as a proxy for the degree of currency substitution, which is given in Equation (6).


Just as with the ASI (NK), two methods are used to calculate the annual CSI (NK). The first method is averaging the individual CSIs of all households for each particular year, as expressed in Equation (7). The second method is dividing the total foreign currency expenditures of all households combined in a particular year by their total expenditures in that year, as given in Equation (8). Foreign currency expenditures are converted at market exchange rates. As the case of ASIs, only CSI1 is used for distributional and regional comparisons.

The trend of the annual CSIs of North Korean households reveals an increased currency substitution since the currency reform in 2010 (Table 5). The two measures of CSI increase from 0.25 and 0.14 in 2009 to 0.43 and 0.47 in 2010, and then to 0.62 and 0.79 in 2012 respectively. The currency substitution is intensified in 2012 for both CSI1 and CSI2, implying an expansion in the currency substitution since 2010. Similar to the asset substitution, the higher CSI2 (relative to CSI1) implies that the expenditure in foreign currencies increases along with a rise in the total expenditure of a household.
Figure 2 illustrates the relative frequency distributions of the CSI before and since the currency reform. The percentage of households paying for 90% or more of their expenses in foreign currencies is 19.2% before the reform but reaches 40.0% since the reform. On the contrary, the percentage using foreign currencies for less than 10% of their expenses declines from 69.2% to 37.3%.
Irrespective of region, the NKW is used in more than 70% of cases before the reform. Since the reform, the proportion of the foreign currency use increases dramatically particularly in the border areas. The use of the CNY in the border regions significantly rises from 22.1% to 57.4%, whereas the use of the NKW in other regions, despite remaining predominant, decreases from 71.8% to 61.3%:
Table 7 reports the patterns of currency use in terms of the goods purchased (crops and electronics) and the types of transactions (housing purchases and loans).6 Before the reform, crops are traded in the NKW in more than 90% of cases. Since the reform, the use of the CNY grows to approximately 40% in trading of both rice and flour. With regard to trade in electronic goods, which are relatively expensive, the use of foreign currencies is relatively high (30%-40%) already prior to the reform. Since the reform, the number increases to over 60% (CNY only). The use of the CNY rises to approximately 60% in housing purchases or loans.
4)Around 70% of the North Korean refugees who arrive in South Korea are female. The movement of men is more difficult than that of women in North Korea because of the stricter monitoring imposed on men
5)
6)
III. SOURCES OF DOLLARIZATION
1. Confiscatory Currency Reform
The confiscatory currency reform having implemented in December 2009 undoubtedly triggered a sudden surge in North Korean dollarization. In 2010, the monthly rate of the NKW depreciation against the USD exceeded 80%, and the rate of increase in the price of rice surpassed 50%7 (see Figure 3).
North Koreans naturally switched their ever-depreciating won to more stable foreign currencies, such as the CNY and the USD to protect their wealth and purchasing power (Hanke, 2013). As seen in Table 2 and Table 5, the proportion of asset substitution is already high before the currency reform, whereas the proportion of currency substitution increases to 40%~60% from around 20% since the reform. This shows that North Korea has followed the precedents of dollarized countries. Dollarization process generally begins with asset substitution and evolves into the currency substitution as going through a severe inflation period. Particularly dollarization phenomenon is pronounced when hyper-inflation is caused by inefficient currency reforms. In the case of Vietnam, hyperinflation approximately reached an annual rate of 400% for three consecutive years from 1986 to 1988 after its confiscatory currency reform in September 1985 (Mas, 1995). The Vietnamese Dong simultaneously showed an annual depreciation of 792%8 against the dollar. This rapid and large devaluation and the consequent high inflation led to the spontaneous (or
2. Foreign Currency Policies
Institutional factors involving foreign currencies also play an important role in dollarization. In most countries belonged to the former Soviet Union, dollarization was encouraged during the transition period, due to loosening restrictions on foreign currency holdings and a sharp depreciation in exchange rates (Havrylshyn and Beddies, 2003). If the North Korean regime had harshly restricted and penalized the use of foreign currencies, the rampant dollarization could have been prevented. After the reform, several crackdowns were conducted on exchanging foreign currencies in the market, but they were short-lived because of strong backlash from citizens as well as officials. The North Korean authorities actually encouraged people to use foreign currencies to retrieve them. In the mobile phone market (with two million subscribers), the North Korean regime ran a firm called Koryolink, a joint venture between the Egyptian telecommunications firm Orascom and Korea Post and Telecommunications Corporation, which monopolized the sale of mobile phones and top-up cards and accepted only USD (Kim, 2014). Another prominent example to accumulate foreign currencies was “Narea Card,” a cash card run by the Foreign Trade Bank in North Korea. The card could be charged with foreign currencies and used for foreign currency purchases at hotels, banks, airports and major department stores in Pyongyang (Korea Development Bank, 2015). Moreover, most of the state-run taxi companies, supermarkets and entertainment facilities usually accept hard currency. Therefore, the policies encouraging foreign currency use may contribute to the increasing and continuing trend of dollarization since the reform.
3. Increasing Inflows of Foreign Currency
The phenomenon where foreign currencies are more widely used than the local currency may be incomprehensible in a country suffering from continuing trade deficits. North Korea fails to record a trade surplus every year, and its annual average trade deficit since 2000 stands at around USD 1.1 billion.9
Some studies however argue that the overall North Korean balance of payments tends to be in the black when accounts related to hard-currency-earning activities, such as services (e.g., transportation, tourism) and income transfer (e.g., international aid, remittances), and financial accounts (e.g., foreign direct investment) are combined (Haggard and Noland, 2007; Noland, 2013; Zang, 2009, 2012). One of the striking features of these estimations is that North Korea has recorded significant foreign exchange surpluses since South Korea’s imposition of economic sanctions (i.e., the May 24 Measures). In the aftermath of the sinking of the
In addition, worker remittances are crucial to an increase in the degree of dollarization in North Korea. North Korean workers are dispatched to China, Russia, and African and Middle Eastern countries, where they are employed as contract workers in construction, logging, art and monument production, and service sector industries such as restaurants and health services. According to the South Korean intelligence agency, 50,000 North Korean laborers were working abroad in 2014, which was twice the figure in 2010. One source estimates that the socialist regime’s foreign exchange income from this scheme would be between the USD 1.2 billion and 2.3 billion per year (the International Network for the Human Rights of North Korean Overseas Labor). In the 1990s, worker remittances and private transfers in Vietnam and Cambodia were also important sources of
The growing portion of North Korea’s hard currency revenues from the Sino-NK trade and overseas workers tends to flow into markets or households, which may have significant economic consequences for North Korean economy in the long run. Because particularly in transition countries, a rise in foreign currency transactions encourages the informal economy and weakens governments’ control for the planned economy, leading to large fiscal deficits. Moreover, dollarization has become persistent even after the inflation and the exchange rate have been stabilized (Oomes, 2003; Feige, 2003; Alvarez-Plata and Garcia-Herreo, 2008).
7)The author has calculated these figures from the dataset of DailyNK, a Seoul-based news agency, which includes monthly market price data on exchange rates and rice prices in three North Korean cities: Pyongyang, Sinuiju, and Hyesan.
8)The author has calculated these figures from the dataset of the
9)The author has calculated these figures from the statistics of KOTRA.
IV. CONCLUSION
This article uses the survey data of North Korean refugees who escaped the North between 2007 and 2015 and moved to South Korea, in a bid to identify the recent development of dollarization in North Korea. Specifically, we analyze the effects of the confiscatory currency reform in 2009 on households’ foreign currency substitutions for wealth allocation and ordinary transactions. The three core findings of the survey are generally consistent with the results of previous studies based on the accounts of North Korean defectors. First, the degree of asset substitution was already high before the currency reform, and it has increased further since the reform. Irrespective of regions, the NKW was predominantly used across the country before the reform. Since the reform, its dominance has decreased, particularly in the border areas, and the NKW has been replaced by foreign currencies. Second, regional differences are observed in the preferred foreign currencies. For example, the CNY is frequently used in the border areas, whereas residents in non-border areas prefer the USD to the CNY as both a store of value and a medium of exchange. Third, foreign cash which was previously used mainly for large-scale transactions (e.g., real estate, private borrowing and durable goods), has been also used for small-scale transactions in non-durable goods (e.g., rice and flour) since the reform. Some indices indicate that wealthier households are more likely to use foreign currencies than average households for their asset holdings and expenditures.
The results confirm that the sudden surge in the dollarization in North Korea has primarily stemmed from the currency reform in 2009. This continuing economic trend has been facilitated by the policies allowing and encouraging foreign currency use as well as increased inflows of hard money from exports of minerals and labors, particularly since the South Korean sanctions imposed in 2010.
The high degree of dollarization may present crucial policy implications for the North Korean economy. On the negative side, the main cost of the rapid development of dollarization is a decrease in the government’s seigniorage revenue. All else remaining equal, an increase in the foreign currency use results in the minimal demand for the domestic currency. Dollarization greatly limits the ability of the North Korean regime for inflationary financing, creating money to deal with fiscal deficits. By contrast, strict fiscal policies induced by dollarization may contribute to the stabilization of prices and exchange rates. Both the inflation rates in the market prices of rice and the depreciation of the NKW have also significantly decreased since the fourth quarter of 2012 and have remained at a single-digit level since 2014 (see figure 3). Coinciding with the inflation pattern, the two indices of dollarization in North Korea compiled for this study mostly peaked in 2012 and stabilized afterward. Inflation has decreased in most dollarized countries after the degree of dollarization reached certain thresholds because these countries have normally adopted relevant monetary policies or exchange rate regimes to restrict the money supply, such as monetary targeting or fixed exchange rate regimes (see Appendix 1). Given the lack of data on the domestic and foreign money circulating in the economy, the relationship between the recent price stabilization pattern and the dollarization in North Korea is yet to be understood clearly. Future research is encouraged to observe the evolution of these two economic variables.
Tables & Figures
Table 1.
Descriptive Statistics

Notes: 1) Calculated by subtracting one year from the year of defection
2) North Hamgyong, Ryanggang, Chagang, and North Pyongan Provinces are defined as the border regions.
Table 2.
Asset Substitution Trends of North Korean Households

Source: Survey results are based on 118 respondents who stated that they owned cash assets.
Figure 1.
Relative ASI Frequency Distributions Before and Since Reform

Source: Survey results are based on 118 respondents who stated that they owned cash assets.
Table 3.
Assets Held in Different Currencies by Period and Region (%)

Source: Survey results are based on 118 respondents who stated that they owned cash assets.
Table 4.
ASIs of Three Southeast Asian Transitional Countries (%)

Notes: Calculated as the ratios of foreign currency deposits to total savings
Source:
Table 5.
CSI Trends of North Korean Households

Source: Survey results are based on 161 respondents.
Figure 2.
Relative Frequency Distributions of CSI Before and Since Reform

Table 6.
Currencies Used for Expenses by Period and Region (%)

Source: Survey results are based on 161 respondents.
Table 7.
Currencies Used in Transactions Before and Since Reform (%)

Source: Based on 231 respondents’ answers in each category
Figure 3.
Trends of Market Exchange Rate and Rice Price since Currency Reform

Source: DailyNK
Appendix 1.
Degrees of Dollarization1) and Inflation

Note: 1) Calculated as ratios of foreign currency deposits to total savings
Source:
References
- Alvarez-Plata, P. and P. García-Herrero. 2008. To Dollarize or De-dollarize: Consequences for Monetary Policy. DIW Berlin Discussion Papers, no. 842.
- Baliño, T. J. T., Bennett, A. and E. Borensztein. 1999. Monetary Policy in Dollarized Economies. IMF Occasional Paper, no. 171.
- Beaugrand, P. 2003. Overshooting and Dollarization in the Democratic Republic of the Congo. IMF Working Paper, no. 03/105.
- Calvo, G. and C. A. Végh Gramont. 1992. Currency Substitution in Developing Countries: An Introduction. IMF Working Paper, no. 92/40.
- Central Bureau of Statistics (CBS). 2009. DPRK 2008 Population Census National Report.
-
Cho, D. H., Park, J., Jung, Y. H., Shin, J. H., Kim, H. J. and E. Y. Kim. 2002.
A Study on the Economic Development of North Korea . Seoul: Korea Development Institute. -
DailyNK. 2016. North Korea Market Trends. <
http://www.dailynk.com/english/market.php > (accessed May 20, 2016) - de Zamaróczy, M. and S. Sa. 2003. Economic Policy in a Highly Dollarized Economy: The Case of Cambodia. IMF Occasional Paper, no. 219.
-
Feige, E. L. 2003. “Dynamics of Currency Substitution, Asset Substitution and De facto Dollarisation and Euroisation in Transition Countries,”
Comparative Economic Studies , vol. 45, no. 3, pp. 358-383.
- Haggard, S. and M. Noland. 2007. North Korea’s External Economic Relations. PIIE Working Paper, no. 07-7.
-
Hanke, S. H. 2013. North Korea: From Hyperinflation to Dollarization?. Cato Institute. <
https://www.cato.org/publications/commentary/north-korea-hyperinflation-dollarization > (accessed May 20, 2016) -
Havrylyshyn, O. and C. H. Beddies. 2003. “Dollarisation in the Former Soviet Union: From Hysteria to Hysteresis,”
Comparative Economic Studies . vol. 45, no. 3, pp. 329-357.
- International Monetary Fund (IMF). 2016. World Economic Outlook Database.
-
International Network for the Human Rights of North Korean Overseas Labor (INHL). 2012. The Condition of the North Korean Overseas Labor. <
http://en.nksc.co.kr/wp-content /uploads/2014/08/INHL.pdf > (accessed May 20, 2016) -
Jung, H. J. and T. S. Rich. 2016. “Why Invest in North Korea? Chinese Foreign Direct Investment in North Korea and its Implications,”
Pacific Review , vol. 29, no. 3. pp. 307-330.
-
Kang, J. W. 2008. “The Patriarchal State and Women’s Status in Socialist North Korea,”
Graduate Journal of Asia-Pacific Studies , vol. 6, no. 2, pp. 55-70. -
Kim, B. Y. and S. H. Jung. 2015.
China’s Trade and Investment with North Korea: Firm Survey in Dandong . Seoul: Seoul National University Press. (in Korean) -
Kim, K. J. 2008. “Change in Foreign Currency Control System in North Korea and Its Increasing Dependence on Hard Currency,”
EXIM North Korea Economic Review , Spring issue, vol. 5, no. 1, pp. 19-41. (in Korean) -
Kim, Y. H. 2014. Cell Phones in North Korea: Has North Korea Entered the Telecommunication Revolution?. US-Korea Institute at SAIS. <
http://uskoreainstitute.org/wp-content/uploads/2014/08/Kim-Yonho-Cell-Phones-in-North-Korea-English.pdf > (accessed May 20, 2016) -
Korea Development Bank (KDB). 2015.
North Korea Development . Seoul: Korea Development Bank. (in Korean) -
Korea International Trade Association (KITA). 2007. Evaluation of 2006 Inter-Korean Trade and Prospects of 2007. <
http://www.kita.net/interkoreatrade/data/data_view.jsp > (accessed May 20, 2016) (in Korean) -
Korea Trade-Investment Promotion Agency (KOTRA). 2011.
North Korea’s External Trade . Seoul: Korea Trade-Investment Promotion Agency. (in Korean) -
Korea Trade-Investment Promotion Agency (KOTRA). 2012.
North Korea’s External Trade . Seoul: Korea Trade-Investment Promotion Agency. (in Korean) -
Korea Trade-Investment Promotion Agency (KOTRA). 2013.
North Korea’s External Trade . Seoul: Korea Trade-Investment Promotion Agency. (in Korean) -
Korea Trade-Investment Promotion Agency (KOTRA). 2014.
North Korea’s External Trade . Seoul: Korea Trade-Investment Promotion Agency. (in Korean) -
Lee, J. K. 2015. “What Determines the DPRK’s Anthracite Exports to China?: Implications for the DPRK’s Economy,”
KDI Journal of Economy Policy , vol. 37, no. 2, pp. 40-63.
-
Lee, S. K., Kim, S. J. and M. S. Yang. 2012.
Dollarization in North Korea . Seoul: Korea Institute for Industrial Economics & Trade. (in Korean) -
Lee, S. K., Kim, S. J., Kim, K. H. and Yang, M. S. 2010.
North Korean Industries and Firms in the 2000s: Recovery and Operation Mechanism . Seoul: Korea Institute for Industrial Economics & Trade. (in Korean) -
Levy Yeyati, E. 2006. “Financial Dollarization: Evaluating the Consequences,”
Economic Policy , vol. 21, no. 45, pp. 61-118. -
Lim, E. C. 2015. “The Formation and Development of Private Financing in North Korea: Patterns, Implications, and Tasks,”
Journal of Unification Studies , vol. 27, no. 1, pp. 205-242. (in Korean) -
Mas, I. 1995. “Things Government Do to Money: A Recent History of Currency Reform Schemes and Scams,”
Kyklos , vol. 48, no. 4, pp. 483-512.
-
Ministry of Unification. 2016. Statistics on North Korean Refugees. <
http://www.unikorea. go.kr/download.do?filename=45143_201605100948534760.xls > (accessed May 20, 2016) (in Korean) -
Noland, M. 2013. Hugely Important: North Korea Running a Current Account Surplus? North Korea: Witness to Transformation, Peterson Institute for International Economics. <
https://piie.com/blogs/north-korea-witness-transformation/hugely-important-north-korea-running-current-account > (accessed May 20, 2016) - Oomes, N. 2003. Network Externalities and Dollarization Hysteresis: The Case of Russia. IMF Working Paper, no. 03/96.
-
Park, H. -J. 2011. “Commercial Engagements of the Party-State Agencies and the Expansion of Market in the 1990s in North Korea,”
Unification Policy Studies , vol. 20, no. 1 pp. 213-237. (in Korean) - Rojas-Suárez, L. 1992. Currency Substitution and Inflation in Peru. IMF Working Paper, no. 92/33.
- Savastano, M. A. 1996. Dollarization in Latin America: Recent Evidence and Some Policy Issues. IMF Working Paper, no. 96/4.
- Shinichi, W. 2007. De Facto Dollarization and its Effect on Financial Development and Economic Growth of Cambodia, Lao PDR and Viet Nam. Paper Presented at Conference on: Policy Options and Challenges for Developing Asia-Perspectives from the IMF and Asia.
-
Yang, M. S. 2010.
The Marketization in North Korean Economy . Seoul: Hanul. (in Korean) -
Yu, S. -E., Kim, B.-Y., Jeon, W.-T. and S. H. Jung. 2012. “Determinants of Labor Market Participation and Wages of North Korean Female Refugees in South Korea,”
Asian Economic Policy Review , vol. 7, no. 1, pp. 113-129.
-
Zang, H. S. 2009. “Balance of Foreign Exchange of North Korea for 2000 through 2008,”
Comparative Economic Review , vol. 16, no. 2, pp. 1-48. (in Korean) -
Zang, H. S. 2013. “Estimation of and Analysis on the Balance of Foreign Exchanges of North Korea for 1991-2012,”
Unification Policy Studies , vol. 22, no. 2, pp. 165-190. (in Korean) -
Zoryan, H. 2005. “The Measurement of Co-Circulation of Currencies and Dollarization in the Republic and Armenia,”
European Journal of Comparative Economics , vol. 2, no. 1, pp. 41-65.