

- EAER>
- Journal Archive>
- Contents>
- articleView
Contents
Citation
| No | Title |
|---|---|
| 1 | / 2014 / / vol.38, pp.97 / |
| 2 | (Co-movement of Key Economic Indicators Among South Asian Countries) / 2015 / SSRN Electronic Journal |
| 3 | (Comovement of Key Economic Indicators Among South Asian Countries) / 2015 / SSRN Electronic Journal |
| 4 | Business Cycles Synchronization: Literature Review / 2024 / Journal of Economic Analysis / vol.3, no.4, pp.37 / |
| 5 | Prediction Errors of Macroeconomic Indicators and Economic Shocks for ASEAN Member States, 1990-2021 / 2023 / The International Economy / vol.26, no.0, pp.91 / |
Article View
East Asian Economic Review Vol. 17, No. 2, 2013. pp. 103-128.
DOI https://dx.doi.org/10.11644/KIEP.JEAI.2013.17.2.261
Number of citation : 5View
1332
Download
102
Regional Business Cycles in East Asia: Synchronization and its Determinants
|
Young-Joon Park |
Department of Economics, Ajou University |
|---|

Abstract
This paper analyzes the dynamics and nature of regional business cycle synchronization for East Asian countries in the period of 2000:Q1-2011:Q4. Estimating a dynamic two-factor model extracts the common factor and the nation-specific factor from both the macroeconomic aggregates and plausible driving forces of regional business cycles. Evidence for regional business cycle synchronization is particularly strong for Korea, Malaysia and the Philippines, while Japan shows weak evidence of regional synchronization. On the other hand, Indonesia, Thailand, Singapore and China are decoupling from regional business cycles. The driver of monetary aggregate is the most significant determinant of regional fluctuations of macroeconomic aggregates, whereas oil price and productivity are on average important driving forces of nation-specific fluctuations of real economic activities.
JEL Classification: E30, F00, F44
Keywords
Business Cycle, Synchronization, Decoupling, East Asia, Factor Model
I. Introduction
Economic integration in East Asia has progressed with the aid of increasing international trade and financial flows. The size of ASEAN+31 economy has been taking an ever-greater share of the world economy, as shown in Table 1. China has emerged as a major economic partner of both East Asian countries and the rest of the world. This tendency of increasing economic integration is likely to lead regional business cycle synchronization in East Asia.
Trade integration in East Asia has actively proceeded over the last two decades through the ASEAN Free Trade Area and the ASEAN Investment Area. These efforts contributed to lowering transaction costs of regional trade. Moreover, strong tendency of regional trade integration is supported by bilateral and plurilateral free trade agreements. For example, ASEAN+3 countries have concluded 131 FTAs and are currently negotiating 53 FTAs, as of 2012.
Regional financial cooperation has been developed in East Asia under the ASEAN+3 initiatives since the Asian currency crisis. It has manifested in various aspects, including gradual financial liberalization, increasing cross-border capital flows, establishing regional financial safety nets, and developing local currency bond markets.2 The issue of regional business cycle synchronization is also relevant to the regional monetary cooperation in East Asia. This is, in particular, important for the optimum currency area because the degree of regional business cycle synchronization is understood as one of the economic convergence criteria. In this regard, recent studies have examined the business cycle comovement between countries in Asia in order to assess the desirability of a regional currency union.
Empirical literature provides a general tendency of regional business cycle synchronization in East Asia. Selover (1999) uses principal component analysis to find evidence for a shared business cycle among ASEAN countries. However, VAR estimations reveal weak evidence of business cycle transmission among ASEAN countries. Selover (2004) examines the economic links between Korea and Japan and finds evidence of moderate synchronization in economic activity. Rana (2007) extends Shin and Wang (2003) to find that intra-industry trade is the major factor explaining business cycle comovement in East Asia.
For emerging and developing economies as in Calderón et al. (2007), the empirical evidence of business cycle synchronization appears to be more negligible with mixed results. Moneta and Ruffer (2009) examine business cycle synchronization in East Asia by estimating a factor model through Kalman filtering. Their finding is that Asian countries, except China and Japan, share a common factor of business cycle that appears to reflect export synchronization. The existing studies generally find a positive relationship between trade linkages and synchronization for the Asian region, in line with the relatively high share of intra-industry trade within the region (e.g. Choe, 2001; Shin and Sohn, 2006; and Rana, 2007). In contrast, Kumakura (2006) finds that similarities in the production structure are much more important explanatory variable for bilateral growth synchronization than bilateral trade links. Imbs (2011) examines bilateral business cycle correlations within emerging East Asia. He finds evident business cycle synchronization after the global financial crisis of 2008:Q3, but it is substantially more pronounced amongst developed countries than in emerging East Asia. Nguyen (2007) investigates the determinants of East Asian business cycle synchronization, covering the period 1970-2000, by using an OLS-based extreme bound analysis, and finds that trade openness, intra-industry trade, and the similarity of monetary policy are major channels of business cycle synchronization. Allegret and Essaadi (2011) analyze the feasibility of a monetary union in East Asia focusing on business cycles synchronization. They find that the increase in bilateral trade in East Asia improves long-run business cycle synchronization.
This paper analyzes the dynamics and nature of regional business cycles synchronization for eight East Asian countries in the period of 2000:Q1-2011:Q4. Going a step further, this study investigates to what extent macroeconomic activity in East Asia is driven by the commonly shared and/or nation-specific components of major determinants across countries. For these purposes, a dynamic factor model extracts the common factor and the nation-specific factor from the macroeconomic aggregates and plausible driving forces of regional business cycles. Unlike most of existing literature on bilateral comovement between individual country pairs, this study employs a dynamic factor model to decompose regional business cycles in a multilateral perspective and the determinants of regional business cycles. Regional business cycle synchronization is evaluated and traced by calculating the dynamic conditional correlations.
This paper extends the literature by dealing with three issues that are important in the literature of business cycle synchronization in East Asia. First, this study applies a dynamic factor model to extract the regional common factor and the nation-specific factor of business cycles for eight East Asian countries. Second, the degree of business cycle synchronization with the regional one is measured by time-varying dynamic conditional correlation for each country. Finally, the determinants of business cycle synchronization are examined by differentiating the monetary and fiscal policy variables as well as the non-policy variables in accounting for regional business cycle comovements.
The remainder of the paper is organized as follows. Section II briefly outlines the empirical model and data. Section III estimates regional business cycles in East Asia and examines the issue of business cycle synchronization or decoupling from the regional business cycle. Section IV examines the properties of the regional business cycle determinants, and figures out the major drivers of regional business cycle synchronization. Section V provides policy implications and concludes.
1)The Association of Southeast Asian Nations (ASEAN), established in 1967, comprises of ten member countries: Thailand, Malaysia, Singapore, Indonesia, the Philippines, Brunei, Myanmar, Laos, Vietnam, and Cambodia. The ‘Plus Three’ countries are the Republic of Korea, Japan, and the People’s Republic of China.
2)East Asia’s initiatives in support of regional financial integration can be classified into three pillars: (1) the Chiang Mai Initiative (CMI) and its multilateralization (CMIM) as a commitment to provide U.S. dollar liquidity support to member countries through currency swaps in response to urgent short-term liquidity shortages and balance of payment difficulties in crisis; (2) the establishment of the ASEAN+3 Macroeconomic Research Office (AMRO) as an independent regional economic surveillance unit; and (3) the Asian Bond Market Initiative (ABMI) and the Asian Bond Funds (ABFs) to develop local bond markets for recycling regional capital.
II. Empirical Methodology and Data
1. Dynamic Factor Model and Estimation
A dynamic factor model extracts the unobserved latent factors by using the spectral density matrix of a set of time series, while a static factor model utilizes the variance-covariance matrix of a set of random variables as in principal component analysis. Suppose
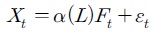
where
This study employs Crucini et al. (2011)’s dynamic factor model to decompose East Asian economies’ macroeconomic variables into three mutually exclusive layers of characteristics, such as a regional common factor, a nation-specific factor, and a variable-specific idiosyncratic component. The regional factor is common across eight countries considered in this study and variables of interest, while the nation-specific factor is common to all variables of a country. And the idiosyncratic component is specific to each variable. In our analysis, there are two types of factors: the regional common factor

where
To estimate the regional and nation-specific factors of business cycles, the vector
In order to characterize the key determinants of regional business cycles, this study considers five driving forces, similar to Crucini et al. (2011). As for the policy-oriented drivers, both real stock of money and government expenditure are used as proxy variables of monetary and fiscal policy. The non-policy driving forces include proxy variables of productivity, oil price, and trade. We estimate similar factor model (1) for each driving force, and the same interpretation of the regional and the nation-specific factors are applied. For example, the common factor of productivity is interpreted as regional productivity variation in East Asia and the nation-specific factor is the deviation of a nation’s productivity from this common level.
The Bayesian estimation of the factor model (1) follows the procedure in Otrok and Whiteman (1998). Our estimation of the dynamic factor model characterizes the joint posterior of the model parameters and latent factors by employing numerical methods to simulate from the posterior. To implement this, the estimation uses a data augmentation algorithm to generate draws from the joint posterior of interest, as in Tanner and Wong (1987) and Otrok and Whiteman (1998). Bayesian estimation of the dynamic factor model is applied to use Markov-Chain Monte Carlo method, which is described in Otrok and Whiteman (1998). The prior on the factor loading coefficients is
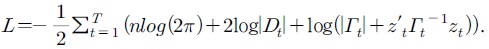
2. Dynamic Conditional Correlations
To measure the degree of regional business cycle synchronization, this study employs the time-varying dynamic conditional correlation between the regional common factor of business cycles and each nation’s real output fluctuations.3 The dynamic conditional correlation is calculated by estimating a DCC-GARCH (dynamic conditional correlation - generalized autoregressive conditional heteroscedasticity) model, proposed by Engle (2002). The DCC-GARCH model is an extension of Bollerslev (1990)’s constant conditional correlation model by making the conditional correlation matrix time-dependent.
Engle (2002) proposes the dynamic conditional correlation estimator by allowing
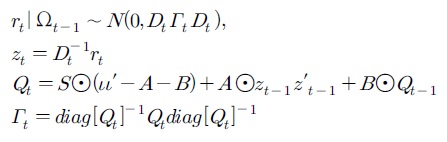
where
3. Variance Decompositions
Crucini et al. (2011)’s variance decomposition is performed to quantify the relative contributions of the regional, nation-specific, and variable-specific factors to variations in macroeconomic aggregate variables of a country. To calculate the share of the relative contributions, each observable’s variance is decomposed into the fraction that is due to each factor. With orthogonal factors, the variance of the observable

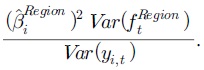
Then, for example, the fraction of volatility due to the East Asia’s regional factor would be
4. The Data
The East Asian countries’ quarterly data covers the period 2000:Q1-2011:Q4. The eight countries in the region include Korea, Japan, China, Malaysia, Indonesia, Thailand, the Philippines, and Singapore. They are selected based on the relative size of the national economy in East Asia and data availability over the sample period.
The macroeconomic aggregate for output is real gross domestic product, real private consumption expenditure is for consumption, and real gross capital formation is for investment. For the policy variables of driving forces, both the monetary and fiscal policy drivers use real stock of M2 and real government expenditure. The non-policy variables are productivity, the relative price of Dubai oil price, and total exports and imports. The productivity series are constructed by calculating a standard Solow residual of Cobb-Douglas production function for each country by using the parameter values of capital share and labor share of 1/3 and 2/3, respectively. The Dubai oil price is converted to domestic currency and then deflated by the CPI. The list of data sources is presented in appendix.
3)
4)To measure the relative contributions, this study follows
III. Regional Business Cycle Synchronization
1. Estimation of Regional Business Cycle
Following Gregory et al. (1997) and Crucini et al. (2011), the dynamic factor model (2) is estimated for the macroeconomic aggregates of eight East Asian countries to characterize the regional common factor and the nation-specific factor:
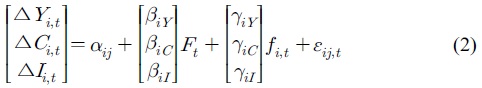
where the data vector consists of the growth rates of real GDP, real private consumption expenditure, and real investment for country
We compare, for example, the estimated East Asia’s regional common factor to Japan’s real output fluctuations because Japan is a developed country in the region. Figure 1 plots the regional business cycle factor against the Japan’s output fluctuations. To a rough approximation, Japan’s business cycle shows inverse movements to the regional business cycles. Moreover, during the global financial crisis in 2008, Japan suffered from a deeper recession than the regional recession in East Asia. Indeed, some ASEAN countries and China have not been severely affected by the wave of the global financial crisis. In this regard, the regional business cycle is more moderate than Japan’s recession in 2008-2009. That is, we can conjecture the low degree of regional business cycle synchronization for Japan. Next subsection provides an explicit measure of business cycle synchronization about this matter.
2. Business Cycle Synchronization in East Asia
Business cycle synchronization in East Asia is examined by calculating time-varying dynamic conditional correlations (DCCs) between the regional business cycle factor and each country’s output fluctuations. The time-varying correlations in Figures 2-4 reveal the degree of each country’s business cycle synchronization with the regional business cycle. As an approximate range of the estimated regional business cycles, both 33 percent and 66 percent quantiles are used throughout this paper.
The results are categorized by three cases, depending on the degree of business cycle synchronization. The first group of business cycle synchronization includes Korea, Malaysia, and the Philippines that show high level of positive dynamic conditional correlations in Figure 2. Korea shows strong time-varying correlations of more than 0.8. Malaysia and the Philippines have the dynamic correlations between 0.6-0.8. While Malaysia’s dynamic conditional correlations have gradually decreasing patterns after 2005, the Philippines’ degree of synchronization has been getting stronger after the global financial crisis.
It is useful to see the relative contribution of the regional, nation-specific, and variable-specific factors to the evolution of national macroeconomic aggregates to account for a country’s business cycle synchronization. Thus, variance decompositions are performed and the results are tabulated in Table 2.
The strongly synchronized countries are confirmed by variance decompositions for macroeconomic aggregates in Table 2. The relative contribution for Korea shows that about 60-80 percent of regional business cycles are explained by the regional factors of output and investment. Malaysia shows that about 30-40 percent of regional business cycles are explained by output and investment, respectively. For the Philippines, the regional factors of output and consumption are dominating nation-specific or idiosyncratic factors.
Since the sample period includes recent global financial crisis, the same analysis is performed by excluding the period of 2008-2011. The qualitative results for the pre-crisis period are similar to those for the whole sample period, except Thailand.5 When the global financial crisis is excluded, Thailand changes from a decoupling country to a synchronizing country. This implies that, unlike the experience of the Asian currency crisis in 1997-98, Thailand has shown relatively different impact from the wave of the global financial crisis, compared to the regional business cycles. Chirathivat and Mallikamas (2010) mention that Thailand is not that close to the epicenter of the crisis, and that the elections at the end of 2008 allowed the new government to be formed in early 2009 and right away to start implementing its first fiscal stimulus packages in the first quarter of 2008. Since then, the government has time to propose the even more ambitious second three-year fiscal stimulus packages, aiming to build a stronger economy while Thailand will make inroads to economic recovery.
The second category of weak regional synchronization includes Japan with the low correlations of less than 0.2, as shown in Figure 3. Finally, the third group, illustrated in Figure 4, includes Indonesia, Thailand, Singapore, and China that show negative correlations with regional business cycles. Barberis et al. (2002) defines comovement as a pattern of positive correlation of the variables of interest. In this regard, comovement can be interpreted as coupling phenomenon and they are used interchangeably in this paper. On the other hand, a pattern of non-positive correlation of variables can be understood to be decoupling behavior. Thus, these four countries are in favor of the decoupling hypothesis from the regional business cycles. In Figure 4, China turned temporarily into positive correlations in 2009, but again remains negative correlations in 2010. As for the relative contributions of Indonesia, Thailand, and Singapore in Table 2, the idiosyncratic variable-specific factor dominates both regional and nation-specific factors. For these three countries, about 70-90 percent of macroeconomic aggregates are explained by the idiosyncratic variable-specific factor.
5)To save space, the results for the pre-crisis period are not reported. These are available upon request.
IV. Properties of Regional Business Cycle Determinants
1. Dynamic Conditional Correlations for Driver Variables
One of the key questions in this study is to figure out the relation between monetary and fiscal expansion/contraction and regional business cycles in East Asia. To answer this question, Figure 5 compares the regional business cycle to the common factor of monetary and fiscal policy variables.
In panel A, we find that the monetary driver plays an important role in accounting for the regional business cycle after the global financial crisis. This is related to a tendency of increasing significance of monetary policy coordination in East Asia, especially after the mid-2000s. In contrast, panel B of a regional fiscal driver shows a slightly different pattern from the monetary driver. At first glance, regional business cycles are more correlated with the regional factor of fiscal policy than that of monetary policy. In particular, fiscal policy is more important for the period of relatively higher economic expansions, because it shows higher correlations for 66 percent quantile in panel B. However, the regional fiscal factor’s correlations decline after 2007. Thus, both monetary and fiscal policy variables seem to be important driving forces of regional business cycles.
Figure 6 provides distinct features of the non-policy driving forces. Regional productivity factor is counter-cyclical with regional business cycles. This is contrast to the result of G-7 countries in Crucini et al. (2011) that productivity is a key pro-cyclical variable to account for G-7 business cycles. This finding can be understood in the following ways. Referring to empirical research on East Asian miracles in economic growth, high growth in total factor productivity is not the main sources of the high output growth in East Asia.6 Another possibility for this finding is that the total factor productivity can depend on other factors such as capacity utilization, rather than using a standard Cobb-Douglas production function.
However, both oil price and trade variables can be good candidates of the important driving forces of regional business cycles. For the analysis of scrutiny on this matter, variance decompositions are performed in next subsection. Moreover, in panel C, the trade component can be emphasized for the relatively lower levels of regional output growth because the correlations for 33 percent quantile are a bit higher than those for 66 percent quantile.
2. Driver Variables’ Contribution to Business Cycles
In the earlier section, we examined the regional, nation-specific, and idiosyncratic components of East Asia’s business cycles and the potential driver variables that are proposed in business cycle literature. This subsection explores how much of a country’s output variation is attributed to the regional and nation-specific sources of variation in each of the driving variables. To this end, the regional common component of business cycles is regressed on the regional common factors of each driver variable:

Taking the variance operator to the both sides of equation (3), we decompose the variance of the estimated regional business cycle into the regional component of each driving variable and an idiosyncratic component.
The results of variance decompositions reveal that productivity, trade, and fiscal variables are the major driving sources of the regional factor of business cycles in East Asia. The results of this exercise are the decomposition of the unconditional variance over the whole sample period. In particular, the productivity, trade, and fiscal variables account for 20.9 percent, 17.25 percent, and 37.78 percent, respectively.
Next we perform the following variance decompositions for the individual macroeconomic aggregates across countries. For example of a country’s output growth, the following equations are used to decompose the output variance by component and shock:


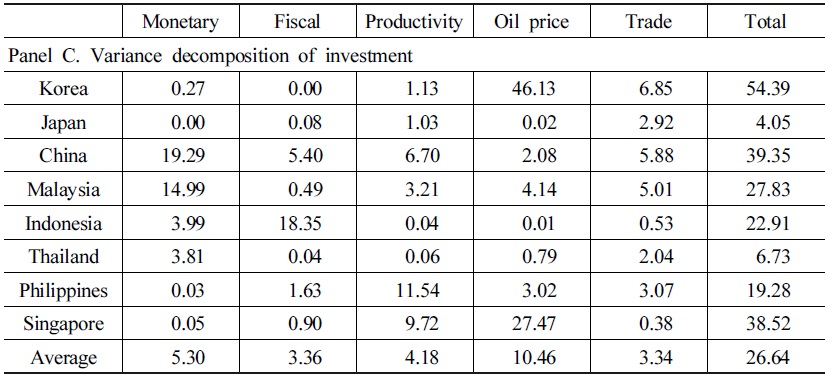
As mentioned in Crucini et al. (2011), the factors on the right-hand side of equations (4) and (5) are orthogonalized with respect to each other. Tables 3 and 4 tabulate the variance decomposition results of equations (4) and (5), respectively.
Tables 3 and 4 imply that the driving forces of monetary, oil price and trade variables account for a substantial portion of the variation in the growth of output, consumption and investment. The East Asian regional factor on average explains a larger share of the variation than the nation-specific factors. Korea, Malaysia, and the Philippines appear to be the most synchronizing with the regional business cycles, accounting for more than 70 percent of the variation. This result is consistent with the high degree of regional business cycle synchronization from Figure 2. As for consumption, the Philippines seem to be the most regionally comoving with the regional common component, while China appears to be the most idiosyncratic with the national component of driving variables, accounting for approximately 77-78 percent. Korea’s investment comoves with the regional common component of driving variables, accounting for more than 80 percent.
We next turn to the individual driving variables accounting for regional component of macroeconomic aggregates in Table 3. According to the fraction of output variance, monetary variable is the most significant driving force and then the oil price and trade variables are in the second and third significant drivers, respectively.7 From Table 4, oil prices and productivity are in consecutive order, accounting for 15.18 percent and 9.96 percent on average. For consumption growth in Table 4, national monetary and productivity components tend to be dominating as major driving forces, accounting for the averages of 13.07 percent and 11.27 percent. Turning to investment growth, oil price plays an important role as a driving force by accounting for the average of 10.46 percent. In the case of fiscal policy variable, the regional and nation-specific factors generally appear to contribute less to macroeconomic aggregates. In addition, oil price and productivity are on average the most important driving forces of nation-specific fluctuations of macroeconomic aggregates.
6)According to
7)For the pre-crisis period of 2000-2007, productivity shows the second-highest explanatory power for the regional components of output and consumption.
V. Conclusion
The purpose of this paper is to examine the dynamics and nature of regional business cycles synchronization for East Asian countries in the period of 2000:Q1-2011:Q4. This study investigates to what extent macroeconomic activity in East Asia is driven by commonly shared and nation-specific components of major determinants across countries. To this end, a two-factor dynamic factor model extracts the latent common factor and the nation-specific factor from the macroeconomic aggregates and driver variables of regional business cycles. The time-varying dynamic conditional correlations are used to trace the degree of business cycle synchronization, and variance decomposition analysis is performed to assess relative importance of the drivers of regional business cycles.
The key findings of this study are summarized as follows. First, evidence for regional business cycle synchronization is particularly strong for Korea, Malaysia and the Philippines, while Japan shows weak evidence of regional synchronization. On the other hand, Indonesia, Thailand, Singapore and China are decoupling from regional business cycles. According to variance decompositions, the relative contribution for Korea shows that about 60-80 percent of regional business cycles are explained by the regional factors of output and investment. Malaysia shows that about 30-40 percent of regional business cycles are explained by output and investment, respectively. For the Philippines, the regional factors of output and consumption are dominating nation-specific or idiosyncratic factors. As for a group of Indonesia, Thailand, and Singapore, the idiosyncratic variable-specific factor dominates both regional and nationspecific factors. For these three countries, about 70-90 percent of macroeconomic aggregates are explained by the idiosyncratic variable-specific factor. Second, monetary variable is the most significant determinant of regional fluctuations of output, consumption, and investment, while both oil price and productivity are on average the most important driving forces of nation-specific fluctuations of macroeconomic aggregates.
The findings provide policy implications on the desirability of regional monetary cooperation in East Asia. The optimal currency area theory suggests that business cycle synchronization is one of the crucial criteria for using a common currency in the region and optimal exchange rate regimes. Since the Asian currency crisis, Japan has proposed the use of Asian Currency Unit as a regional common currency in East Asia. Moreover, regional cooperation on exchange rate policy has been proposed: for example, Bayoumi and Mauro, (2001) and Ogawa and Ito (2002) among others. This paper reveals that some East Asian countries share the regional business cycles but others in the region show decoupling from it. This heterogeneous feature of business cycle synchronization implies that the time is not yet ripe for introducing a regional common currency in East Asia. However, based on the significant role of monetary policy for regional business cycles in this paper, this finding also sheds some lights on initiating a regional monetary cooperation to enhance the efficacy of regional economic integration.
This study focuses on the business cycles synchronization with or decoupling from the regional business cycles. It is also interesting to examine the similar synchronization or decoupling issues with the business cycles of developed countries (e.g. G7 countries). To this end, the analysis can incorporate the developed countries to extract the world factor. Furthermore, in reality the world demand and supply shocks could be major common shocks. Accordingly, we can analyze the synchronized supply and/or demand shocks with regional output fluctuations. It is an interesting topic for future research.
Other limitations are related to constructing the productivity series and macroeconomic data availability for some East Asian countries. Following Crucini et al. (2011), this study constructs the productivity series by calculating a standard Solow residual with a Cobb-Douglas production function. However, measuring total factor productivity may depend on different specifications such as capital utilization etc. in the business cycle literature. Unlike G7 countries in Crucini et al. (2011), productivity’s contribution to regional real economic activities is not that much in East Asian region. In addition, M2 is used as a proxy for monetary policy, but short-term interest rates could be included as part of monetary policy. However, the availability of interest rate data is limited for some East Asian countries considered in this study. These limitations will be improved in future research.
Tables & Figures
Table 1.
Share of regional economy (PPP-GDP)
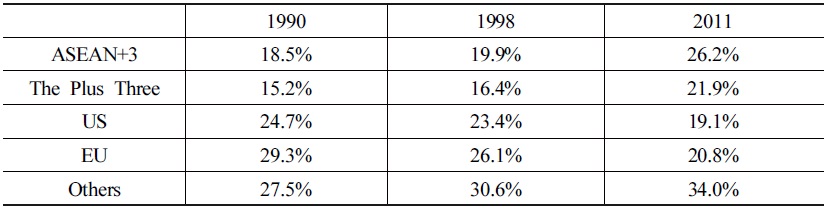
ource: IMF, WEO,
Figure 1.
Japan’s output fluctuations and regional real factor
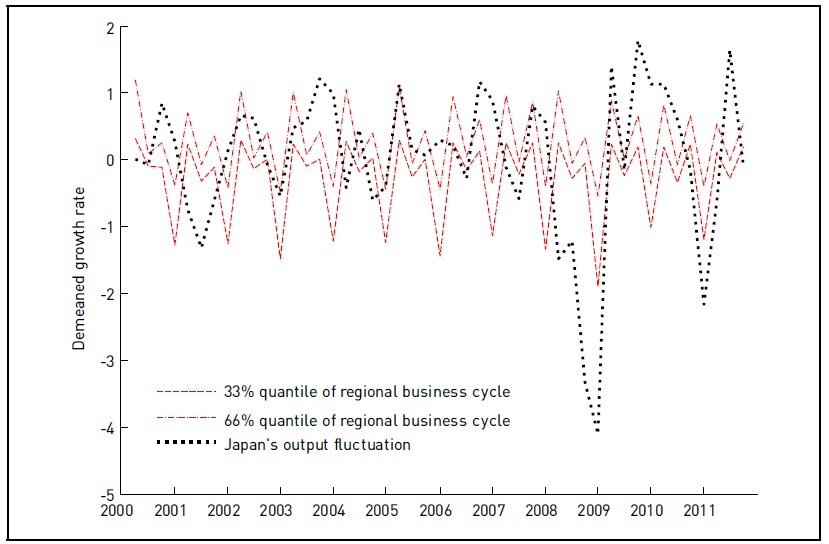
Figure 2.
Strong regional business cycle synchronization
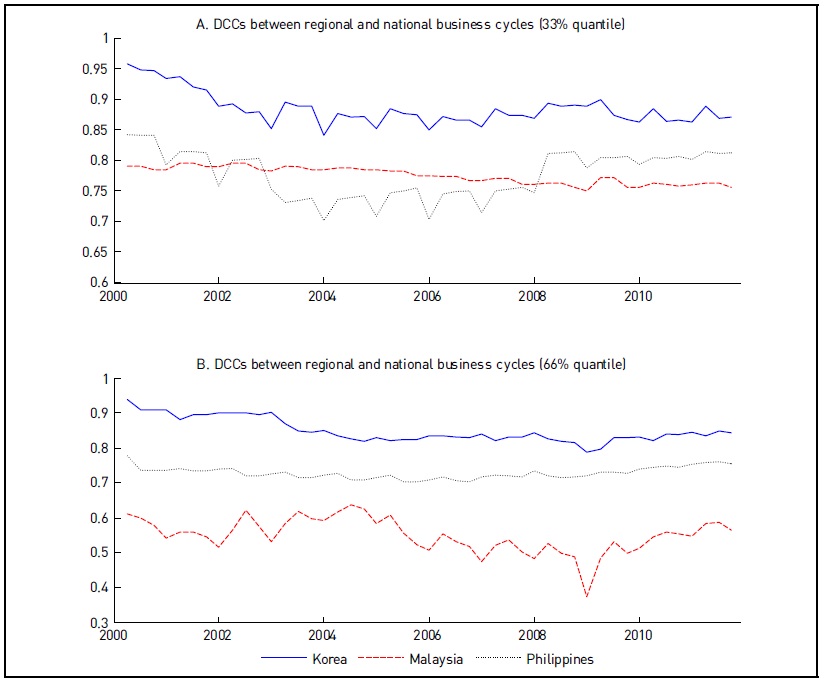
Table 2.
Variance decompositions for macroeconomic aggregates
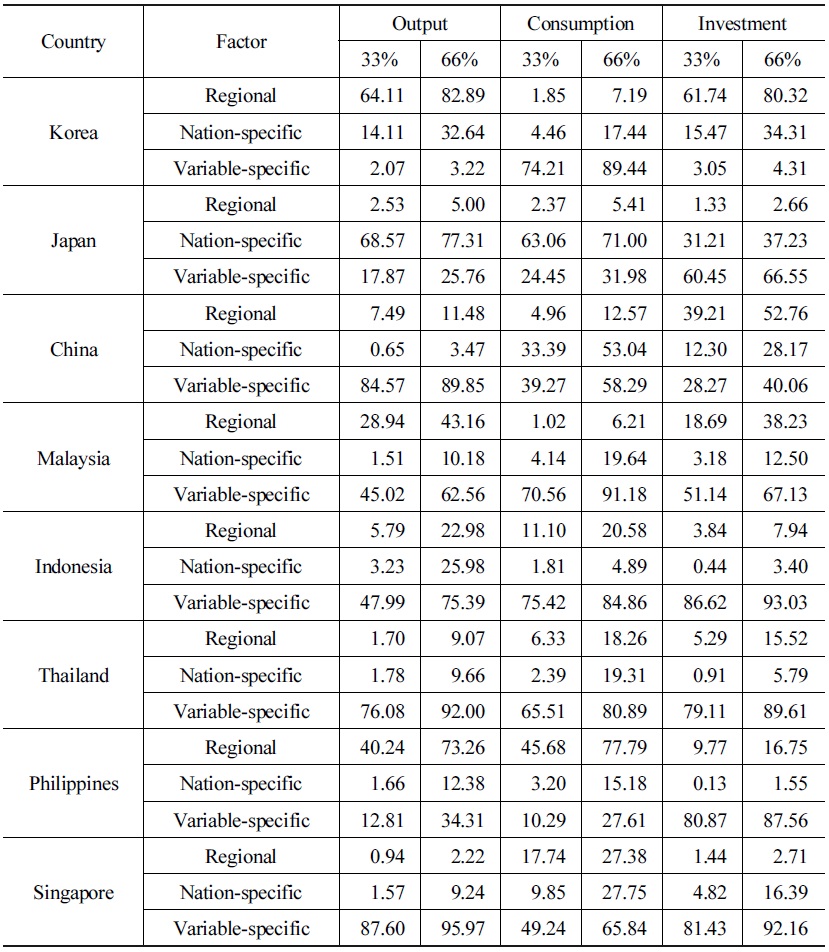
Note: 33% and 66% represent the respective quantiles of posterior shares.
Figure 3.
Weak regional business cycle synchronization
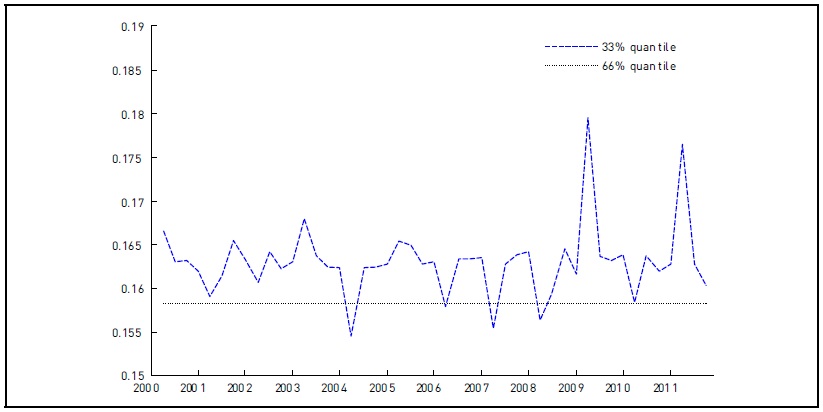
Figure 4.
Decoupling from regional business cycles
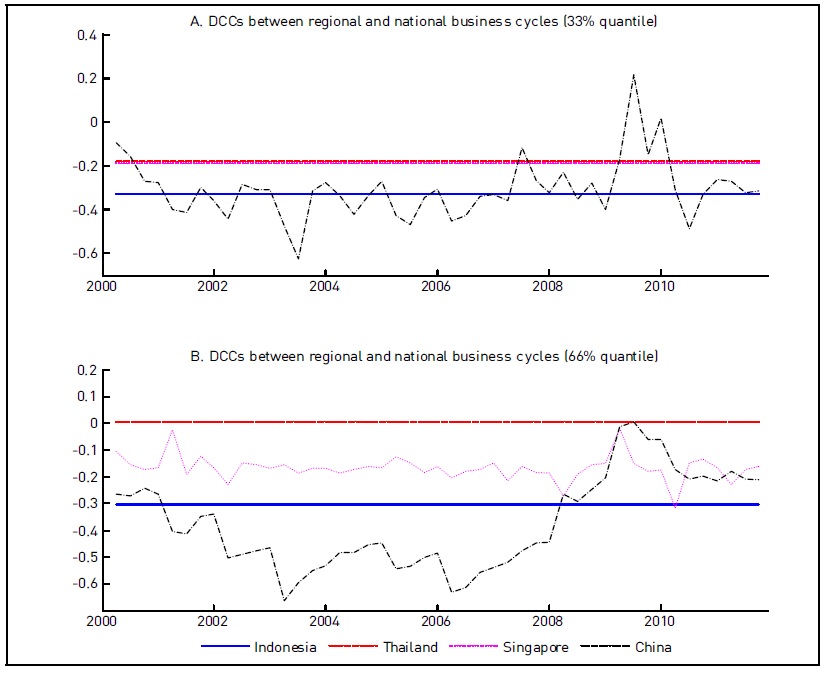
Figure 5.
Regional business cycle and regional factor of policy variables
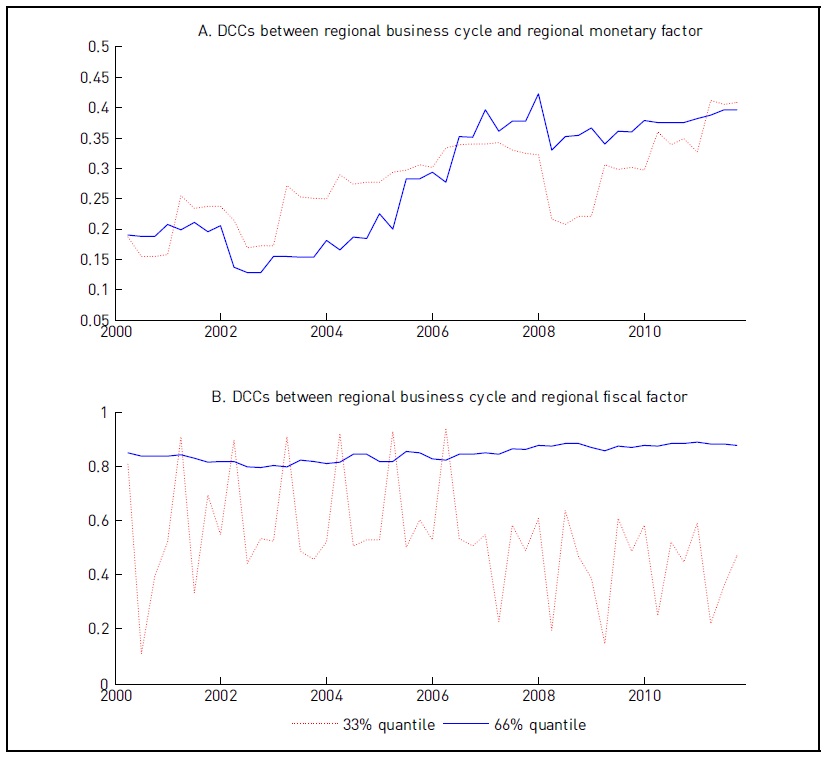
Figure 6.
Regional business cycle and regional factor of non-policy variables
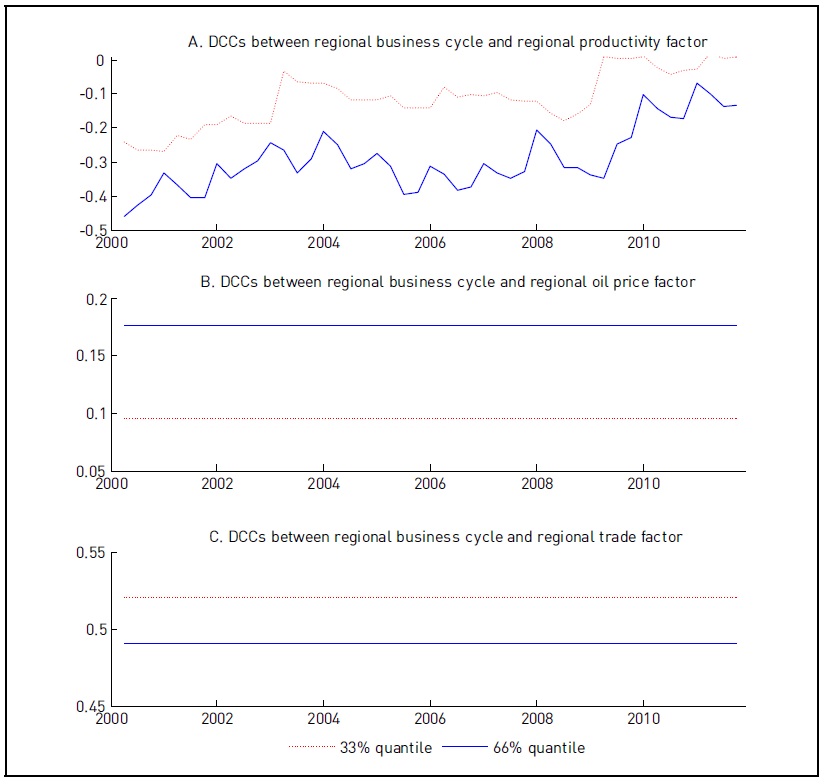
Table 3.
Variance decompositions for the regional components
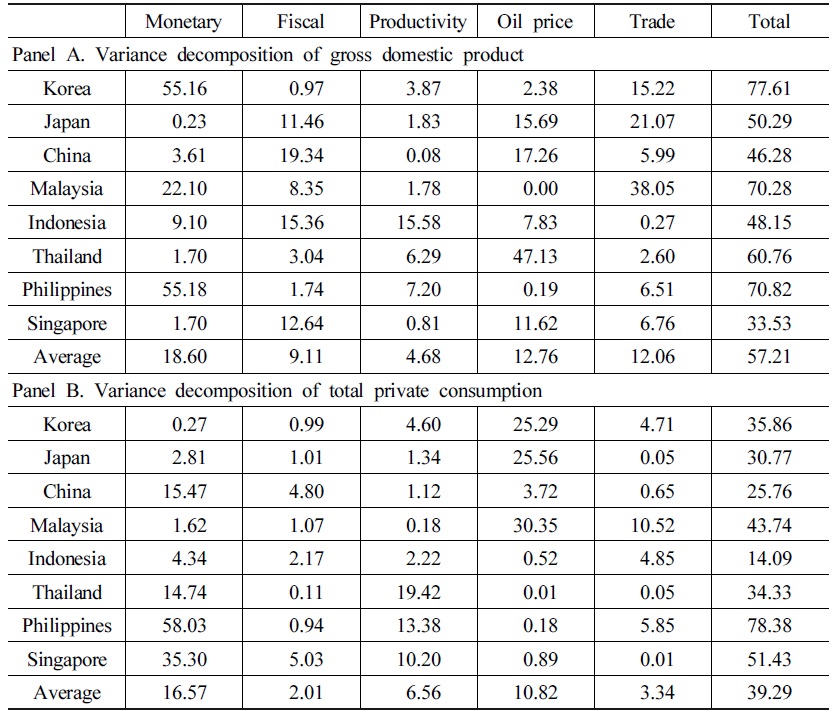
Table 3.
Continued
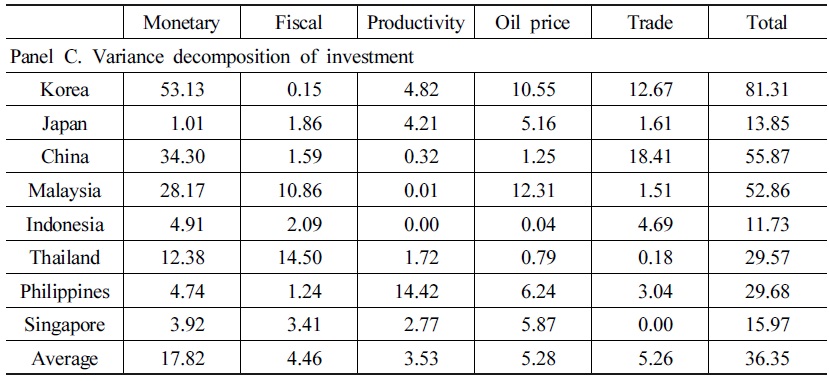
Table 4.
Variance decompositions for the nation-specific components
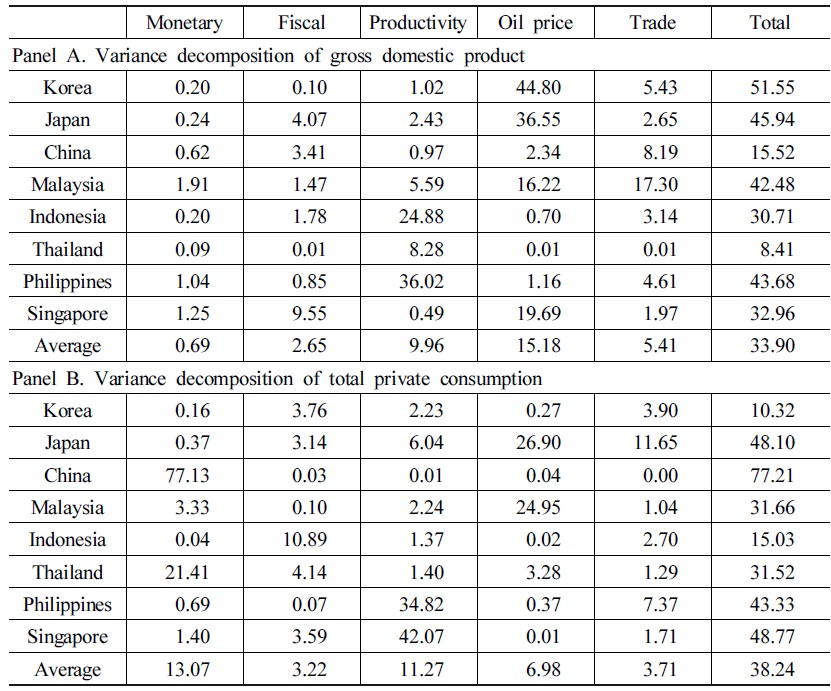
Table 4.
Continued
APPENDIX: Data Sources
◦ Gross domestic product
- Korea: Bank of Korea
- Japan: Cabinet Office
- Thailand: Bank of Thailand
- China: Thomson Reuters
- Malaysia, Indonesia, Singapore: Department of Statistics
- Philippines: National Statistical Coordination Board
◦ Private consumption expenditure
- China: National Bureau of Statistics
- Korea, Japan, Malaysia, Indonesia, Thailand, Philippines, Singapore: IFS, IMF
◦ Gross capital formation
◦ Consumer price index
- Korea, Japan, Malaysia, Indonesia, Thailand, Philippines, Singapore, China: IFS, IMF
◦ M2
◦ Government expenditure
- Korea: Bank of Korea
- Singapore: Department of Statistics
- China: National Bureau of Statistics
- Japan, Malaysia, Indonesia, Thailand, Philippines: IFS, IMF
◦ Dubai oil price
◦ Total exports and imports
◦ Employment
- Thailand: Bank of Thailand
- China: Ministry of Human Resources and Social Security
- Korea, Japan, Malaysia, Indonesia, Philippines, Singapore: IFS, IMF
◦ Exchange rates
References
-
Allegret, J.-P. and E. Essaadi. 2011. “Business Cycles Synchronization in East Asian Economy: Evidences from Time-Varying Coherence Study,”
Economic Modelling , vol. 28, no. 1-2, pp. 351-365.
- Barberis, N., A. Shleifer and J. Wurgler. 2002. “Comovement,” NBER Working Paper No. 8895, National Bureau of Economic Research.
-
Bayoumi, T. A. and P. Mauro. 2001. “The Suitability of ASEAN for a Regional Currency Arrangement,”
World Economy , vol. 24, no. 7, pp. 933-954.
-
Bollerslev, T. 1990. “Modelling the Coherence in Short-Run Nominal Exchange Rates: A Multivariate Generalized ARCH Model,”
Review of Economics and Statistics , vol. 72, no. 3, pp. 498-505.
-
Calderón, C., A. Chong and E. Stein. 2007. “Trade Intensity and Business Cycle Synchronization: Are Developing Countries Any Different?,”
Journal of International Economics , vol. 71, no. 1, pp. 2-21.
- Chirathivat, S. and S. Mallikamas. 2010. “Thailand’s Economic Performance and Response to the Global Crisis,” Presented at the ACAES Conference of Asia after the crisis, March 5-6, Kyoto, Japan.
-
Choe, J.-I. 2001. “An Impact of Economic Integration through Trade: On Business Cycles for 10 East Asian Countries,”
Journal of Asian Economics , vol. 12, no. 4, pp. 569-586.
-
Crucini, M. J., M. A. Kose, and C. Otrok. 2011. “What Are the Driving Forces of International Business Cycles?,”
Review of Economic Dynamics , vol. 14, no. 1, pp. 156-175.
-
Engle, R. 2002. “Dynamic Conditional Correlation: A Simple Class of Multivariate Generalized Autoregressive Conditional Heteroskedasticity Models,”
Journal of Business and Statistics , vol. 20, no. 3, pp. 339-350.
-
Forbes, J. A. and R. Rigobon. 2002. “No Contagion, Only Interdependence: Measuring Stock Market Co-movement,”
Journal of Finance , vol. 57, no. 5, pp. 2223-2261.
-
Gregory, A. W., A. C. Head, and J. Raynauld. 1997. “Measuring World Business Cycles,”
International Economic Review , vol. 38, no. 3, pp. 677-701.
-
Imbs, J. 2011. “What happened to the East Asian Business Cycle?,”
The Dynamics of Asian Financial Integration: Facts and Analytics , pp. 284-310, London: Routledge. - Jang, H. B. 2012. “Financial Cooperation, Integration in East Asia,” Presented at the Bank of Korea Friday Lecture, Seoul.
-
Kose, M. A., C. Otrok, and C. H. Whiteman. 2003. “International Business Cycles: World, Region, and Country-Specific Factors,”
American Economic Review , vol. 93, no. 4, pp. 1216-1239.
-
Krugman, P. 1994. “The Myth of Asia’s Miracle,”
Foreign Affairs , vol. 73, no. 6, pp. 62-78.
-
Kumakura, M. 2006. “Trade and Business Cycle Co-movements in Asia-Pacific,”
Journal of Asian Economics , vol. 17, no. 4, pp. 622-645.
-
Moneta, F. and R. Rüffer. 2009. “Business Cycle Synchronization in East Asia,”
Journal of Asian Economics , vol. 20, no. 1, pp. 1-12.
- Nguyen, T. 2007. “Determinants of Business Cycle Synchronization in East Asia: An Extreme Bound Analysis,” DEPOCEN Working Paper No. 2007/14.
-
Ogawa, E. and T. Ito. 2002. “On the Desirability of a Regional Basket Currency Arrangement,”
Journal of the Japanese and International Economies , vol. 16, no. 3, pp. 317-334.
-
Otrok, C. and C. H. Whiteman. 1998. “Bayesian Leading Indicators: Measuring and Predicting Economic Conditions in Iowa,”
International Economic Review , vol. 39, no. 4, pp. 997-1014.
- Rana, P. 2007. “Trade Intensity and Business Cycle Synchronization: The Case of East Asia,” ADB Working Paper Series on Regional Economic Integration No. 10, Asian Development Bank.
-
Selover, D. D. 1999. “International Interdependence and Business Cycle Transmission in ASEAN,”
Journal of the Japanese and International Economies , vol. 13, no. 3, pp. 230-253.
-
Selover, D. D. 2004. “International co-movements and business cycle transmission between Korea and Japan,”
Journal of Japanese and International Economics , vol. 18, no. 1, pp. 57-83.
-
Shin, K. and C.-H. Sohn. 2006. “Trade and Financial Integration in East Asia: Effects on Co-movements,”
World Economy , vol. 29, no. 12, pp. 1649-1669.
-
Shin, K. and Y. Wang. 2003. “Trade Integration and Business Cycle Synchronization in East Asia,
Asian Economic Papers , vol. 2, no. 3, pp. 1-20.
-
Tanner, A. M. and H. W. Wong. 1987. “The Calculation of Posterior Distributions by Data Augmentation,”
Journal of the American Statistical Association , vol. 82, no. 398, pp. 528-540.
-
Young, A. 1995. “The Tyranny of Numbers: Confronting the Statistical Realities of the East Asian Growth Experience,”
Quarterly Journal of Economics , vol. 110, no. 3, pp. 641-680.