

- EAER>
- Journal Archive>
- Contents>
- articleView
Contents
Citation
| No | Title |
|---|---|
| 1 | Carbon neutral policy in action: the case of Bhutan / 2018 / Climate Policy pp.1 / |
Article View
East Asian Economic Review Vol. 18, No. 3, 2014. pp. 277-299.
DOI https://dx.doi.org/10.11644/KIEP.JEAI.2014.18.3.283
Number of citation : 1View
1457
Download
118
Two Decades of International Climate Negotiations - Carbon Budget Allocation Approach to Re-shaping Developing Country Strategies
|
Sudhakar Yedla |
Indira Gandhi Institute of Development Research (IGIDR) |
|---|---|
|
Sandhya Garg |
Indira Gandhi Institute of Development Research (IGIDR) |

Abstract
Climate negotiations have been going on for the last two decades and the awareness for impacts of climate change has improved substantially. However, the trends of global CO2 emissions did not reveal any encouraging signs, with developing countries emitting even more CO2 and industrialized nations showing no signs of reducing emissions to below their 1990 levels. In order to meet the ambitious targets set by the Stern report for the next two decades, it is important to find new and path-breaking approaches to climate change. This paper attempts to analyze the use of carbon/development space historically, at present and in the future with a focus on equity. Trends analysis focuses on the last two decades (Post Rio) and the carbon budget based analysis considers a period of 1850-2050. Industrialized countries are found to have significantly overshot their budgeted allocation for the last 160 years. Both the developing and industrialized countries are overshooting the present budget estimates based on world per capita budget for the next forty years and proportional to the population of each country. It is important for the industrialized countries to bring down their emissions to meet their carbon budgets while the developing countries use their development space as a guideline for their development path. Furthermore, this paper presents aggressive and regressive scenarios for the industrialized countries to compensate for the climate debt they have created.
JEL Classification: H41, O13, Q01, Q54
Keywords
Climate Change, Climate Debt, Carbon Budget, Developing Countries, Carbon Overshoot
I. Introduction
By the year 1992 the world has accepted the fact that the global emissions of greenhouse gases are alarming and immediate actions are warranted in order to avoid the catastrophes of climate change. Rio earth summit testimonies this global agreement. This global agreement has resulted in the institutionalization of United Nations Environment Program (UNEP), United Nations Framework Convention of Climate change (UNFCCC), and Inter Governmental Panel on Climate Change (IPCC) and thus the year 1992 is purposefully a decisive year for the mitigation of Greenhouse Gases (GHG). Accordingly 1990 was considered as base line for all the Climate Change Mitigation efforts, which is institutionalized in the first commitment period of the Kyoto Protocol (UN, 1997). Ever since, the climate negotiations are on with as much success as the failures. As the time progressed we have come across more academic evidences in terms of IPCC Assessment reports as well as natural ones such as increasing incidence of natural catastrophic events that re-emphasized the impending danger of climate change and its intensity. Recent report of average CO2 concentration touching 400 ppm on 9th of May 2013 (The Guardian, 2013) makes it almost an evidence of where we are heading. In this context, Nicholas Stern, the author of
Therefore, it is an important time for us to take stock of what is achieved so far with CO2 emissions and what is in stock for us as we plan for the future course of actions on a global scale. As argued from time to time, such global actions have to be based on the principles of equity and differentiated responsibility. Thus, the present paper analyzes how the global action on CO2 mitigation progressed post 1990 till 2009, what is the degree of inequity in the historical and the present use of the “development space” among the industrialized and developing countries and the way forward in planning for the future allocations of such a space on equity grounds.
II. Global Climate Negotiations and the Trend of CO2 Emissions
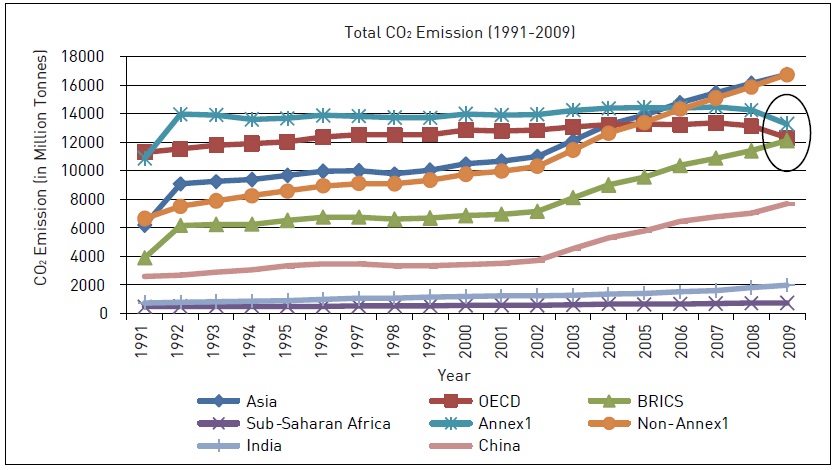
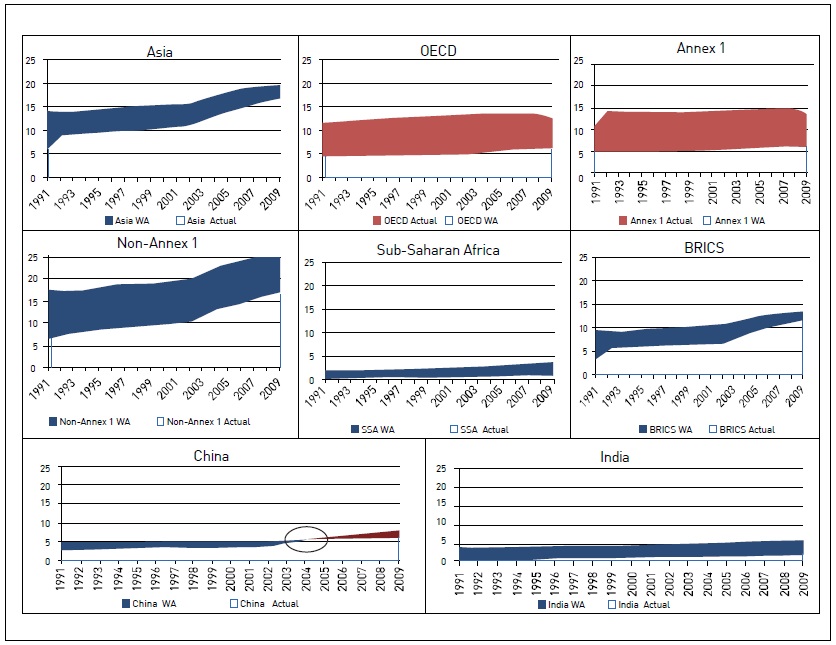
The Kyoto Protocol is the main framework of CO2 emission control on global scale. However, all the pledges from various countries, by and large, remain voluntary and also very marginal when compared to the magnitude of the problem. Thus, CO2 emission by various countries and regions retained their upward sloping trend line. Figure 1 presents the trends of CO2 emissions in the world during the period of 1991-2009, capturing post-Rio trends of CO2 emissions. For the data analysis and structured presentation of CO2 emission patterns in the world, CO2 contributing countries in the world are categorized into different clusters such as Asia, OECD, Annex 1, Non-Annex 1, BRICS, Sub-Saharan Africa. Emissions by each cluster under consideration are calculated by aggregating the annual CO2 emissions of all countries.
All the developing countries and OECD countries, individually and as clusters, showed an upward trend over the entire time period with steeper slopes after 2002. It is a surprising trend as the emissions are actually expected to reduce from the year 2002 with the beginning of the first commitment period of the Kyoto Protocol. It is interesting to note that the total CO2 emissions of BRICS, Annex I and OECD countries as clusters converge towards a common factor over the year 2009 leaving the Sub-Saharan Africa far behind. Though OECD and Annex I countries did increase their CO2 emissions post 1991, their total emissions have shown a declining trend after 2007 but almost at the same level of 1990.
Pattern of CO2 emission for Asia and Non-Annex 1 countries is similar in their trends as well as intensity. China showed a similar trend with 200% increase in total CO2 emissions from the year 2002. Though India has recorded a rise by about 100%, the intensity of emissions remains far low compared to China. Such a rising trend can be attributed to the developmental needs of this region and the rapid economic growth that is being perceived as a means to fight poverty and food insecurity by many countries of this growing region.
As shown in Figure 1, global CO2 emissions have been increasing over the last 19 years (1991-2009) in spite of being treated with top priority on global scale. It is in this context that Stern’s goal of 50% reduction in CO2 from the 1990 level by the next 15 years appears to be a proposition too far from reality. Overall, the global trend of CO2 emissions for the last two decades has been rising and the present approach to climate policy does not provide any positive sign towards achieving the ambitious goal.
Twenty years of global efforts in the forms of international negotiations, technology transfer, clean development mechanism, and various other financial mechanisms could not control the rate of global CO2 emissions to any significance. At this crucial juncture of Post-Kyoto, it is important to introspect and revisit the climate protection pathways.
III. Dynamics of Climate Change
On Climate Change issues the world is divided into Annex 1 and Non-Annex 1 countries, which is otherwise typified by Industrialized Countries (IC) and Developing Countries (DC). The Kyoto framework developed with intent of streamlining the mitigation efforts has actually formalized the divide of the world on the larger canvas of “climate protection”. While industrialized countries were responsible for the past emissions and so the very incidence of climate change (Rogelj et al., 2011; Anderson and Bows, 2008; Najam et al., 2003), developing countries are the future contributors and would further add to the already impending problem of climate change. Though UNFCCC in its fundamental document has clearly stated that the action to control climate change and environment degradation in general has to be based on Common-But-Differentiated Responsibility (CBDR) principle, the world has largely failed to devise a common action plan so far. Though the Kyoto Protocol (KP) has provided a basis for such an action plan, it was limited to voluntary pledges and Post-Kyoto regime is yet to be developed. It suffered further setback by missing emission giant (USA) on board the Kyoto Protocol. While ICs argue that DCs should also take up legally binding emission targets, DCs claim that their developmental objectives have to be respected, hence not willing to commit for legally binding emission targets. While DCs argue that ICs are responsible for the problem of climate change and hence need to do the necessary control, ICs portray the DCs, particularly large economies such as India and China, as future emission giants and expect some degree of commitments for actions. It is, however, to be noted that in order to meet the ambitious goals set by Stern’s report, the future use of atmospheric space and development space needs to be normalized across all countries. This essentially means that while DCs limit the use of their development space, ICs have to cut down on the space they have been using historically to draw to a common line with DCs. Such drastic and stringent measure only can bring the much needed change in global CO2 concentration.
The source of CO2 emissions can be presented in a generic framework as shown below:
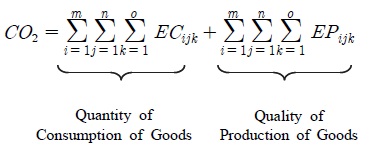
Where
CO2 Total CO2 emissions
ECijk Emission of CO2 related to consumption from the sector i, using technology j and material k
EPijk Emission of CO2 related to production from sector i, using technology j and material k
While the consumption part could be influenced greatly by the per capita consumption as well as the total population, the production part is influenced by the “cleanliness” in technology. Industrialized countries have very high per capita emissions and hence have very strong carbon footprints in the consumption domain. At the present time their CO2 emissions are driven by very high per capita emissions but with very clean production process. Their energy dependence on coal is also less compared to the other parts of the world. As their production is already clean, ICs have to address the consumption part of “emissions basket” in order to reduce their CO2 emissions from the base line. The reason for the stalled growth of CO2 emissions in the ICs is the cleaner production coupled with almost stalled population growth and unchanged per capita consumptions. Therefore, these countries which have stabilized on historical emissions backdrop show no significant increase in CO2 emissions. This also implies that for the past twenty years, their contribution to the efforts to control of CO2 emissions is insignificant.
In contrary to the above, DCs have large population with very poor income levels. But the economies are experiencing rapid growth. With the production process not so clean and relying heavily on coal based power generation, DCs are showing higher rates of growth in CO2 emissions due to the increasing population and also economic growth. With very low per capita emissions, which reflect the “less energy intensive life styles”, DCs’ efforts towards CO2 reduction go to production domain. This precisely explains the reason behind the patterns of CO2 emissions in DCs as shown in Figure 1. Developing countries’ increase in their production and the population adds to it, resulting in increasing CO2 emissions. In case of ICs, the production is clean, consumption which is very high is not falling and as an icing on the cake their population is also not growing, allowing them to maintain “flat” in the pattern curve even without any efforts towards CO2 mitigation. This is argued by many researchers that the ICs ride comfortably on the free development space they have enjoyed historically from the domains of DCs (Baer et al., 2009; Khor, 2010; Schellnhuber et al., 2009). They continue their free ride on the development space that they have “captured” with their consumption patterns which remain uncompromised.
IV. Climate Change and the Equity
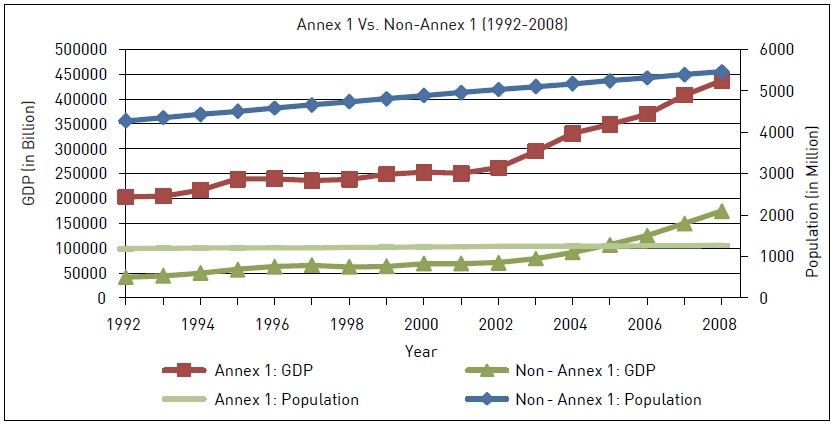
The Gross Domestic Product (GDP) and populations are disproportionately distributed among the countries in the world. As shown in Figure 2, majority of the global population has been in Non-Annex 1 countries and it is rising with time. On the contrary, Annex 1 countries support very small fraction of population, which does not show any sign of growth in the last two decades. Annex 1 countries hold the major share of GDP in the world with DCs sharing as low as 28% of the total global product. The difference is increasing over the last two decades, making it even more skewed.
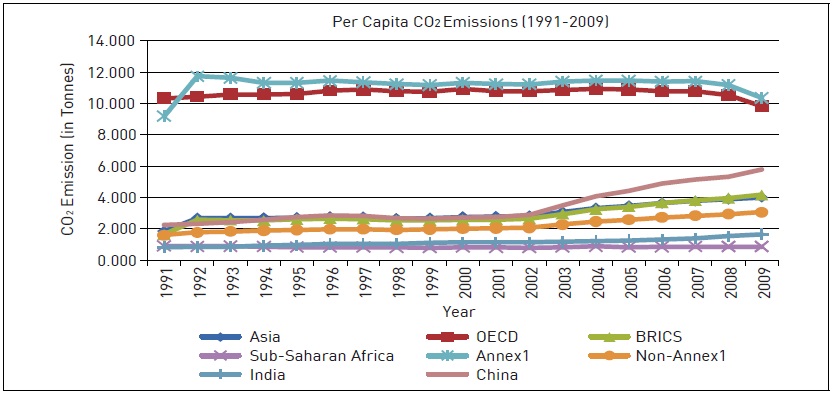
The inequity based on population and GDP distribution vis-a-vis CO2 emission is presented in Figure 3 and 4. Per capita emissions in Asian countries, Non-Annex 1 countries and BRICS countries have followed similar patterns in the last two decades with China showing more aggression. The per capita emissions, which were very low at less than 2 tons in 1991, have remained almost the same for a decade and started showing increasing trends from 2002 onwards. They have doubled during this period. China has shown much higher growth in per capita emissions, which has in fact grown three folds. Indian per capita emissions continue to remain very low at 1 ton and have almost doubled in two decades time. Sub-Saharan African (SSA) countries have shown a negative growth in the middle and regain to the same point as in 1990. It can be inferred from Figure 2 and 3 that the dynamic economic growth could outweigh the population growth to show increasing per capita emissions among the DCs.
Industrialized countries have very high per capita emissions at 11 tons and have shown no growth in the last two decades. They have shown declining per capita emissions since 2007 and in the year 2009 they are at the same level as 1990. This reduction in per capita emissions could be attributed to the improvement in energy mix by promoting more non-conventional energy sources such as bio-diesel. (Or could it be attributed to global meltdown of economies?). Per capita CO2 emissions, based on population, are seriously skewed towards ICs. Large share of poor populations contribute so little CO2 emissions compared to a very small share of rich population in the world, which explains serious inequality.
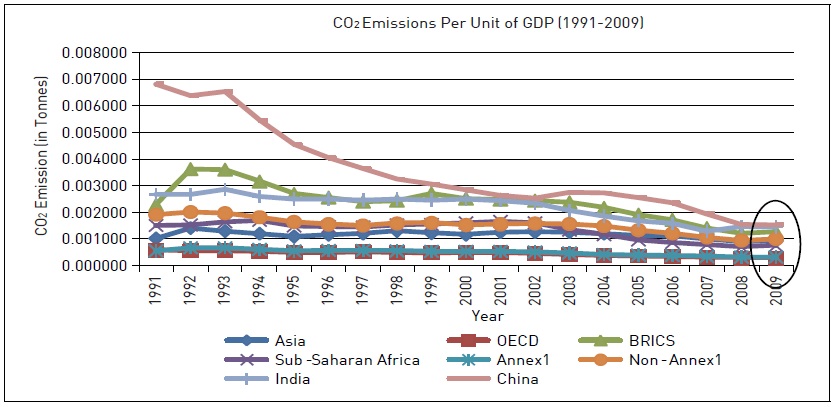
There is an argument that the CO2 emissions are largely driven by the creation of wealth and the industrialized countries are in the forefront in GDP. Therefore, they are bound to have more CO2 emissions. Figure 4 presents the trend of CO2 emissions as emissions per unit of GDP during the past two decades. The OECD and Annex 1 countries showed promisingly low CO2 emissions per unit of GDP for the entire analysis period, which has further improved towards 2009. However, it may be interesting to note that Asia is not too far behind and is comparable to OECD and Annex 1 countries’ CO2 emissions per unit GDP. Though China had very high CO2 emissions per GDP in 1991, it has improved over the analysis period and reached a comparable value by the year 2009. It is interesting to see these clusters converged by the year 2009. This indicates that the carbon efficiency of different economies, which is an indicator for the efficiency of production, is comparable with each other. In other words, the carbon intensity of GDP has converged and is comparable among ICs ad DCs whereas population based per capita emissions are diverged.
Therefore, with carbon footprint of economies comparable with that of ICs and very low per capita emissions and increasing population, DCs have a natural pattern of increasing CO2 emissions. And this finding adds more to the complication on who should play a key role in combating climate change. With an immediate task of fighting poverty the DCs are naturally poised for “economic growth” pathways which might result in more CO2 emissions.
With the developing countries growing as large CO2 emitters and joining elite club of “mega emitters”, are we heading to a stalemate situation where the “development space” get exhausted as in the case of “open pool resource regime” and leaving SSA and some other Non-Annex 1 countries with no space for their growth in future? What are the system boundaries that we should be dealing with and respecting while we plan our actions for climate protection? Climate change as a problem has two important facets:
a) Control of CO2 emissions so as to halt the changing environment;
b) Adaptation of the system and communities to the impacts that are resulting from the already changed environment
As the international negotiations are failing to garner support for a common framework of action plan to fight climate change, it is important to develop an argument which is logical and yet historically evidenced, and to devise such a common framework that can potentially address the impending issue of climate change and equally bothering issue of in-equity in the global development space. Such a framework should be applied to the issues of both mitigation and adaptation.
On equity terms, each country would ideally have CO2 emissions commensurate to their respective share of population and or GDP contributions. In order to quantify and map inequity in CO2 emissions, the annual emissions for each country were calculated by multiplying the global per capita CO2 emissions with population of the respective country. Further the CO2 emissions calculated for each country are aggregated into various regions as considered in this study. The following formula is used for the same as explained above.
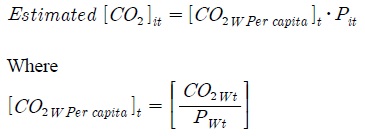
Estimated [CO2]it Total estimated CO2 emission of country ‘i’ in the year ‘t’
[CO2W Per capita]t World CO2 per capita in the year ‘t’
P
CO2
PW
Figure 5 presents the degree of inequity in total CO2 emissions for different regions in the world based on the present analysis. While Asia, Non-Annex 1, BRICS and SSA countries have been emitting far less CO2 compared to their quota of emissions based on world per capita considerations, ICs clustered as OECD and Annex 1 countries have been emitting CO2 in excess of their quota estimated based on the global per capita emissions. While Non-Annex 1 countries as a cluster continue to widen the gap between the actual emissions and world per capita based estimates (“under-emission”), Asian countries are slowly closing in on their world per capita based estimates of CO2 emissions. India has been emitting less than their emissions based on world per capita and the difference is increasing which could be attributed to the population growth to a factor.
China presents an interesting situation where its actual emissions were less than the estimated emissions based on world per capita till 2004. After that the actual emissions have exceeded the estimated emissions. This presents a classic case of a country turning from “under-utilization” to “over-utilizing” the development space.
This analysis presents the inequity prevailing among the countries in the world where the richer nations are using more development space than they deserve for the size of their population. During the analysis period the poorer countries were using far less development space compared to their entitlements. The irony is that the “excess space” being used by the richer nations, which otherwise belongs to the poorer nations, would get blocked by the farmer denying the developmental rights to the poorer nations in the world in the future.
The above analysis covered last two decades during which international climate change negotiations are ripe. The next section attempts to analyze the equity in historical use of development space across different countries in the world.
V. Development Space - Equity in Usage and its Historic Overshooting
Historic emissions for the period 1850-2009 are used to calculate the overshooting of development space by different countries in the world. World per capita carbon budget and cumulative carbon-budget per unit of GDP are calculated using the cumulative global CO2 emissions, global population and global GDP.
Carbon budgets based on population and GDP for different countries as clustered subsequently are calculated using the following formula.
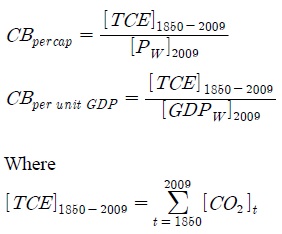
CBper unit GDP Carbon boudget per unit GDP for the period 1850-2009
CBpercap Percapita carbon budget for the period 1850-2009
TCE1850-2009 Total carbon emitted for the period 1850-2009
[Pw]2009 Global Population in 2009
[GDPw]2009 Global GDP in 2009
[CO2]t CO2 emission in the year ‘t’
As presented in Table 1, world per capita ‘cumulative’ carbon-budget and cumulative carbon-budget per unit of GDP are estimated to be 190.8 tons and 22kg, respectively.
These carbon budgets per person and per unit GDP are used to calculate the total carbon budgets for individual countries by multiplying the per capita numbers with the corresponding population and GDP of the respective countries. Population and GDP shares of each country in 2009 are considered in calculating historic share of carbon budget as the per capita CO2 calculated has captured the time period 1850-2009.
Table 2 presents the carbon budget for different regions in the world based on population and GDP figures and Table 3 presents the overshoot of the actual CO2 emissions till the year 2009. Based on global per capita carbon emission calculations (Table 1), the equitable carbon budgets by a multiple of individual population are calculated to assess the overuse or underuse of the “development space” by different regions over a period of 160 years (1850-2009). A similar approach was followed to calculate the historic use of “development space” based on economic performance of the regions (Carbon per unit GDP).
Based on population distribution, all regions other than OECD and Annex 1 countries have been underusing their “development space” for the last 160 years. SSA presents a case of serious underuse with only fourteen percent development space being used so far in the last 160 years. While Asia and Non-Annex 1 countries were underusing the space by about seventy percent, China and India have been underusing their space by about 50% and 84%, respectively. This underutilization of space by DCs has been neutralized by the ICs with OECD and Annex 1 clusters overusing the space by about 225% and 250% respectively. This present a case of serious inequality in the world in the use of development space among different countries clustered into rich and poor. Figure 6 presents the use pattern of development space among Annex 1 and Non-Annex 1 countries during 1850-2009.
Calculating by the same methodology, Annex 1 countries would have their share of development space for the entire period of 1850-2050 at 294.12 which is far less than (three times less) their usage of development space till 2009. This would mean in principle, based on historical usage, ICs have been relying on DCs space and enjoying the “rich” life style. It is a substantial degree of “Climate Debt” and the future consumption of “space” for ICs would only add to this DEBT as they do not have any more share of development space in the future years (Allen, et al., 2009; Rafalowicz, 2011; TWN, 2009).
Based on the criteria of wealth (GDP), all the regions except OECD and Non-Annex 1 countries are overshooting but mostly at insignificant levels. This would mean that the development space has been used proportionately except in the case of OECD, which has underused its development space. Though the use of development space on economic performance appeared to be equitable, it indicates that the wealthy have more right to use more ‘development space’ and due to its “open access” regime, the development space which is the limiting factor for the development would become scarce, forcing the DCs to remain in poverty and undersupplied for the rest of the time. That could probably indicate the higher degree inequity in the world even if the argument is based on GDP distribution. This analysis established the fact that based on both population and product distribution, the historical use of development space has been highly inequitable among different regions of the world. The next section examines the pattern of development space use at present and analyses the scenario for future use of available space and the degree of possible overshooting.
VI. Future Use of the Development Space - Equity Issues
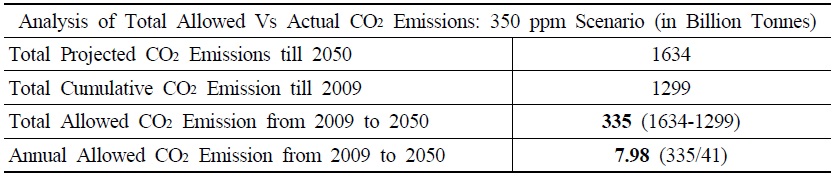
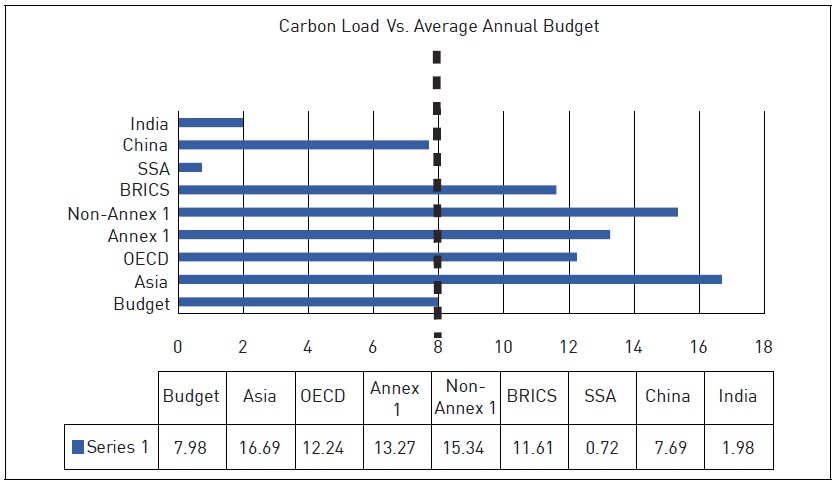
According to the literature on the bearing capacity of the globe, and also the IPCC assessment reports, we cannot have a temperature rise of more than 2℃ (IPCC, 2007; Ranger, 2012; Solomon, 2007; Huntingford et al., 2012; Den Elzen and H?hne, 2008). The catastrophes could get magnified with any further rise in global mean atmospheric temperatures. It is argued that it could be possible to keep the temperature rise limited to 2℃ if we control the total CO2 emissions in a way to have an average atmospheric CO2 concentration of 350 ppm (Allen, 2009; Schellnhuber et al., 2009). Accordingly the carbon budgets are calculated and reported by the South Center (Baer et al., 2009; Khor, 2010). Based on this the carbon budget available for the next 40 years (2009-2050) is calculated to be 335 billion tonnes as reported in the Table 4. With a simple annualization we get an average annual global carbon budget of 7.98 billion tonnes. This essentially means to have 7.98 billion tons of development space per year which needs to be shared among all countries equitably either based on population distribution or wealth creation (GDP).
The overshoot in the use of development space on annual basis is calculated by considering the global annual budget available and proportions of populations and GDP in the world. The following set of equations developed by the authors are used to calculate the overshoot or underuse of development space on annual basis for the current year (2009).
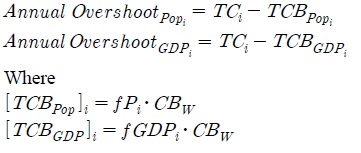
[
[
CBw Annual Global Carbon Budget
Over-shooti Excess of carbon emission by the region ‘i’
TCi Annual CO2 emission by region ‘i’
The overshoot is calculated for the regions as presented earlier in the paper. Table 5 presents the results of the current year overshooting and underusage of development space.
In the backdrop of excessive use of the development space by the industrialized countries, the remaining space for the development normalized to the present population shares of different countries presents an alarming situation. All regions except SSA have shown an excessive CO2 emission in the year 2009 compared to their annual carbon budget, which is estimated using the global average annual carbon budget distributed among countries in the world based on their share of population. While the annual global carbon budget is 7.98 billion tonnes, the measured global CO2 emissions are 28.61 billion tonnes, 3.58 times higher than the allowable limit. Except SSA region no other region including individual countries like India and China are living “within allowable carbon limits”. Figure 7 presents the CO2 emissions of various clusters in the year 2009 vis-à-vis global average budget calculated in the method explained earlier in this section.
GDP based estimation presents even more disturbing patterns with all clusters/regions including SSA overshooting the annual budget in 2009 and with even more intensity.
While the historical use of the development space is a classical recitation of inequality, the present use portrays a dangerous trend towards a major disaster of resource use. It is important to address the present “unsustainable use” of the space, and also to address the consequences of the previous “over-use” by the richer nations.
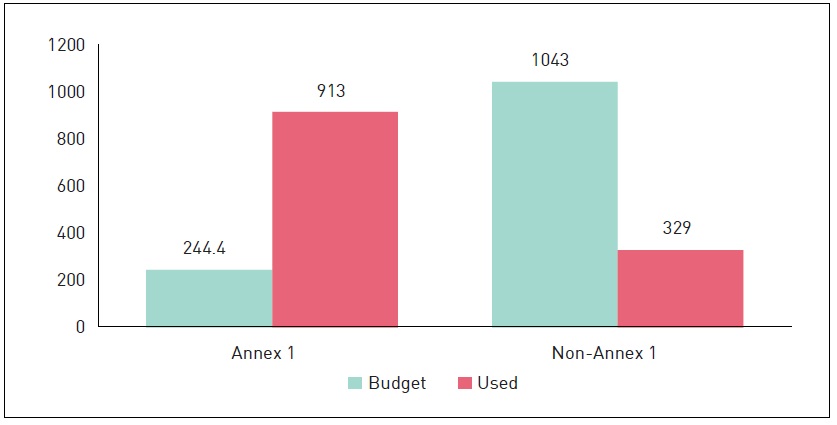
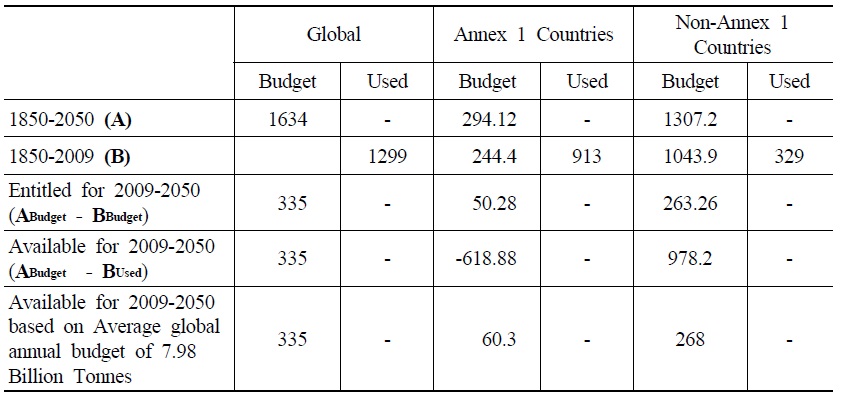
As summed up in the Table 6, Annex 1 countries have used their entire carbon budget meant for 200 years (1850-2050) in just 160 years. Further they have consumed the development space meant for DCs in excess of 600 billion tonnes of carbon.
Non-Annex 1 countries have development space (budget based on population consideration) of 1307 billion tonnes and they have consumed 329 billion tonnes so far during 1850-2009. That should leave them with a carbon space of 978 billion tonnes for the next 40 years. However, Annex 1 countries have consumed 618 billion tonnes of that space leaving the Non-Annex 1 countries with only about 300 billion tonnes of carbon space. It is also to be noted that the Annex 1 countries have long exhausted their development space.
If one has to take a “progressive approach” towards the problem of climate change and consider 2009 as the base year, for equity in allocation, Annex 1 countries should be given a space of 60 billion tonnes (7.98 times the share of their population) and Non-Annex 1 countries should be allocated a space of 268 billion tonnes. Historically ICs have been exploiting the development space of DCs and the present balance of carbon budget should be left for the DCs and should not be allowed to be consumed by the industrialized countries beyond their share of carbon budget. In addition, the Annex 1 countries should compensate for the development space used from the basket of Non-Annex 1 countries by establishing Adaptation fund for DCs to fight the calamities resulting from the changing environment (Martin et al., 2009; Kevin and Alice, 2011).
Dividing the situation into scenarios of aggressive and regressive nature towards devising a management policy of the development space, the following can be arrived at:
VII. Conclusions
Industrialized countries have used up the space in excess of their budget for the last 160 years. That has resulted in large Climate Debt towards the Non-Annex 1 countries. It is essential to adjust the past inequality by creating carbon DEBT fund based on historical usage of development space.
In a more pragmatic and optimistic approach, it is important for the industrialized countries to correct their future emissions to at least “as it stands” position and bring down their annual emissions to global average annual budget allocated based on population shares. Industrialized countries should limit their carbon footprints to their budget limits and avoid any over-stepping to the development space of DCs. Not even in “perfect-substitution” condition.
ICs should compensate for the climate debt accrued on the basis of historical overshooting and follow “pay for the service” towards the development space that they will use from DCs for the next 40 years. Alternatively the ICs should instate an adaptation fund to help DCs for their adaptation to the disastrous effects of changing climate and strictly follow their annual carbon budget by adjusting their consumption patterns.
ICs should de-carbonize their society by 2050 and DCs should green their growth and society by the same period resulting in equity at least for the sake of “Global Wellbeing”. Irrespective of the pathways, though important per se, reaching the global common by means of per capita GHG emissions, per capita service availability and (energy) consumption is perhaps is the only way to realize the global dream of 2℃ or as popularly known as 350 ppm target.
Tables & Figures
Figure 1.
Trends of Total CO2 Emissions During 1991-2009 in Different Regions of the World
Source: Developed by authors based on the data source <
Figure 2.
Trends of GDP and Population in the World
Source: Developed by authors based on the data source <
Figure 3.
Per Capita CO2 Emissions during 1991-2009 in Different Regions of the World
Source: Developed by authors based on the data source <
Figure 4.
CO2 Emissions per Unit of GDP during 1991-2009 in Different Regions of the World
Source: Developed by authors based on the data source <
Figure 5.
Annual Estimated CO2 Emissions Based on World Per Capita Emissions Vs. Actual Annual CO2 Emissions (Million Tonnes)
Note:
1. The Y-axis labels as the Total CO2 Emission in Million tonnes
2. The blue colour signifies that the actual total CO2 emission is lower than the estimated total CO2 emission based on world average.
3. The red colour signifies the excess of actual total CO2 emission over the estimated total CO2 emission.
Source: Developed by authors based on the data source <
Table 1.
Estimation of World Per Capita Carbon Budget based on Population and GDP
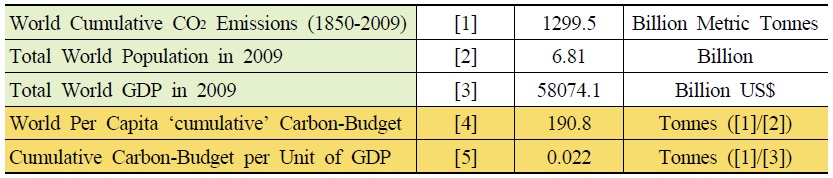
Note: The global per capita captured the emission over a period of 160 years.
Source: Calculated by authors based on data source <
Table 2.
Estimation of Region Wise Carbon Budget based on Population and GDP
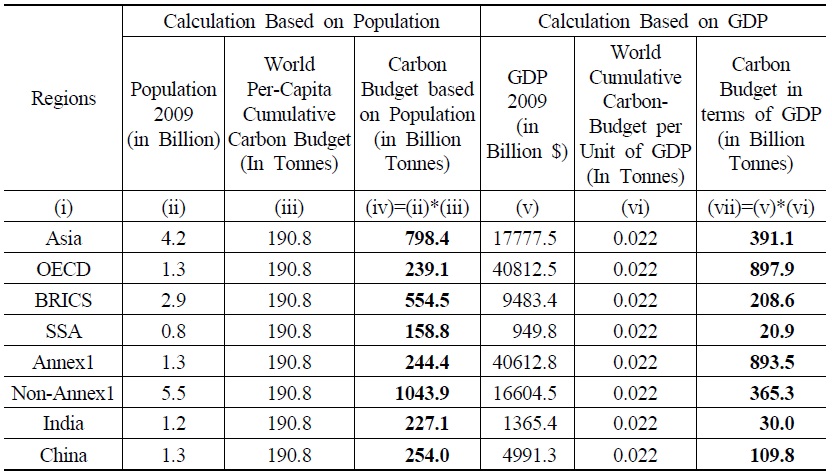
Source: Calculated by authors from data analysis <
Table 3.
Estimated Region Wise Overshooting of Carbon Budget Based on Population and GDP
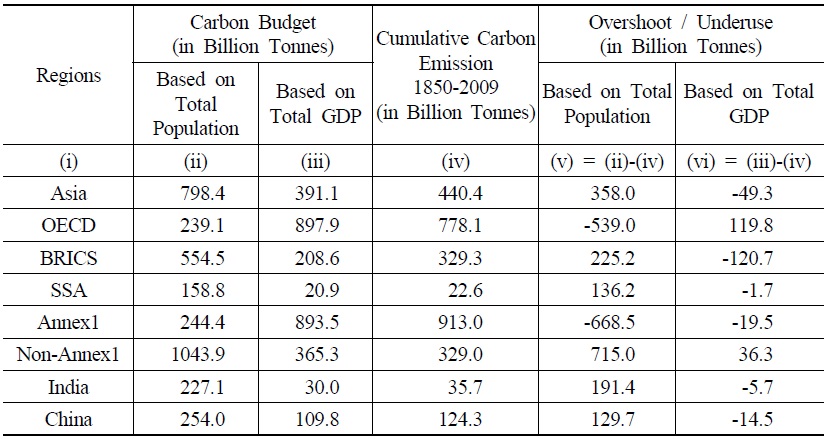
Note: Overshooting is given a negative sign and underuse is assigned a positive sign
Source: Calculated by authors from data analysis <
Figure 6.
Use Patterns of “Development Space” Based on Average Global Per Capita Carbon Budget for the Period 1850-2009 (Million Tonnes)
Source: Calculated by authors from data analysis <
Table 4.
Estimation of Total Carbon Emission Allowed from 2009 to 2050 in 350 ppm Scenario (in Billion Tones)
Source: Calculated by authors based on data source <
Table 5.
Comparison of Annual Carbon Budget and Actual Annual Carbon Emission
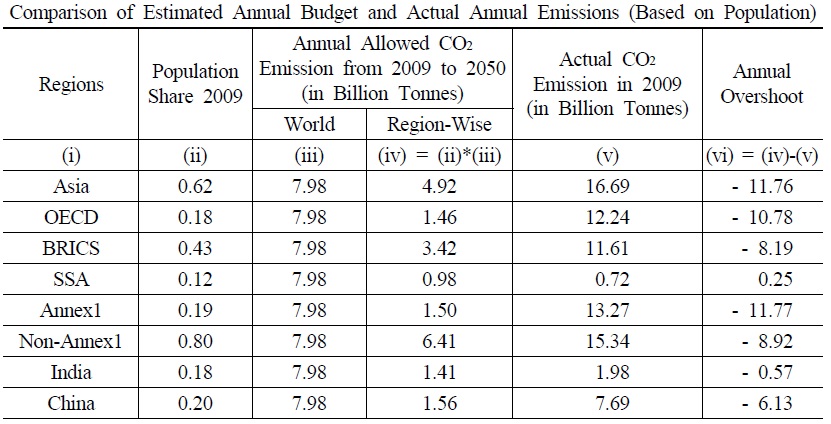
Table 5.
Continued
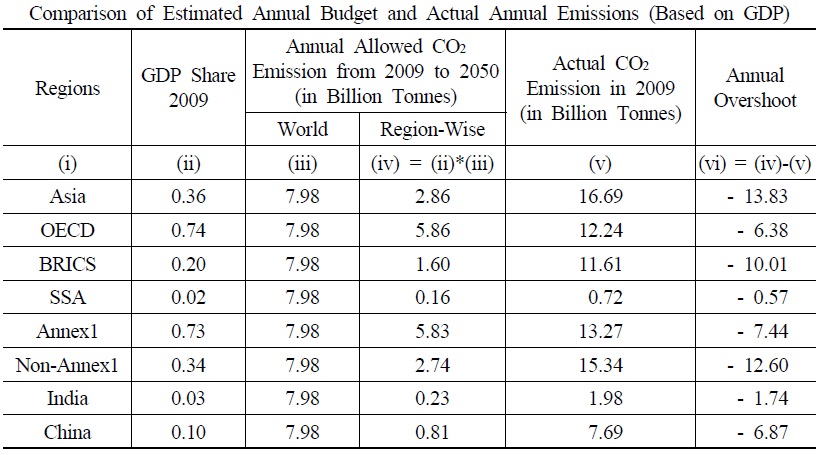
Note: Overshooting is given a negative sign and underuse is assigned a positive sign
Source: Calculated by authors from data analysis <
Figure 7.
Carbon Emissions by Different Countries in Comparison to the Estimated Annual Carbon Budget Globally (Million Tonnes)
Source: Calculated by authors from data analysis <
Table 6.
Pattern of Using Development Space by Industrialized and Developing Countries Over Different Time Horizon
Source: Calculated by authors from data analysis <
References
-
Allen, M. R. et al. 2009. “Warming Caused by Cumulative Carbon Emissions towards the trillionth ton,”
Nature , vol. 458, no. 7242, pp. 1163-1166.
-
Anderson, K. and A. Bows. 2008. “Reframing the climate change challenge in light of post-2000 emission trends,”
Phil. Trans. R. Soc. A. , vol. 366, no. 1882, pp. 3863-3882.
-
Anderson, K. and A. Bows. 2011. “Beyond ‘dangerous’ climate change: emission scenarios for a new world,”
Phil. Trans. R. Soc A. , vol. 369, no. 1934, pp. 20-44.
-
Baer, P. et al. 2009. “The Greenhouse Development Rights Framework: Drawing Attention to Inequality within Nations in the Global Climate Policy Debate,”
Development and Change , vol. 40, no. 6, pp. 1121-1138.
-
Den Elzen, M. and N. Höhne. 2008. “Reductions of greenhouse gas emissions in Annex I and non-Annex I countries for meeting concentration stabilisation targets -An editorial comment,”
Climatic Change , vol. 91, issue 3-4, pp. 249-274.
-
Huntingford, C. et al. 2012. “The link between a global 2℃ warming threshold and emissions in years 2020, 2050 and beyond,”
Environmental Research Letters , vol. 7, no. 1, 014039.
- IPCC. 2007. “Fourth Assessment Report - An Assessment of the Inter-Governmental Panel on Climate Change,” Geneva.
- Khor, M. 2010. “The Equitable Sharing of Atmospheric and Development Space: Some Critical Aspects,” Research Paper no. 33, The South Center, November 2010.
-
Najama, A. et al. 2003. “Climate Negotiations Beyond Kyoto: Developing Countries Concerns and Interests,”
Climate Policy , vol 3, no. 3, pp. 221-231.
-
Parry, M., Lowe, J. and C. Hanson. 2009. “Overshoot, adapt and recover - We will probably overshoot our current climate targets, so policies of adaptation and recovery need much more attention,”
Nature , vol. 458, no. 7242, pp. 1102-1103.
- Rafalowicz, A. 2011. “Climate Debt: Allocating Costs for Two Different Externalities - Common Pool Resource Depletion and Climate Impacts,” Masters’ Thesis, European Masters in Law and Economics, IGIDR, Mumbai.
-
Ranger, N. et al. 2012. “Is it possible to limit global warming to no more than 1.5℃,”
Climatic Change , vol. 111, issue 3-4, pp. 973-981.
-
Rogelj, J., Hare, W., Chen, C. and M. Meinshausen. 2011. “Discrepancies in historical emissions point to a wider 2020 gap between 2℃ benchmarks and aggregated national mitigation pledges,”
Environmental Research Letters , vol. 6, no. 2, 024001.
- Schellnhuber, H. J. et al. 2009. “Solving the Climate Dilemma: The Budget Approach,” German Advisory Council on WBGU Special Report.
- Solomon, S. D. et al. 2007. “IPCC climate change 2007: The Physical Science Basis,” London: Cambridge Univ. Press, 2007.
- Stern, N. 2006. “Economics of Climate Change: Stern review on the economics of climate change,” England: HM Treasury.
-
The Guardian. 2013. <
http://www.theguardian.com/environment/2013/may/14/record-400ppm-co2-carbon-emissions > (accessed Aug. 24, 2013). -
The Independent. 2014. <
http://www.independent.co.uk/environment/climate-change/lord-stern-on-global-warming-its-even-worse-than-i-thought-1643957.html > (accessed May 21, 2014). - Third World Network (TWN). 2009. “Climate Debt: A Primer,” UN Climate Change Talks - 8th Session of the AWG-KP and 6th Session of the AWG-LCA, 1 June-12 June 2009, Bonn.
- United Nations. 1997. “Kyoto Protocol to the United Nations Framework Convention on Climate Change,” Geneva.