

- EAER>
- Journal Archive>
- Contents>
- articleView
Contents
Citation
Article View
East Asian Economic Review Vol. 18, No. 4, 2014. pp. 425-461.
DOI https://dx.doi.org/10.11644/KIEP.JEAI.2014.18.4.288
Number of citation : 8View
2071
Download
334
The Impact of the Canada-Korea Free Trade Agreement as Negotiated

Abstract
This paper analyzes the impact of the Canada-Korea Free Trade Agreement on the basis of the published text and agreed schedule of commitments. We find that the Agreement reinforces existing patterns of comparative advantage between Canada (agriculture and resource-based sectors) and Korea (autos and other industries). The sensitive sectors that held up the deal for years – autos into Canada and beef into Korea – witness major trade gains, but are not unduly disrupted. In both economies, the major output gains otherwise come in non-traded services sectors, driven by income effects. We find that trade diversion effects are quite significant; this lends support for the domino theory of major free trade agreements – since the Korea-EU agreement broke the ice, the pressure has intensified on third parties to re-level playing fields by striking their own deals. The study breaks new ground in modelling services trade by developing policy impacts based on the extent to which the text of the Agreement modifies Korea’s and Canada’s scores on the OECD’s Services Trade Restrictiveness Index and by providing estimates of Mode 3 Services trade impacts. The analysis of the Agreement as negotiated, the present study, in our view, is a step forward in understanding the impact of modern free trade agreements.
JEL Classification: F14, F15, F17
Keywords
Canada, Korea, Free Trade Agreement, CGE, STRI, Mode 3 services
I. Introduction
On 11 March 2014, agreement was reached to conclude long-running negotiations towards a Canada-Korea Free Trade Agreement (CKFTA). For Korea it was the latest in a series of free trade agreements (FTAs) concluded with major economies, including the European Union (KOREU), the United States (KORUS), and Australia (KAFTA). For Canada, it marked the second deal in a row with a major economy, following hot on the heels of the deal with the European Union (CETA). Importantly, it is Canada’s first full-fledged trade agreement with an Asian economy.
Since the conclusion of KOREU, which seems to have acted as an ice-breaker, the FTA dominoes have been falling between major economies. The hold-up on KORUS was resolved weeks after KOREU; KAFTA, and a Japan-Australia FTA also followed in short order. Clearly, a key motivating factor has been re-levelling playing fields unlevelled by the prior preferential agreements. The breakthrough on the long-running CKFTA negotiations can be understood in this context.
However, two other developments helped set the stage for the deal. First, the Canadian auto sector, which had been in a severe slump following the 2008-2009 recession, rebounded, probably as far as is likely in view of the structural changes in the North American auto sector that have resulted in a shift of production to Mexico and to the United States.1 Second, the long-running Canada-Korea beef dispute was settled with a mutual agreement announced on 19 June 2012, which re-opened the Korean market for Canadian beef under conditions similar to those applying to US beef. With these issues receding in the rearview mirror and major negotiating challenges looming ahead for both parties, the dynamics favoured bringing closure to the negotiations. And closure was brought.
In terms of further process, the agreement must be ratified before coming into force. For this impact analysis study, we assume it comes into effect 1 January 2015. As regards substance, the agreement follows a standard template of subject matter covered and breaks no new ground in the rules areas. While it is difficult to reach precise conclusions regarding how negotiated text translates into trade, the CKFTA appears to deliver approximately the same degree of liberalization as KORUS or KAFTA in the rules component of the treaty.
No formal analysis of the deal as negotiated has, to our knowledge, been undertaken.2 This paper fills this gap. It provides a quantitative assessment of the impact of the CKFTA, as negotiated. The paper is organized as follows. The next section provides basic background on the Canadian and Korean economies. Section 3 describes the modelling framework and the derivation of the policy “shock” used to evaluate it. Section 4 describes the results. Section 5 draws some conclusions. Section 6 makes some final comments.
1)
2)The potential impact of a Canada-Korea FTA was assessed by the Korean Institute for International Economic Policy (KIEP), which predicted that bilateral trade would increase by 80% under complete bilateral tariff and non-tariff barrier (NTB) elimination
II. Background
1. Macroeconomic
The CKFTA links two of the largest economies in the world and, on those grounds, is a major deal. Korea ranked 10th globally in terms of gross domestic product (GDP) in 2014 with an economy measured at market exchange rates about 81% the size of 8th-ranked Canada’s. However, measured in terms of GDP at purchasing power parity (PPP) exchange rates, Korea’s economy was about 13% larger than Canada’s in 2014. Korea’s population in 2014 of 50.4 million was 42% larger than Canada’s population of 35.5 million, resulting in substantially lower levels of per-capita income, when compared at PPP exchange rates, and even more so when compared at market exchange rates. Table 1 sets out summary information on the Korean and Canadian economies.
2. Global Trade and Investment Orientation
Korea is a highly open economy and becoming more open rapidly, with two-way trade in goods and services equivalent to 110% of GDP, up from the 82% range prior to the global crisis of 2008-09; Canada is much less open with a two-way trade share of GDP of about 62%, down from about 67% prior to the global crisis (OECD, 2014). In 2012, Korea ranked 5th in the world, with two-way merchandise trade worth $1.1 trillion, and 8th in two-way commercial services trade worth $215 billion; by comparison, Canada trailed Korea in both two-way goods trade (ranked 12th, at $930 billion worth) and two-way commercial services trade ($183 billion), with a 10th place ranking in exports of commercial services and a 7th place ranking in imports (WTO, 2014).
However, Korea is much less open in terms of two-way investment than it is in trade: the stock of inward foreign direct investment (FDI) in Korea in 2013 amounted to $167 billion or 13.7% of Korea’s GDP; the stock of outward investment totaled only $42 billion or 3.2% of Korea’s GDP. The comparable figures for Canada are the following: inward investment of $645 billion or 35.3% of GDP and outward investment of $732 billion or 40.1% of GDP (UNCTAD, 2014).
3. Bilateral trade
In 2013, Korea imported US$4.7 billion from Canada, while Canada imported US$7.1 billion from Korea, resulting in a bilateral trade deficit for Canada, measured this way, of US$2.4 billion. Three-quarters of Canada’s imports from Korea were in just three HS categories: vehicles, electronic equipment, and machinery and equipment. Korea’s imports from Canada were much more diversified, with mineral fuels constituting the single largest category, but with significant contributions coming from a range of manufactured goods, ores and metals, forest products, fertilizer, agriculture and agri-foods, and fisheries (Table 2). The appearance of a decline in Canadian exports in recent years is due to unusually high levels of minerals, fuels, and wood product exports in 2011; adjusting for these blips, exports have been trending upwards, although not as rapidly as imports.
Since Korea’s tariff structure is about 3 times higher than Canada’s (averaging about 13.3% versus 4.3% on a simple average basis; ITC, 2014), Canada’s trade gains would be proportionately larger than Korea’s.
Canadian-Korean bilateral services trade has been growing, with Korea making the greatest gains, tripling its exports to Canada in US dollar terms between 2005 and 2011. There was a noticeable dip in 2009 during the global crisis, but both countries’ bilateral exports rebounded fully the following year. Neither country ranks especially high in the other’s global market considerations; however, Canada is Korea’s 13th largest services export market (counting the EU as one market), while Korea is Canada’s 11th largest market on the same basis.
4. Growth Prospects and Risks
Korea’s economic outlook is for steady growth over the medium term at about 3.9%. For Canada, the comparable figure is 2.2% (IMF, October 2014).
In terms of economic stability, Korea’s general government net debt-to-GDP ratio is projected to average about 35% over the medium term, compared to 38.5% for Canada (IMF, October 2014). However, Korea has steady structural surpluses on its general government accounts, which are projected to rise to 1.7% of GDP by 2019, as well as steady surpluses on its current account, projected by the IMF to average about 5.0% over the medium term. By contrast, Canada has persistent projected structural fiscal and current account deficits over this period (IMF, October 2014).
Korea’s risk profile is generally considered somewhat higher than Canada’s. For example,
5. Exchange Rate Dynamics
Korea’s currency has experienced two steep depreciations in the past two decades: first, during the Asian Crisis of 1997-1998 and, second, during the global crisis of 2008-2009. The won’s recovery has been gradual (Figure 1a), as the Bank of Korea has intervened heavily to slow the pace of appreciation, pushing foreign exchange reserves to a record US$368 billion in June 2014. The IMF staff report for the 2014 Article IV examination suggested that the won was undervalued by as much as 8% at end-2013. By contrast, the Canadian dollar has recently moved lower towards its PPP level, although it still remains above it (Figure 1b).
In a bilateral context, the slow recovery of the won and the generally high value of the Canadian dollar in recent years have resulted in a relatively higher degree of competitive disadvantage for Canada vis-à-vis Korea than the global economy on average. The recent trends are correcting for this, but the Canadian dollar remains highly valued in real terms, compared to the won in a longer-term perspective (Figure 1c).
6. International Trade Strategies
Both Korea and Canada have been aggressively pursuing preferential trade agreements. Korea has been the ice-breaker in cutting inter-regional deals with major economies. KOREU arguably set the dominos falling, as it was followed shortly thereafter by conclusion of KORUS, KAFTA, and CKFTA. Korea is also participating in the Regional Comprehensive Economic Partnership (RCEP) negotiations with ASEAN, China, India, Japan, Australia, and New Zealand. A key component of the RCEP is the China-Japan-Korea (CJK) negotiations. In May 2012, the CJK participants signed the Japan-China-Korea Trilateral Investment Agreement, an important step towards completing a CJK FTA and the larger RCEP Agreement. Korea is also actively pursuing membership in the Trans-Pacific Partnership (TPP).
While Korea’s flurry of FTAs has all the appearance of aggressive liberalization, Korea has been the target of complaints of applying heightened scrutiny to claims for preferential treatment in the form of demands for documentation and on-site visits to supply chain suppliers; while Korea’s requirements are understood as well within the bounds of the KORUS, US firms have complained that the Korean zeal in enforcing the agreement amounts to “excessive” documentation requirements. Other measures contested by US exporters include environmental standards, consumer protection regulations, and the equivalency of standards. Accordingly, it is one thing to negotiate a deal, it is another thing to ensure that the initialed texts translate into measurable trade impacts.
For its part, Canada has also been pursuing FTAs. In addition to the CKFTA, it has reached an agreement with the EU and is part of the TPP negotiation. Previously, Canada signed agreements with smaller economies, including Panama, Jordan, Colombia, and Peru. Perhaps more important for Canada has been the series of foreign investment protection agreements, the most notable being with China, which was ratified by Canada in September 2014 following a long period in Parliament.
7. Summary
On paper, the CKFTA appears to be more important to Canada, as it represents a first deal with a country in the dynamic East Asian region. For Korea, Canada expands Korea’s favored access to NAFTA markets, building on KORUS; Korea is also negotiating with Mexico to round out its NAFTA trifecta.
From an initial conditions perspective, Korea stands to gain, as it has the stronger beachhead in terms of established market share in Canada. From a dynamic perspective, Canada stands to benefit from an FTA with a faster-growing economy plugged into the East Asian economy and aggressively pursuing improved market access and regional integration in that area. Moreover, circumstances are relatively propitious at this time for Canada to improve on its bilateral trade performance, since Korea’s macroeconomic fundamentals are supporting a gradual rise in the won’s exchange value, which helps ensure that tariff concessions are not wiped out by exchange rate shifts. At the same time, Korea is not necessarily an easy market to penetrate. Accordingly, translating text into trade for the CKFTA is not to be taken for granted.
3)
III. Framework for the Quantitative Analysis and the Policy Shock Formulation
1. Framework for Quantitative Analysis
To simulate the CKFTA, we use a recursive dynamic version of the Global Trade Analysis Project (GTAP) model, which incorporates a Monash-type investment function (Dixon and Rimmer, 2002), and is modified to represent foreign-owned firms in each services sector to capture services trade conducted through foreign affiliates (“Mode 3” services trade, in WTO terminology). The trade impacts from these simulations capture the complex linkages across sectors at the national levels, as well as the impact of various non-tariff measures (NTMs). For a technical description of the GTAP model, see Hertel (1997); for a discussion of the degree of confidence in computable general equilibrium (CGE) estimates, see Hertel et al. (2003). A detailed description of the technical modifications is provided in Ciuriak and Xiao (2014a).
The GTAP framework integrates a number of accounts to provide a complete description of an economy.
- The standard national income and expenditure accounts.
- A breakdown of industry by sector that reflects inter-sectoral input-output links. In all, GTAP allows representation of up to 57 sectors, 43 of which are goods.
- A production function for each sector that determines the quantity of capital, skilled and unskilled labour, and intermediate inputs required to produce a unit of output in that sector.
- A trade account that models the international linkages for each sector of the economy.
The model generates impact results for national accounts aggregates, industry output and prices, capital and labour production inputs (quantities and prices), and trade and FDI flows.
We work with the GTAP V8 database. We first generate a baseline projection of the global economy from the base year of 2007 to 2014, drawing on available macroeconomic data and short-term forecasts, and then extend the baseline to 2035, drawing on available long-term projections for GDP, population, and skilled and unskilled labour from the Centre d'Études Prospectives et d'Informations Internationales (CEPII) (see Fouré et al., 2012). Real global growth averages about 3% per annum over the period 2016-2035; Korea grows at about 4% over the whole period, slowing from 4.2% over the period to 2025 to 3.6% over the following 10-year period to 2035; Canada grows at 2.5% for the whole period, slowing from 2.6% in the first half to 2.4% in the second half of the period.
We assume that the CKFTA will enter into force in 2015. The model is then simulated forward in a dynamic process whereby changes in the rate of return on capital induce investment, and changes in wage rates induce increased labour force participation. The results reported are changes relative to the baseline at 2015, 2020, 2025, 2030, and 2035. The reported gains in 2035 may be interpreted as a permanent increase in the level of output of the economy, once full equilibrium has been restored following the policy shocks, including the reallocation of capital and labour across sectors in response to the changed opportunities in the liberalized economy.
Several adjustments are required to the trade and protection data in the GTAP database to account for important changes that would materially affect the simulations. In particular, we pre-shock the model to establish a representative volume of Korean imports of beef from Canada (which were zero in the GTAP base year of 2007 due to the BSE-related ban on beef imports from Canada) and a 40% tariff, in line with the tariffs posted by the ITC for HS 0201/0202. We also update Canada’s tariff data to reflect the tariff cut in March 2010 covering 1,541 items, mainly in manufacturing inputs and machinery and equipment.
As regards model closures in the GTAP-FDI model, investment adjusts to changes in the rate of return; similarly, we allow labour supply to adjust to changes in wages. As a result, the CKFTA impacts generate “endowment” effects: that is, the amount of labour and capital in an economy change based on changes in returns to labour and capital.4 Further, we necessarily adopt the closure where the current account adjusts to accommodate the trade shock, rather than the alternative of assuming a fixed external balance; this reflects the active role of FDI in our model.5
2. The CKFTA Policy Shock Specification
Like other modern, comprehensive trade agreements, the CKFTA covers not only trade in goods and services, but also investment, government procurement, intellectual property (IP), temporary entry of businesspersons, e-commerce, competition policy, and environmental and labour issues, along with dispute settlement. An audiovisual coproduction agreement is to be negotiated; KAFTA already includes such an agreement.
Converting the negotiated CKFTA text into a policy “shock” for modelling is far from straightforward. For tariff elimination/reduction, tariff schedules must be aggregated into the 42 GTAP goods sectors. The GTAP protection data reflect 2007 tariff levels weighted by 2007 trade values. Both the tariff levels and the composition have since moved. Accordingly, a considerable amount of judgment must be applied to specify reasonable degrees of tariff elimination by sector. For the other elements of the agreement, the degree of liberalization or facilitation has to be interpreted in terms of model parameters governing cross-border trade in goods and services and in investment.
To bring out the relative contribution of the various quantifiable elements of the CKFTA, the agreement is simulated on a sequential basis, introducing in turn:
- Tariff liberalization;
- Tariff liberalization with preference under-utilization and utilization costs taken into account;
- Adding in reduction of non-tariff barriers (NTBs) on goods;
- Adding in reduction of NTBs on cross-border services; and
- Adding in liberalization of FDI in services and the resulting impacts on services trade conducted through foreign affiliates (as measured by foreign affiliate sales, FAS).
We describe the assumptions we make below and comment on the issues faced in constructing the shock file.
3. Tariffs
For Korea, we make the following assumptions in generating the policy shock for tariffs:
a) On agriculture and agri-food, Korea is to progressively eliminate tariffs on 86.8% of tariff lines.
• Rice and rice products (GTAP 1 + 23): excluded completely.
• Wheat (GTAP 2): 100% cut of the GTAP effective tariff of 2.2% immediately.
• Other Grains (GTAP 3): the GTAP tariff is very high (247%), which reflects very high tariffs on products like barley (779%) and popcorn (630%). The average base rates on rye, oats, and canary seed, which Canada ships, are much lower, ranging from 3 to 5%. Korea’s cuts to these rates work out to a weighted average of about 96%, based on 2013 import levels from Canada. We reduce the tariff on this GTAP line by the equivalent of 4.9% in year 1, accordingly.
• Fruit and vegetables (GTAP 4): this is perhaps Korea’s most sensitive area in agriculture. However, the products that Canada ships to Korea under this heading are less sensitive and the GTAP tariff facing Canada is only 28.51%. This is consistent with the applied tariffs on chickpeas, lentils, broad beans, and dried and kidney beans, which are highlighted as areas of interest for Canada and which constitute the main Canadian exports in this category. Two other categories of beans – mung and adzuki – which Canada produces in small quantities and which Korea imports in small quantities, face prohibitively high tariffs that are to be phased out over 15 years. The Korean market for these products is small with almost no worldwide imports, while Canada’s export markets are heavily concentrated in India and the Middle East. The impact of removal of this prohibitive tariff is likely to be minor. According to the schedule, tariffs will be eliminated for the majority of items in 5 years. We phase in a tariff cut equivalent to 25.7% or 90% of the GTAP weighted average effective tariff.
• Oilseeds (GTAP 5): evaluating this is complicated for several reasons. For canola seed, the CKFTA tariff schedule and the technical summary indicate a tariff of 10%, but Korea autonomously cut its tariff on rapeseed for crushing to 5% in crop year 2013.6 On soybeans, tariffs average 757% over 3 lines and the technical summary indicates “up to 487%” for “soybeans for soy sauce or soy cake” and a zero tariff for in-quota soybeans for food use. The United States has tariff free access under KORUS for food-grade soybeans with an ever-expanding quota,7 and Korea autonomously reduced tariffs on in-quota soybeans for crushing to zero. Canada appears to have obtained similar treatment. We evaluate the effective tariff cut for this GTAP category as the equivalent of a total of 6.7% with equal reductions in years 1 and 5.
• Sugar Cane (GTAP 6): imports from Canada are minimal and the base rate is just 3%. The GTAP tariff for sugar cane from Canada is zero, because of zero imports in the GTAP base year. There is no impact in this sector.
• Plant Fiber (GTAP 7): imports from Canada are minimal and face a very low tariff (2%); we eliminate the tariff immediately. The GTAP protection level is slightly smaller at 1.4%.
• Other crops (GTAP 8): imports of alfalfa hay make up most part of the imports in this category. Alfalfa hay faces very low base tariff (1%), which will be eliminated immediately. Tariff on other items, like seeds of coriander (8%) and vanilla (8%), are cut in year 3. The GTAP weighted average effective tariff cut is 3.2%.
• Cattle, Sheep, etc. (GTAP 9): milk cows and beef cattle form about 99% of the import in this sector; they face relatively high protection of 40 to 89%. According to the schedule, we remove all of the tariff protection (40% in GTAP) in year 1.
• Animal Products (GTAP 10): hides and skins of mink comprise most of the imports and they face tariffs ranging from 3-5%. We eliminate the GTAP level of protection of 4.5% immediately.
• Forestry (GTAP 13): over 60% of Canada’s exports to Korea have been of logs, which enter tariff free, resulting in a very low GTAP tariff. Softwood lumber faces a 5% tariff, while OSB faces an 8% tariff. The cuts are phased in at 40% immediate, 30% at year 3, and the remainder at year 5.
• Fishing (GTAP 14): mainly lobsters (20%); we phase out the GTAP tariff of 19.1% in 3 years.
• Coal (GTAP 15), Oil (GTAP 16), and Gas (GTAP 17): no protection or no trade items. There is no shock for these sectors.
• Other Minerals (GTAP 18): low protection (about 1%); we eliminate the tariff immediately.
• Beef (GTAP 19): the GTAP tariffs in the beef sector are very low, reflecting zero imports of Canadian beef during the BSE ban. Fresh, chilled, or frozen beef imports recovered to US$9.7 million in 2013 and should move higher autonomously with the expansion of the SPS window to 30 months from under 21 months. We pre-shock the model to establish a representative volume of imports and a 40% tariff, in line with the tariffs posted by the ITC for HS 0201/0202. The import of pig/poultry fat consists of 1/3 of the total imports in this sector. Its base rate is 3%, which will be eliminated in year 1. The tariff for this sector is phased out in 15 years.
• Meat Products (GTAP 20): mostly streaky pork (over 95% of sector’s imports), which has 22-25% tariff rate; we phase out the GTAP tariff of 23.9% over 13 years.
• Vegetable oils (GTAP 21): canola oil tariff is listed at 10% and animal fats and oils that are aggregated in this category face tariffs up to 8%, while some minor oils face higher tariffs. We cut the GTAP tariff of 12.8% in this sector by 95% for an effective cut of 12.1%, phased in with cuts in years 1, 3, 5, and 7, as per the schedule.
• Dairy (GTAP 22): this sector is excluded.
• Sugar (GTAP 24): 87% of the imports in this category are comprised of maple syrup, which faces an 8% base rate. Sugar for manufacturing spirits, which faces a 3% tariff, comprises 9% of the sector imports. The tariff of those items will be eliminated immediately. Added flavouring, which faces a 35% base rate, is excluded. The effective tariff rate cut in this category is 7.8%.
• Food Products (GTAP 25): this category includes a wide range of food products, such as sable fish, rock fish, peeled, cockles, clams, sea-cucumbers, meslin, mussels, oysters, cola base, ginseng tea, etc. For 90% of the items, the tariffs will be phased out in 10 years. We reduce the GTAP tariff of 28.9% by 90% for an effective tariff cut of 25.1%.
• Beverages and tobacco (GTAP 26): GTAP has a very high tariff level of 177% in this sector, mainly due to the high tariff of 269% on malt (not roasted). The rest of the items within this sector, such as red wine and beer, face tariffs in the range of 8-15%. These are to be phased out over 5 years. Calibrating the tariff shock for this sector requires a detailed calculation.
- Imports of malt comprise 68.3% of total imports in this category; these come in under tariff rate quotas (TRQs) (paragraph 5 Annex 2-G of the agreement). The quota is to increase from 13,000 metric tonnes in year 1 to 25,000 metric tonnes in year 11. Based on the ITC trade map data, Korea imported an average 22,000 tonnes of malt per annum from 2012 to 2013. That means in 10 years’ time, malt imports will approximately double.
- Given that malt imports comprise about 70% of sector imports, this implies a contribution to sector imports growth of 70%.
- Given the Armington elasticity is about 1.8, we need about 40% tariff cut in total over the period, in order to stimulate the sector imports up 70%.
- With the tariff on the other items in this category being phased out, we calculate a shock equivalent to a tariff cut of 44.5%.
• Wood Products (GTAP 30): cedar comprises 60% of the imports and faces a 5% base rate that will be eliminated over 3 years. The protection for other items is phased out over 10 years.
• Chemicals (GTAP 33): ethylene glycol comprises 30% of sector imports and anti-tuberculosis preparations comprise 20%. The protection for these items is phased out over 3 years. The protection for the rest of the items in this sector is phased out over 10 years. The effective protection cut is 3.1%.
• Mineral Products (GTAP 34): tariffs on 85% of the items will be cut immediately and the rest will be cut in 3 years.
• Machinery and Equipment (GTAP 41): we eliminate 95% of tariffs in year 1 and the remaining protection in year 3.
• We eliminate the tariffs of the following industrial sectors immediately: Textiles (GTAP 27), Wear Apparel (GTAP 28), Leather Products (GTAP 30), Paper and Paper Products (GTAP 31), Petroleum and Coal (GTAP 32), Ferrous Metals (GTAP 35), Metals NEC (GTAP 36), Motor Vehicles (GTAP 38), Transport Equipment (GTAP 39), Electronic Equipment (GTAP 40), and Other Manufactures (GTAP 42).
For Canada, the picture is somewhat simpler.
• GTAP sectors without tariff cut: 1, 5-7, 9, 11, 12, 15-18, 22, and 23.
• GTAP sectors with 3-year phaseout period: 8, 10, 13, 14, 20, 21, 27, 28, 31, 32, 34, 38, and 40.
• GTAP sectors with 5-year phaseout period: 2-4, 19, 24-26, 29, 30, 33, 35-37, 39, 41, and 42.
4. Rules of Origin, Preference Utilization, and Cost of Utilization
To access the preferences accorded under the CKFTA, importers (and by extension exporters) need to establish that their products meet the rules of origin (ROOs) stipulated under the Agreement. Because of the cost of accessing preferences (in terms of time, out-of-pocket costs, and bother), preferences are not fully utilized, in the sense that some trade that is eligible for preferential treatment flows through most-favoured nation (MFN) channels and is taxed at MFN tariff rates. The extent of utilization varies by size of transaction, reflecting the fixed-cost nature of some aspects of the compliance costs with ROOs regimes (Keck and Lendle, 2012).
Since a large portion of trade is accounted for by very large volumes of transactions of a small number of large firms (many of them multinationals), which can afford dedicated staff to attend to the complications attendant on ROOs compliance, overall utilization appears to be relatively high. At the same time, for the large tail of smaller entrepreneurial exporters, the costs are significant and many choose to pay the MFN rate rather than incurring the costs in terms of money, time, and bother of ROOs compliance. Following Petri, Plummer, and Zhai (2011, 2013 – hereinafter PPZ), we assume a utilization rate of 63%.
We modify their approach as follows. First, for primary production, we assume full utilization on the basis that there are minimal imported inputs into primary products or minimally processed products. Moreover, trading firms in agricultural commodities tend to be very large multinational firms that are able to take advantage of trade preferences. Since primary sector trade tends to be bulk trade, the fixed costs of ROOs documentations are assumed to be negligible on an ad valorem basis. For secondary sector products (i.e., manufactured industrial goods), we adopt the PPZ assumption of a 63% utilization rate for tariffs. Effectively, this leaves some tariff protection in place for tariff lines that are, in principle, fully liberalized (e.g., for a tariff of 5%, the remaining tariff would be equal to 0.37 times 5% or 1.85%).
Second, for manufactured goods trade that utilizes preferences, we assume a 2% ad valorem cost of preference utilization based on a review of the relevant literature (see, e.g., Ciuriak and Xiao, 2014b). This cost is incorporated as a negative productivity shock of 1.26% (equal to 0.63 times 2%).
5. Non-Tariff Measures for Goods
NTMs restrict market access to varying degrees; however, tariff equivalents at disaggregated product levels do not exist (see, e.g., discussion in Kee, Nicita, and Olarreaga, 2008, 2009), nor are there consistent, transparent methods for converting FTA measures into a quantum of liberalization. Further, the trade-restrictive effect of individual measures is difficult to quantify and, in respect of those measures for which effects can be quantified, the pacts range from marginal to effectively prohibitive (see Ciuriak, 2008 for Canada-EU NTMs). Finally, many NTMs that are raised by industry as irritants cannot easily be dealt with in preferential trade agreements, since they require a general amendment of regulations.
However, general provisions, which address transparency, provide for rapid response to trade problems and/or address customs procedures and can contribute to the overall intensification of bilateral trade between FTA partners. PPZ compile estimates for a number of countries, including Canada and Korea (Table 5). Following PPZ, we model NTB reduction in goods as a positive productivity shock. To capture the asymmetrical effect of NTB reductions, we consider the Singapore-level of trade costs associated with NTBs to represent the best achievable. We reduce the bilateral trade costs between Canada and Korea by 10% of the difference between the reported ad valorem tariff equivalent of the NTBs in each country and the level reported for Singapore. The transparency index for Korea is eliminated based on the improved bilateral consultation mechanisms.
6. Services Trade Liberalization
Services differ from goods in the sense that they are intangible, non‐storable, and often require joint production (i.e., consumers and producers need to be in the same location at the point of consumption – see, e.g., Kneller et al., 2010). The WTO General Agreement on Trade in Services (GATS) accordingly classifies trade in services into four modes of supply: (1) cross-border supply; (2) consumption abroad; (3) commercial presence; and (4) the movement of a natural person to a consumer’s country of residence.
The GTAP model does not allow for international movement of labour; accordingly, Mode 4 liberalization cannot be directly evaluated. Similarly, consumption abroad cannot be captured and, thus, Mode 2 is not covered either. We focus on the two main modes of services trade, both of which are impacted by the CKFTA: Mode 1 and Mode 3. The discussion of Mode 3 is taken up in the section below on investment. Here we focus on Mode 1.
As with goods NTBs, it is not straightforward to determine which of the wide range of regulations affecting the delivery of services are barriers – measures that impose regulatory requirements that serve no purpose other than to impede trade – versus regulations that serve other public policy purposes, such as prudential regulation of financial institutions. Moreover, the same issues concerning the ability to determine the liberalizing effect of specific regulatory changes that might be required by an FTA text pertain to services as to goods NTBs.
The CKFTA improves upon Korea’s obligations under the GATS in various professional services, including foreign legal consultancy services; commercial education and training; research and development (R&D); environmental services; business services; and services incidental to manufacturing, mining, and wholesale trade. The standalone chapter on telecommunications follows KORUS in terms of addressing fair access to Korean telecommunications networks, including those managed by monopoly or major providers. The standalone chapter on financial services has extensive reservations for regulatory purposes; US commentary on the value of the comparable provisions in KORUS emphasizes the ability of financial institutions to transfer data processing outside of Korea. Exactly how valuable this will be to Canadian financial institutions remains to be seen. The standalone chapter on movement of businesspersons covers business visitors, traders and investors, intra-company transferees, professionals (contract service suppliers and independent professionals), and their spouses; these measures are well-rehearsed in other FTAs.
Canada’s services commitments are substantially similar to its NAFTA commitments, as well as those in its recent FTAs with Peru, Colombia, and Panama (Chang, 2014).
For modelling purposes, we start with available estimates of NTBs to services trade compiled by PPZ (2011) in the context of the TPP (Table 6). We then draw on recent estimates by Ciuriak, Dadkhah, and Xiao (2014) of the liberalization entailed in the CKFTA, based on changes in each country’s scores on the OECD’s Services Trade Restrictiveness Index (STRI) for bilateral trade, pre- and post- CKFTA. In this calculation, the actual text of the CKFTA is reviewed; if a measure changes the coding in the STRI for Korea or Canada, the STRI is adjusted accordingly. Thus, the liberalization effect of the CKFTA by measure is commensurate with the weights assigned in the STRI to that measure. We then multiply the percentage of the reduction of STRI by the initial tariff-equivalent rates (PPZ, 2011) to determine the post-CKFTA tariff-equivalent rates for each service sectors.
By the same token, text in the CKFTA that does not change the STRI is accorded a zero weight in terms of liberalizing effect. Any measure that “squeezes water” out of Canada’s or Korea’s GATS bindings would thus not receive any credit for liberalizing trade. Trade negotiators, however, attach significant value to “squeezing water” out of tariffs and NTMs by binding at existing applied levels or practice. Developing rigorous methods for evaluating the effect of bindings remains an outstanding research issue. The estimates provided in this paper may be considered as conservative, given that this binding effect is not explicitly taken into account.
The main form of services trade for many service sectors is through commercial presence. The CGE model used for the present analysis incorporates an important modification to the standard GTAP model by breaking down each sector into domestically-owned and foreign-owned sub-sectors. We report services sales into the domestic economy, broken down into domestic sales and FAS.
7. Investment Liberalization
The impact on investment is simulated by reductions in the estimated level of NTBs facing investment, as captured by the “phantom tax” derived, in this study, from the FDI Restrictiveness Index developed by the OECD. The descriptions of this modelling framework and the derivation of the phantom tax are set out in Ciuriak and Xiao (2014b).
As regards the level of investment liberalization, consistent with the depth of barrier reduction implied by a modern high-quality agreement, as evaluated in PPZ (2011), we assume a 59% cut in the level of investment restrictions.
4)The sensitivity of the trade impacts on third parties of the alternative closure rules is shown by
5)See
6)See
7)US analysis anticipated only moderate expansion of soybean sales to Korea under KORUS of about 5-11%. See Table 2.2 in
IV. Results
1. Macroeconomic Impacts
Table 7 summarizes the model results for Korea and Canada, respectively, of the CKFTA impacts over the period 2015, when the Agreement is assumed to come into force, through 2035.
The CKFTA has small but positive impacts on both Canada and Korea in terms of economic welfare and GDP. The gains are comparable for both economies in percentage terms, but Canada gains somewhat more in absolute terms due to its higher levels on both indicators. Short-run impacts are small, reflecting not only the phasing-in of tariff cuts, but also the phased-in response of investment to changed conditions. In terms of GDP, Canada’s gains build over time from a small initial gain to 0.05% of GDP when the full effects of the Agreement have been realized; Korea’s build up to 0.06%. For both economies, the economic welfare gains are commensurate with the GDP gains, rising by 0.066% for Canada and by 0.065% for Korea. In level terms, the welfare gains are very similar, with Canadian household income in aggregate being boosted by US$1,690 billion and Korea’s by US$1,641 billion.
The impact of the CKFTA on excluded parties is negative, reflecting the effects of trade diversion. Much of the gain for Canada comes at the expense of the US and EU, which had previously concluded FTAs with Korea; accordingly, Canada’s gain constitutes, in some sense, a claw-back of prior lost preference (Table 8). This effect illustrates the pressures underlying the “domino theory” of FTAs: once major countries enter into FTAs, there is pressure on other trading partners to cut their own deal to mitigate competitive losses in those markets (Baldwin, 1995; Ciuriak, 2010).
As regards the policies that drive the gains, this varies for Canada versus Korea. This is brought out in Table 9, which provides the GDP and welfare gains in 2035 as a result of incremental application of the policy measures captured in the modelling exercise.
The aggregate goods trade impacts of the CKFTA are set out in Table 10, including bilateral exports and total exports to the world to show the degree of trade diversion generated by the agreement.
A novel feature of our model is that it provides insight into the impact of liberalization on services trade through Mode 3. While the model does not represent each separate country as a foreign investor and, accordingly, it is not possible to precisely allocate FAS in Korea to Canadian affiliates, we may interpret the change in FAS in Korea as the impact deriving from changes in Canadian investment and the change in FAS in Canada as deriving from changes in Korean investment. As can be seen, the change in cross-border imports driven by the CKFTA is small; most of the services trade gains are in Mode 3.
Figures 2 through 6 summarize the impacts of the CKFTA on Korea graphically, showing the incremental impact of each policy measure to GDP, household income, exports, imports, and investment. The figure may be interpreted as follows: bar 1 shows the percentage gain in GDP due to tariff reductions; bar 2 shows that this gain is reduced when we take account of under-utilization of preferences and the cost of using preferences; bar 3 shows that the net gain rises once NTB reductions on goods are taken into; bar 4 shows that the net gain rises still further when services FDI is taken into account; bar 5 shows that there is effectively no net gain from FDI liberalization. In other words, the difference from the preceding bar is the measure of the contribution of the additional policy shock.
Figures 7 through 11 provide the comparable information for Canada.
2. Sectoral Impacts
The CKFTA confronts a pattern of protection that is very uneven across sectors in both economies. Accordingly, the impacts vary sharply by sector.
For Korea, the deal expands the auto sector and transportation equipment exports in particular, followed by chemicals and ferrous metals. In terms of production gains, the biggest winners after autos are non-traded services. Business services also make a substantial gain, although this is primarily induced by domestic income gains. In terms of declining sectors, the beef sector and food products experience relatively modest declines compared to the inroads in the Korean market made by Canada, as these inroads come in good measure at the expense of third parties. Note that insofar as the CKFTA is implemented contemporaneously with KAFTA and KORUS, these diverted gains will not for the most part actually be experienced by Canadian exporters – rather, they stand as “virtual” gains compared to a situation where Australia and the United States expand preferential access at Canada’s expense. By the same token, the bilateral export gains anticipated by the United States and Australia will also be diminished as the diverted portion will not, in fact, be realized.
For Canada, the CKFTA expands agricultural output, especially beef and pork production, and boosts non-traded services through income effects. The deal slows the expansion of Canada’s heavy industry and manufacturing sectors. The automotive sector impact is much smaller, in terms of output declines (about US$93 million or -0.0%), compared to the close to $1 billion expansion of Korea’s auto imports. The main impact of this is on third party imports into Canada; the impact on Canada’s automotive sector is further softened by the income gains from the deal. This is consistent with Ciuriak’s (2012) findings for impacts on Canada’s auto sector from bilateral trade liberalization with Japan.
The deal thus reinforces existing patterns of comparative advantage in both economies.
V. Discussion and Conclusions
With the final text of the CKFTA now in hand, it is possible to attempt an evaluation of the agreement as negotiated. The evaluation remains ex ante in nature, as the agreement has not been implemented and the trade value assigned to the commitments in the services and investment areas remains to be validated. Whether the various transparency and facilitation measures on NTBs simply remove nuisance factors in goods and services trade and investment or whether they materially affect the costs, resulting in expanded trade flows and greater investment, will need to be evaluated on an ex post basis. The present study is, nonetheless, in our view, a step forward in understanding the impact of the CKFTA.
Overall, we find that the CKFTA results in positive but relatively small gains in economic welfare and economic activity. The gains are well-balanced between Korea and Canada. Korea’s GDP rises by a permanent 0.06% and welfare by US$1.6 billion, once the full effects of the agreement work their way through the economy. The comparable gains for Canada are 0.05% in GDP and US$1.7 billion in welfare.
Bilateral export gains are also well-balanced, with Korea expanding its exports of goods to Canada by 19% or US$1.7 billion, and Canada expanding its bilateral exports to Korea by 26% or US$1.9 billion. In services trade, the gains are dominated by foreign affiliate sales and, here, Korea makes somewhat larger gains in sales (US$217 million, of which US$191 million are in FAS), compared to Canada (US$142 million in total services sales, of which US$99 million are in FAS).
As regards the scale of the trade impact, the bilateral export gains for Canada are roughly half the order of the gains that FTAs in general appear to have on Canadian bilateral exports to the FTA partner, based on ex post gravity modelling (Ciuriak, 2014). Since the income and welfare effects are indirectly driven by the direct effects of trade agreements on trade flows, this suggests that the estimates we report underestimate the impacts by a factor of perhaps 2. In this regard, our results line up with the general pattern emerging from the empirical trade literature which finds that CGE modelling tends to understate trade impacts.
Notwithstanding this concern of impact understatement, we have factored in the known tendency for some degree of preference under-utilization, because of the deterrent costs of compliance with ROOs. This is an important factor in terms of shaping the structural impacts of a trade agreement, since ROOs compliance primarily affects more complex manufactured products. We note that US stakeholders have registered complaints about rigorous ROOs administration by Korean Customs. Accordingly, this factor needs to be taken into account in evaluating the impacts.
In terms of the structural impacts, the CKFTA tends to reinforce existing patterns of comparative advantage between Canada and Korea: for Canada, the agricultural sector gains and, for Korea, the industrial sector gains. The sensitive sectors that held up the deal for years – autos into Canada and beef into Korea – witness significant bilateral export gains, as was expected. In both economies, the major output gains otherwise come in non-traded services sectors, driven by the deal’s income effects.
The overall impact on Canada’s auto sector is fairly limited: most of the expansion of Korean imports is at the expense of third parties. Ignoring borders and evaluating the deal from a multinational firm perspective, Korean firms gain at the expense of US and Japanese firms.
Similarly, the impact of expanded Canadian beef and pork exports to Korea comes only partly at the expense of local production, with much of it diverted from third party suppliers, mainly the United States and Australia. In this regard, the motivation for the CKFTA (i.e., levelling the playing field vis-à-vis competitors in the Korean market) colours these gains as partly clawing back market share eroded by preferences that Korea had previously granted to others. This illustrates the logic of the domino theory of FTAs: once Korea broke the ice with KOREU, the FTA dominos have been falling, as countries have sought to avoid being disadvantaged in key markets (Baldwin, 1995; and Ciuriak, 2010).
This study does not factor in the impact of the IP chapter. Korea is a major market for online activity and, conceivably, this is an area where Canadian technology providers might have attractive markets. However, the technology community generally prefers more flexibility and less steel in IP rules, so stronger IP rules do not necessarily translate into greater activity. In any event, the IP policies of both Canada and Korea are not driven by the CKFTA.
VI. Additional Commen
Finally, a word of caution appears to be warranted on the relative efficacy of formal inter-governmental agreements versus business relationships. Korea and Canada feature very different business cultures. In particular, social capital remains important in Korean business with its
Tables & Figures
Table 1.
Canada and Korea: Summary Statistics, Estimated 2014

Source:
Table 2.
Canada-Korea Merchandise Trade Trends, 2006-2013, USD millions

Source:
Table 3.
Canada-Korea Services Trade Trends, 2006-2013, USD millions

Source: OECD bilateral services exports for Korea; Statistics Canada bilateral services exports for Canada, converted to USD based on US Federal Reserve FRED database. Note that Canadian services import statistics show that imports from Korea have averaged about US$360 million per annum from 2005 to 2013, with no upward trend. Statistical agencies generally agree that the services exports statistics are more reliable than services imports statistics; accordingly, we present the bilateral trade data on an export-export basis.
Table 4.
Risk Profile, Korea and Canada

Source:
Figure 1a.
Korea - Real Effective Exchange Rate, 1995:01-2014:06

Figure 1b.
Canada - Real Effective Exchange Rate, 1995:01-2014:06

Figure 1c.
Canada-Korea Real Effective Change Rate Trend

Source:
Table 5.
Policy Shock for Non-tariff Barriers for Goods

Source:
Table 6.
Estimated Non-tariff Barriers for Services

Source:
Table 7.
CKFTA Impacts, Macroeconomic Indicators (% change unless otherwise indicated)

Source: Calculations by the authors.
Table 8.
Impacts of the CKFTA on Third Countries’ GDP, Change over Baseline

Source: Calculations by the authors. Note: ROW stands for “Rest of the World”.
Table 9.
CKFTA Impacts by Policy Measure, Incremental Change over Baseline in 2035

Impacts: A: tariff reduction; B: imposition of ROOs; C: reduction of goods NTBs; D: reduction of services NTBs; and E: easing of FDI restrictions. Source: Calculations by the authors.
Table 10.
CKFTA Aggregate Trade Impacts: Canada and Korea Bilateral and Global Exports of Goods, Incremental Change by Policy Measure, in 2035

Source: Calculations by the authors. Note: A-E represent the same effects as in
Table 11.
CKFTA Services Trade Impacts: Canada and Korea Cross-Border Bilateral Imports and FAS, Change over Baseline

Source: Calculations by the authors.
Figure 2.
Contribution to % Change in Korea’s GDP by CKFTA Policy Measure

Figure 3.
Contribution to Change in Korean Household Income (US$ millions) by CKFTA Policy Measure

Figure 4.
Contribution to % Change in Korean Exports by CKFTA Policy Measure

Figure 5.
Contribution to % Change in Korean Imports by CKFTA Policy Measure

Figure 6.
Contribution to % Change in Korean Investment by CKFTA Measure

Figure 7.
Contribution to % Change in Canada’s GDP by CKFTA Policy Measure
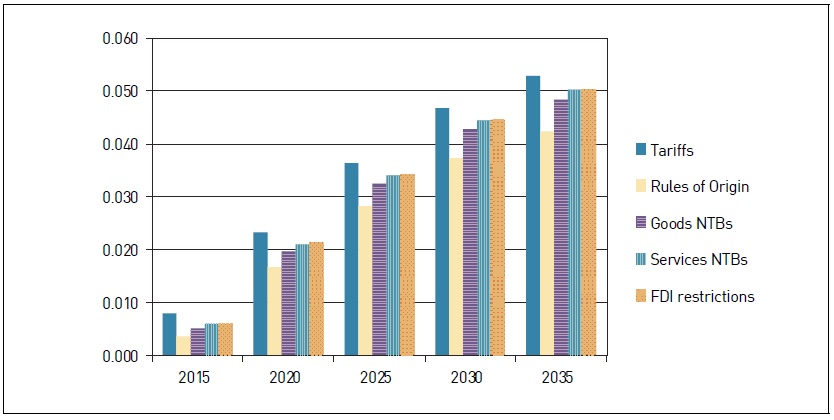
Figure 8.
Contribution to Change in Canadian Household Income (US$ millions) by CKFTA Policy Measure

Figure 9.
Contribution to % Change in Canadian Exports by CKFTA Policy Measure

Figure 10.
Contribution to % Change in Canadian Imports by CKFTA Policy Measure

Figure 11.
Contribution to % Change in Canadian Investment by CKFTA Measure

Table 12.
Korean Sectoral Impacts

Source: Calculations by the authors.
Table 13.
Canadian Sectoral Impacts

Source: Calculations by the authors.
References
- Baldwin, R. 1995. “A Domino Theory of Regionalism,” In Baldwin, R. et al. (eds.) Expanding Membership of the European Union. Cambridge, UK: Cambridge University Press. pp. 25-53.
-
Bruegel Institute. 2014. “Real effective exchange rates for 178 countries: a new database.” <
http://www.bruegel.org/datasets/real-effective-exchange-rates-for-178-countries-a-new-database ></http:> (accessed Nov. 10, 2014) -
Chang, H. J. 2014. “Canada Announces Free Trade Agreement with the Republic of Korea,”
International Business Bulletin , Sept., 2014. - Ciuriak, D. 2008. “Quantifying the Impact of Non-Tariff Measures & Trade Facilitation on Canada-EU Merchandise Trade.” Ottawa: Department of Foreign Affairs and International Trade.
-
Ciuriak, D. 2010. “East Asian FTAs and Their Implications for Economic Welfare and Global Trade: The Domino Theory Revisited,” Working Paper. <
http://dx.doi.org/10.2139/ssrn.1692448 > (accessed Oct. 21, 2014) -
Ciuriak, D. 2012. “Auto Sector Impacts of a Canada-Japan Free Trade Agreement: A Market-Segment-Based Evaluation,” Ciuriak Consulting Working Paper, August. <
http://ssrn.com/abstract=2135321 > (accessed Oct. 21, 2014) - Ciuriak, D. 2014. “The Effect of Diplomatic Representation Abroad on Canada’s Exports,” C. D. Howe Institute E-brief and Technical Paper 16 April.
- Ciuriak, D. and S. Chen. 2008. “Preliminary Assessment of the Economic Impacts of a Canada-Korea Free Trade Agreement,” In Ciuriak, D. (ed.) Trade Policy Research 2007. Ottawa: Department of Foreign Affairs and International Trade. pp. 187-234.
-
Ciuriak, D. and J. Xiao. 2014a. “The Canada-Korea Free Trade Agreement: A First Look at the Numbers,” Working Paper, 20 September. <
http://papers.ssrn.com/sol3/papers.cfm?abstract_id=2491548 > (accessed Oct. 21, 2014) - Ciuriak, D. and J. Xiao. 2014b. “The Trans-Pacific Partnership: Evaluating the ‘Landing Zone’ for Negotiations,” C.D. Howe Institute Technical Paper (forthcoming).
-
Ciuriak, D., Dadkhah, A. and J. Xiao. 2014. “Services Trade Liberalization in the Canada-Korea Free Trade Agreement Revisited,” Working Paper, 17 November. <
http://papers.ssrn.com/sol3/papers.cfm?abstract_id=2539692 > (accessed 28 Oct. 2014) - Dixon, P. B. and M. T. Rimmer. 2002. “Dynamic General Equilibrium Modelling for Forecasting and Policy: A Practical Guide and Documentation of MONASH.” Amsterdam: North-Holland Publishing Company.
- Fouré, J., Bénassy-Quéré, A. and L. Fontagné. 2012. “The Great Shift: Macroeconomic projections for the world economy at the 2050 horizon,” CEPII, WP no. 2012-03.
- Francois, J. F. and L. M. Baughman. 2004. “U.S.-Canadian Trade and U.S. State-Level Production and Employment,” In Curtis, J. M. and D. C. Ciuriak. (eds.) Trade Policy Research 2004. Ottawa: Department of Foreign Affairs and International Trade. pp. 265-282.
- Gilbert, J. P. 2004. “GTAP Model Analysis: Simulating the Effect of a Korea-U.S. FTA Using Computable General Equilibrium Techniques,” In Choi, I. and J. J. Schott. (eds.) Free Trade Between Korea and the United States?. Washington DC: Institute for International Economics. Appendix B, pp. 89-118.
-
Goldman, J. I. and L. A. Murray. 2014. “Canada-Korea Free Trade Agreement: Breakthrough in Asian Trade.”
BennettJones.com . - Government of Canada. 2014. Canada-Korea Free Trade Agreement: Creating Jobs and Opportunities for Canadians: Final Agreement Summary. Ottawa: Government of Canada.
- Hertel, T. W. ed. 1997. Global Trade Analysis: Modeling and Applications. Cambridge, UK: Cambridge University Press.
- Hertel, T., Hummels, D., Ivanic, M. and R. Keeney. 2003. “How Confident Can We Be in CGE-Based Assessments of Free Trade Agreements?,” GTAP Working Paper 26.
-
International Monetary Fund. October 2014. “World Economic Outlook Database.” <
http://www.imf.org/external/pubs/ft/weo/2014/02/weodata/index.aspx > (accessed Oct. 21, 2014) -
International Trade Centre. 2014. “Trade Map.” <
http://www.trademap.org/canada/Index.aspx > (accessed Oct. 21, 2014) -
Kanargelidis, G., Millen, R. and Z. Silver. 2014. “Canada: Opening The Asia-Pacific Gateway: Canada-Korea Free Trade Agreement.”
Mondaq.com . - Keck, A. and A. Lendle. 2012. “New evidence on preference utilization,” WTO Staff Working Paper ERSD-2012-12.
-
Kee, H. L., Nicita, A. and M. Olarreaga. 2008. “Import Demand Elasticities and Trade Distortions,”
Review of Economics and Statistics , vol. 90, no. 4, pp. 666-682.
-
Kee, H. L., Nicita, A. and M. Olarreaga. 2009. “Estimating trade restrictiveness indices,”
Economic Journal , vol. 119, no. 534, pp. 172-199.
- Kneller, R., Upward, R. and P. Wright. 2010. A study of the impact of exporting on service traders: Final Report. UK: Leverhulme Centre for Research on Globalisation and Economic Policy, School of Economics, University of Nottingham.
-
Lee, J. 2013. “Chaebol Almighty.” Queen’s Business Review Blog. <
http://www.qbreview.org/chaebol-almighty-2 > (accessed Aug. 20, 2014) - Moody’s. 2014. “Moody’s: Korea’s economic fundamentals remain strong, despite challenges,” Press Release. (June 9, 2014)
- Murillo, D. and Y. Sung. 2013. “Understanding Korean Capitalism: Chaebols and their Corporate Governance,” ESADEgeo Center for Global Economy and Geopolitics Position Paper 33.
- Nye, J. 2014. “A Look at the Recovery of the Canadian Auto Sector since the 2008-09 Recession,” Current Analysis, May 2014, RBC Economics.
-
OECD. 2014. “OECD National Accounts Statistics.” <
http://www.oecd-ilibrary.org/economics/data/oecd-national-accounts-statistics_na-data-en > (accessed Oct. 21, 2014) - Petri, P. A., Plummer, M. G. and F. Zhai. 2011, updated 2013. “The Trans-Pacific Partnership and Asia-Pacific Integration: A Quantitative Assessment,” East-West Center Working Paper, no. 119.
- Republic of Korea, Ministry of Foreign Affairs. 2007. “The 10th Round of Korea-Canada Free Trade Agreement Negotiations To be Held,” MOFA. (April 24, 2007)
- Sosnow, C. 2014. “Canada and South Korea Conclude Landmark Free Trade Agreement,” International Trade & Customs Law Bulletin, March 13, Fasken Martineau.
- The Economist, Intelligence Unit. 2014. Country Report South Korea, Canada 2014, (March).
- UNCTAD. 2014. World Investment Report 2014: Investing in the SDGs: An Action Plan. New York and Geneva: United Nations.
- USDA Foreign Agricultural Service. 2013. “Republic of Korea Oilseeds and Product Annual 2013,” GAIN Report KS1315. (March 5, 2013)
- USITC. 2007. “U.S.-Korea Free Trade Agreement: Potential Economy-wide and Selected Sectoral Effects,” Investigation TA-2104-24, USITC Publication 3949.
- Witt, M. A. 2014. “South Korea: Plutocratic State-Led Capitalism Reconfiguring,” In Witt, M. and G. Redding (eds.) The Oxford Handbook of Asian Business Systems. Oxford: Oxford University Press. pp. 216-237.
-
WTO. 2014. “Trade Profiles.” <
http://stat.wto.org/CountryProfile/WSDBCountryPFHome.aspx?Language=E > (accessed Oct. 21, 2014)