

- EAER>
- Journal Archive>
- Contents>
- articleView
Contents
Citation
| No | Title |
|---|
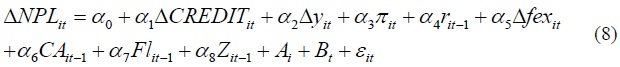
Article View
East Asian Economic Review Vol. 20, No. 3, 2016. pp. 391-423.
DOI https://dx.doi.org/10.11644/KIEP.EAER.2016.20.3.315
Number of citation : 0View
748
Download
371
Study on the Impact of the Private Credit Excess on the Credit Risk under the Massive Capital Inflows
|
|
Chonbuk National University |
|---|

Abstract
By examining the relationship between private credit growth and the possibility of credit risk while focusing on international capital in 21 countries over the period 2000:1Q-2015:2Q, this paper shows that the impact of private credit growth on credit risk is apparent under the high ratio of capital inflows, and its impact on credit risk in the seven Asian countries is even stronger. And the possibility of credit risk caused by private credit is mainly coming from portfolio inflows rather than direct inflows. Finally, portfolio inflows strengthen the positive relationship between credit excess and credit risk in Asian countries, and this trend is seen more in these after the global financial crisis. Taken together, the stronger positive relationship between credit excess and credit risk can be strengthen under the massive portfolio inflows in particular in the seven Asian countries such as Hong Kong, India, Indonesia, Korea, Malaysia, Singapore, and Thailand.
JEL classification: G10, G21
Keywords
Private Credit Excess, Capital Flows, Credit Risk
I. INTRODUCTION
One of the major structural changes in financial systems in recent decades has been the rapid growth in international financial integration (Lane and Milesi-Ferretti, 2007). Moreover, as emphasized by Lane and Milesi-Ferretti (2008), there is a strongly positive relation between the size of domestic financial systems and the scale of cross-border financial positions.
The recent Global Financial Crisis which originated in US credit markets, spread rapidly across borders, and highlighted that the high level of international economic integration and financial interdependence now characterizes the global economy. Two of the key contributory factors in spreading the crisis were the domestic balance sheet problems associated with rapid credit growth, and the excessive external imbalances associated with excessive international capital flows (Lane and McQuade, 2014).
Private credit, that is, Domestic credit to private sector refers to financial resources provided to the private sector by financial corporations, such as through loans, purchases of nonequity securities, and trade credits and other accounts receivable, that establish a claim for repayment.1 The Private Credit-to-GDP ratio could have both a positive and a negative interpretation, since it represents both the level of financial development and the aggregate private sector’s indebtness.
Credit growth when it is abnormally rapid (credit booms), has come to the fore of academic and policy debate in the aftermath of the global financial crisis of 2008. Credit growth is often associated with financial deepening and beneficial to long-term economic growth (Levine, 1997). However, on the other hand, it is also closely related to boom-bust cycles and financial crises (Schularick and Taylor, 2012).
The crisis has thus led to a renewed interest in understanding the linkages between credit, international capital flows and the real economy. In particular, the extent of interaction between international capital flows and macro-financial stability is an important topic of debate which is still unsettled (Kose et al. 2009).
Capital flows act as a transmission channel of risks across borders and thus may lead to the build-up of financial sector imbalances. A significant cause of the rapid recuperation in credits in emerging markets is the surge in direct or indirect cross-border capital flows to these economies. The direct channel refers to the credits extended to the domestic private agents by foreign financial institutions. The indirect channel describes an intermediary, usually a bank, rising wholesale funding from abroad and then lending to local customers. Both channels functioned well for emerging markets in the aftermath of the crisis due to the permissive global financial conditions, raising concerns for domestic authorities.
Azis and Shin (2015) describe three recent phases of global liquidity for emerging Asia. The first phase is the period leading up to the 2008/2009 global financial crisis and the immediate aftermath of the September 2008 Lehman Brothers collapse. This phase is marked by an expansion in global banking and the transmission of financial conditions across borders through capital flows-intermediated by the global banking system. The second phase of global liquidity begins roughly in 2010, when several central banks in advanced economies began using quantitative easing (QE) and asset purchase policies. In emerging Asia, the result was the rapid growth of credit markets. Credit expanded through corporate bond markets open to international investors, both in local currencies and in those of advanced economies, particularly the US dollar. The May 2013 so-called taper tantrum-after the US Federal Reserve (US Fed) announced its intention to taper QE-and the financial squall that followed in emerging markets is the third phase of global liquidity. Large capital outflows from emerging Asia were linked to the impending end of easy money
And out of three phases, in phase two, the massive amount of inflows into emerging markets saw credit grow through corporate bond issuance by nonfinancial borrowers.
On this wise, capital inflows are often considered to be a driver of credit growth and a trigger for credit booms (Hernandez and Landerretche, 1999; Sa, 2006; Mendoza and Terrones, 2012; Lane and Mcquade, 2014). However, the existing empirical studies have not yet exploited the more granular data that could help us understand better which way the causality actually runs.
In this regard, we study the interaction between international capital flows and domestic credit growth using a large cross-country panel dataset which includes both developed and developing economies.
In this paper, we compile a panel dataset for 21 countries covering the period 2000-2015 and show exploratory evidence on the relationship between capital inflows and credit growth. We not only break down capital inflows into different categories to find out whether the composition of capital inflows matters, but also examine credit growth by sectors (namely, private and public sector) to detect whether there is any heterogeneity in the role of capital inflows for credit provided to different sectors.
Moreover, we provide additional evidence on the channels through which capital inflows would relate to the possibility of credit risk through the excessive credit growth. In particular, we inspect whether and how the capital inflows enhance the linkages between credit growth and credit risk.
1)For some countries these claims include credit to public enterprises.
II. LITERATURE REVIEW
Credit growth has attracted a great deal of attention in several regions of the world in recent years. The Asian crisis of the late 1990s (affecting mainly Indonesia, Korea, Malaysia, and Thailand) heightened awareness of the risks of rapid lending growth to the private sector, as did crises in several Latin American countries (Argentina, Brazil, Mexico, and Uruguay). In the early 2000s there was focus on the rapidly growing economies of Eastern Europe where new private sector credit markets had grown over a period of a few years. More recently the expansion of credit in the industrial world has come under scrutiny as weaknesses associated with retail lending have emerged (Crowley, 2008).
In particular, net capital flows and domestic credit growth have been separately identified as important sources of macroeconomic imbalances, such that it is highly relevant to understand any inter-connections between these variables
Traditional literature classifies the determinants of capital flows into two categories: external factors, i.e. common factors that push capital flows towards countries, and domestic factors that attract capital flows into the countries (Fernandez-Arias, 1996). If capital inflows are determined by internal factors, improving economic policies in the countries are a crucial condition for stable development. By contrast, if capital inflows are determined by external factors, flows are highly unstable and the countries are subjected to the evolution of macro and financial conditions in developed countries and investor sentiment, translating to a source of fragility.
Two main transmission channels between capital inflows and a higher risk of financial crisis might be distinguished.
Firstly, as far as the current account is concerned, capital inflows, especially if they are large and debt-generating, provoke a real appreciation of the currency, a loss in competitiveness and a growing trade deficit, as well as an increase in payments in the investment income account. Both effects culminate in a substantial increase in the current account deficit. Secondly, as regards to the financial account, capital inflows, as a result of their important volume and of their structure promote a credit boom channeled to activities that increase credit risk, and an increase in external debt, mainly with short-term maturities, and a growing vulnerability to an eventual reversal in capital flows (McKinnon and Pill, 1999).
The importance of these twin factors raises the question of whether there are important interactions between domestic credit growth and international capital flows. If these variables are jointly determined and/or interact in economically-interesting ways, this should frame the analytical framework guiding theoretical and policy analysis. Along one dimension, it would indicate that international capital flows should be a central theme in the rapidly-growing macro prudential literature that seeks to understand the dynamics of domestic credit growth (and the associated risk factors). Along another dimension, it would indicate the domestic credit channel is a key channel in understanding the relation between international capital flows and domestic macroeconomic and financial variables.
In terms of related literature, there is a sizeable body of work on the macroeconomic effects of credit booms (Mendoza and Terrones, 2012). In related fashion, there is considerable evidence that financial crises are often preceded by domestic credit booms (Jorda et al., 2011, Schularick and Taylor, 2012, Gourinchas and Obstfeld, 2012).
More specifically, Mendoza and Terrones (2012) also find that credit booms are typically associated with net capital inflows. However, that study does not differentiate between net debt flows and net equity flows. Moreover, it only considers credit booms rather than also investigating the behavior of capital flows during periods of low (or even negative) domestic credit growth. In a recent contribution, Calderon and Kubota (2012) examine a large sample of countries over 1975:Q1 to 2010:Q4 and find that surges in gross debt inflows are a good predictor of subsequent credit booms, which is a pattern consistent with the results in this paper.
Rapid growth in bank credit to the private sector is a common factor associated with banking crises (Demirgüc-Kunt and Detragiache 1997, Kaminsky, Lizondo, and Reinhart 1998, and Kaminsky and Reinhart 1999). In fact, the IMF (2004) estimates that about 75 percent of credit booms in emerging markets end in banking crises. Typically, credit expansions are fueled by overly optimistic expectations of future income and asset prices, combined with financial liberalization and capital inflows. Over time, households and firms accumulate substantial debt while income does not keep pace. A decline in income or asset prices then leads to an increase in non-performing loans and defaults. If the problem is severe, the country experiences a banking crisis.
More recently, several studies (Borio and Drehmann, 2009; Jorda, Schularick and Taylor, 2011; Gourinchas and Obstfeld, 2012) confirm that large increases in private domestic credit are among the most robust pre-cursors of banking crises both in advanced economies and emerging economies over long periods of time, including the recent crisis. For both emerging economies, such booms are often accompanied by real exchange rate appreciation, and banking crises may lead to and be aggravated by currency crises (Kaminsky and Reinhart, 1999; Mishkin, 1999). Mendoza and Yue (2012) introduce financial frictions in a sovereign-default model, with the objective of reconciling default and business-cycle stylized facts in emerging economies. And a variety of other papers has focused on default, but as a result of a self-fulfilling crisis, such as Lorenzoni and Werning (2013). Reinhart and Rogoff (2011) conduct empirical studies to uncover the relationship between sovereign debt and banking crisis.
On this wise, domestic credit growth is surely a key mechanism linking capital flows and credit risk, but this channel is not directly studied. In other words, despite the importance of private credit risk in the financial markets, relatively little research about the sources of commonality has appeared in the literature. Previous theoretical work focuses primarily on the incentives faced by private debtors to repay their debt.
This paper is closely related to a range of papers that specifically discuss the role of capital inflows. Hernandez and Landerretche (1999) provide supporting evidence that surges in capital inflows tend to finance a credit boom. Sa (2006) examines the role of capital inflows in credit expansion in 27 emerging countries during 2002-2006 and fails to find a clear-cut causal relationship between capital inflows and credit booms. Mendoza and Terrones (2012) find that credit booms often follow surges in capital inflows. Lane and Mcquade (2014) point out that domestic credit growth in European countries is strongly related to net debt inflows but not to net equity inflows.
This paper contributes in three aspects. First, differing from Hernandez and Landerretche (1999), Sa (2006), and Mendoza and Terrones (2012), we provide a more granular analysis of credit excess and credit risk by distinguishing the credit growth into private and public sector. Secondly, we provide a clear analysis of capital inflows and credit excess by breaking down capital inflows into direct and portfolio inflows. Third, differing from Lane and Mcquade (2014), this paper studies the role of capital inflows from the diverse impact of different kinds of capital inflows. The evidence about the role of capital inflows sheds more light on the linkage between credit excess and credit risk.
III. DATA AND MODEL
The main object of this paper is to explore the following testable hypotheses. We consider a simple frame work whereby both private credit and international capital flows can lead to credit risk.
The first hypothesis we want to test can be roughly related to private credit excess, and specifically the impact of private credit on the possibility of credit risk. After considering the impact of private credit on credit risk, a next step is to look at the actual capital inflows to the possibility of credit risk. And a third hypothesis tests the significance of interaction between private credit and capital inflows to the credit risk. A final hypothesis-testable in the TSLS regression-is related to find out the channel of capital inflows which can strengthen the relationship between private credit excess and credit risk.
To test our hypotheses, this paper is carried out using a panel dataset covering 21 countries over the period 2000:1Q-2015:2Q. The choice of both the number of countries and cut-off dates has been dictated by data availability. In addition, this paper classifies the 21 countries into three groups to test the impact of cash flows on the relationship between private credit and credit risk. To conduct an analysis, this paper utilizes data from seven advanced countries (G7)-Canada, France, Germany, Italy, Japan, U.K., and U.S.-and two groups of emerging markets. The first group of emerging markets is coming from seven countries of central and southern America and eastern Europe-Argentina, Brazil, Mexico, Czech Republic, Hungary, Poland, and Russia, the second group which we have an interest is composed by seven countries of Asia-Hong Kong, India, Indonesia, Korea, Malaysia, Singapore, and Thailand.
Firstly, G7 countries were chosen because reflation policies for boosting sagging economies after financial crisis were carried out in these nations. As for the emerging economies, such countries are considered in the sample because they illustrate well the effect of the developed economies’ recent unconventional policies on emerging economies. And in order to check the possibility of a different impact of capital inflows among emerging economies, this paper classifies the emerging nations into two groups.
The factors used in our empirical analysis are level of non performing loans as a share of gross loans, private and public credit by depository banks as a share of GDP, capital inflows as a share of GDP which is explained by the inflows of portfolio investment and direct investment as a share of GDP, following Fratzscher (2012), economic growth, inflation, market interest rate, exchange rate appreciation, and current account balance as a share of GDP. In addition, z-score bank stability, financial liberalization which is formulated by Chinn and Ito (2008) are included. In case of two factors such as financial liberalization and Bank z-score are available in annual frequency. Thus, we applied the data from annually to quarter frequency. And in case of two periods, that is 2015:1Q and 2Q, because there is no data for 2015 yet, we applied the data of 2014 into theses two quarters.
The data of quarterly gross capital flows, non performing loans data, and private and public credit combines from BIS’s database and International Financial Statistics (IFS) from an International Monetary Fund (IMF) database. Z-score bank stability is available in World Bank Financial Development and Structure Dataset. The World Development Indicators, a World Bank database of economic and demographic indicators, and IMF’s Balance of Payments (BOP) were used as a primary source for selected macroeconomic indicators used as control variables.
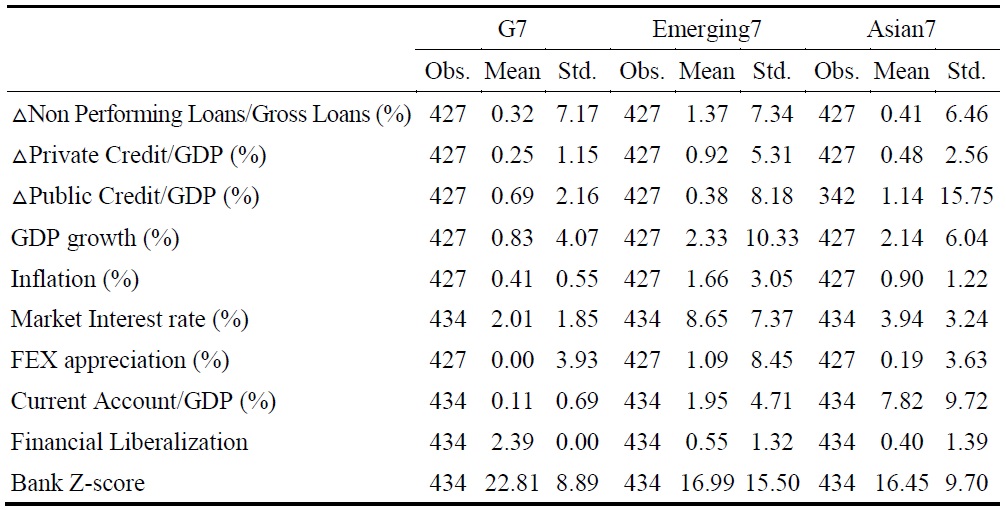
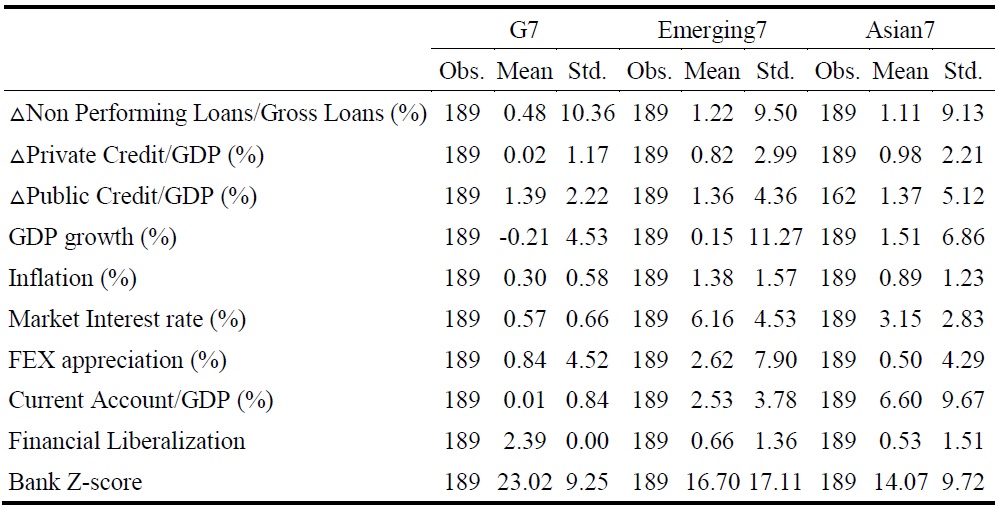
Table 1 below reports the descriptive statistics of the variables.
The growth rate of non performing loans as a share of gross loans which is used as a proxy for credit risk is relatively high (1.37%) in the group of seven emerging countries. In case of the group of seven Asian countries, it is about 0.41%. The growth rate of private credit ratio held by depository banks as a share of GDP is also high in the group of seven emerging countries. In case of the group of G7 countries and seven Asian countries, public credit ratio held by depository banks as a share of GDP is relatively higher than the ratio of the growth rate of private credit. And as expected, the level of financial liberalization and z-score bank stability very high in G7 countries.
As mentioned previously, in response to the global financial crisis, QE policies have been actively pursued by major developed countries, and foreign capital inflow to developing economies induced by QE increases. Hence, this paper classifies the entire sample to distinguish the global financial crisis in 2008 and 2009. In this paper, we focus on the time of September, 2008, which is the time of the bankruptcy of Lehman Brothers Holdings, therefore, dummies are given for each country from the time of the third quarter of 2008 among the entire sample period.
Table 2 shows the summary statistics of the countries for the time of the global financial crisis
An even meaningful interpretation can be seen by comparing the results. Most notably, there is not so great difference in the possibility of credit risk (non performing loans as a share of gross loans) between emerging countries and Asian countries in the post crisis. However, compared to the entire sample period (Table 1 and 2), the growth rate of non performing loans as a share of gross loans in the seven Asian countries greatly increases after the crisis from 0.41% to 1.11%, while it decreases from 1.37% to 1.22% in emerging countries.
In addition, the growth rate of private credit ratio held by depository banks as a share of GDP also increases in this group. Finally, in terms of Chin-Ito’s Financial Openness Index, it increases after the financial crisis in emerging and Asian countries, while the z-score bank stability decreases in these two groups.
Figure 1 below explains the trends from credit risk and private credit growth.
Notably, the possibility of credit risk is relatively high in the seven Asian countries, and its volatility increased after the global financial crisis. More specifically, the growth of private credit in Asian countries significantly increased after the crisis.
What factors account for these differences in different groups? The possible candidates are very diverse lot and difficult to demonstrate conclusively.
However, as it mentioned earlier from the study of Azis and Shin (2015), in post crisis, several central banks in advanced economies began using quantitative easing (QE) and asset purchase policies, and from this result, there was the rapid growth of credit markets in emerging Asia. Such an unconventional monetary policy in developed economies affects on the economy of Asian countries through capital movement. And we can think the difference in current account balance, the degree of currency devaluation, and capital control. The countries with a large current account surplus, greater currency devaluation, and stricter capital control are likely to be less affected by advanced economies’ unconventional monetary policies, because it is difficult for such countries to experience massive capital inflows.
The central question of this paper is to explore whether private credit affects credit risk, and if this effect depends on the degree of capital inflows. Therefore, to further elaborate on the results, we need to check the relationship between private credit and the possibility of credit risk at first.
In order to measure this, we need to start from a simple baseline equation which explained the credit lending channel as develop by Stein (1998), and Ehrmann et al. (2003).
Demand for credit of an individual bank  depends on central bank interest rate (

Supply of credit of an individual bank  depends on deposit funds availability (

The important factor of equation (2) is non-deposit funds availability (

Deposit sources (

Equilibrium on credit market can be written as

Reduced from equation being:

If simplified, equation writes as

In this equation, if excess credit from capital inflows happens, then  And monetary shock (
For example, let’s assume that Banks have three types of assets: bank loans to non financial business, household mortgages, and reserves. And their liabilities are bonds, deposits, and equity. If we assume there are no changes in their domestic bonds, reserve or equity (although each of these are likely to be affected), and if there is a massive capital inflows to the economy, banks then reduce their lending to non financial firms and attract foreign liabilities. They maintain their loan books by expanding mortgage lending to households. From this result, their asset of house hold mortgages increases while their foreign liabilities also increase. It can be one of main factor which explains the relationship between capital inflows and domestic credit growth.
Thus, in order to measure the relationship between private credit and the possibility of credit risk at first, we modify the standard model of equation (7), and construct panel equation below for the regression analysis.
Here, △
Based on the theory, credit risk is influenced by a number of domestic macroeconomic variables. Hence, this paper includes the vector of domestic factors such as GDP growth (△
△
In addition, two explanatory variables are included, that is, z-score bank stability (
More specifically, in order to reduce potential problems associated with endogeneity, we conduct panel data regressions. Country (
In equation (8), if private (public) credit growth turns out to have positively significant effect on the possibility of credit risk, the estimated coefficient
Next question, then, is what effects do the capital inflows on the relationship between private (or public) credit growth and credit risk? In order to measure this, this paper extends the baseline specification, that is, equation (8), and allow for linear interaction effects.

Here,
It is very important to decide between gross capital inflows and net capital inflows as a proxy for capital movement. Prior literature has employed different proxies for capital movement. For example, Smith and Valderrama (2007), Byrne and Fiess (2011), and Forbes and Warnock (2011) use gross capital inflows, but Ghosh et al. (2014), Ahmed and Zlate (2013) and Fratzscher, Duca, and Straub (2012) apply net capital inflows. This may be due to the fundamental difference between the two concepts and the focus of each research; using gross capital inflows focuses on the actions of nonresident investors only while net capital inflows consider the action of domestic residents in foreign markets as well.
As a proxy for capital movement, this paper utilizes the outflows or inflows of portfolio investment and other investment as a share of GDP, following Fratzscher (2012). Portfolio investment includes portfolio investment, equity securities, liabilities, debt securities and liabilities, while other investment includes foreign direct investment in reporting economy (inflows) (Smith and Valderrama 2007). And, there is another large scale of portion in the concept of capital flows, that is, direct investment.
A different relationship exists between the counterparties for portfolio investors compared with direct investors. Direct investment is related to control or a significant degree of influence, and tends to be associated with a lasting relationship. As well as funds, direct investors may supply additional contributions such as know-how, technology, management, and marketing. Furthermore, enterprises in a direct investment relationship are more likely to trade with and finance each other. In contrast to direct investors, portfolio investors typically have less of a role in the decision making of the enterprise with potentially important implications for future flows and for the volatility of the price and volume of positions. Portfolio investment differs from other investment in that it provides a direct way to access financial markets, and thus it can provide liquidity and flexibility. It is associated with financial markets and with their specialized service providers, such as exchanges, dealers, and regulators.
From this reason, this paper uses the concept of total capital inflows as the sum of portfolio inflows and direct inflows and it classifies the concept of total capital inflows in two parts, that is, portfolio inflows and direct inflows, and more specifically, it has more interest in portfolio inflows as a proxy of capital inflows.
The interaction term (△
In that case, to what extent can credit risk, which is positively affected by private (or public) credit growth, be strengthened (or weakened) through capital inflows? That is to say, we need to find out the channel of capital inflows which can strengthen (or weaken) the relationship between private credit excess and credit risk.
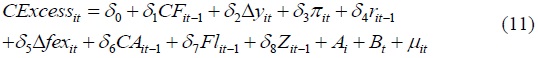
In order to capture this, this paper directly needs to measure the degree of bank credit excess at first. Bank credit excess can be characterized by a banking instability. To quantify bank credit excess, it builds on the ideas of Eichengreen, Rose and Wyploz (1995) and Von Hagan and Ho (2007). Using quarterly time series data, it computes deseasonalised growth rate of private (or public) credit, namely credit extended to the private (or public) sector, and then it computes an index of bank credit excess. The index of bank credit excess is given by the formula:

Here, △
After measuring the index of bank credit excess, this paper extends the baseline specification, and the following TSLS model is devised to estimate the relationship.
1st step (OLS):
2nd step (TSLS):
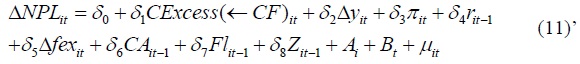
The method of Two-Stage Least Squares (TSLS) is useful to find out a channel how a variable has impact on a specific relationship between other two variables (dependent and explanatory variables). It uses two steps (stages). In the first step, OLS is performed to estimate the indirect relationship between the channel variable and the explanatory variable. And in the second step, TSLS is performed to estimate the direct impact of the channel variable on the relationship between dependent and explanatory variable by using the channel variable as instrument variable.
Thus, equation (11)’ is a standard IV equation, in which the index of bank instability, that is, credit excess is instrumented for with a capital inflows variable. The first step is represented by the effect of portfolio inflows on the excess credit. And second step is represented by the dynamics of non performing loans, given that portfolio inflows has a direct proportional effect on the quality of bank portfolios.
That is to say, it provides estimates for the instrumented impact of the credit excess on credit risk. It estimates the effect of credit excess on the possibility of credit risk when it is affected by capital inflows, thus exerting positive influence on credit risk, so the sign of the coefficient estimate of
2)
IV. EMPIRICAL RESULTS
1. Cross-sectional Analysis
We begin with the results of panel regression for credit risk of equation (8). Table 3 below shows the results of these estimations.
Firstly, this paper classified total credit in our full sample into two parts, one thing is private credit and the other thing is public credit. Columns (1), (2) and (3) of Table 3 show the results of the relationship between private credit growth and credit risk.
When we classify the full sample into the three different groups, it exhibits entirely different patterns. In terms of emerging and Asian countries, private credit growth turns out to have a positively significant effect on credit risk (columns (2) and (3)). However, for the countries of G7, it shows statistically weak (columns (1)). In case of the possibility of credit risk, it only increased in the seven Asian countries after the global financial crisis (crisis dummy). From this result, we can find that higher private credit growth can lead to higher vulnerability to credit risk in these countries after the crisis (interaction term of (1)×(3) in columns (3)).
Columns (4), (5) and (6) of Table 3 show the results of the relationship between public credit growth and credit risk. We can’t find any significant impact of public credit growth on the possibility of credit risk. Such tendency is similar after the global financial crisis. Hence we know that private credit growth is a determinant of the possibility of credit risk.
The signs of the control variables turn out to be generally reasonable, but they are statistically strong or weak on in case of each different group. In case of domestic economic factor, GDP growth and inflation have a positive impact on credit risk, and market interest rate has a negative impact on it. In case of external economic sector, current account balance has a negative relationship with credit risk. It means that the countries with relatively high ratio of current account deficit can be lead to a high possibility of credit risk. The variables in policy sector show statistically strong impact on credit risk. Financial liberalization strongly positive affects credit risk. However, bank stability (z-score) turns out to have a negatively significant effect on credit risk.
The next question, then, what effects do the capital inflows have on the possibility of credit risk in different groups? In order to measure this, this paper investigates that a high private credit growth with higher capital inflows can lead to higher vulnerability to credit excess. As mentioned previously, this paper utilizes the inflows of portfolio investment and direct investment as a share of GDP as a proxy for capital inflows respectively.
Figure 2 below explains the of net capital inflows in each country which is the sum of portfolio inflows and direct inflows.
The volatility of net capital inflows of G7 countries changes not so significantly in entire sample period. However, its volatility of emerging and Asian countries is significantly high. Out of these two groups, the level of the seven Asian countries is relatively higher, and it significantly increases after the global financial crisis.
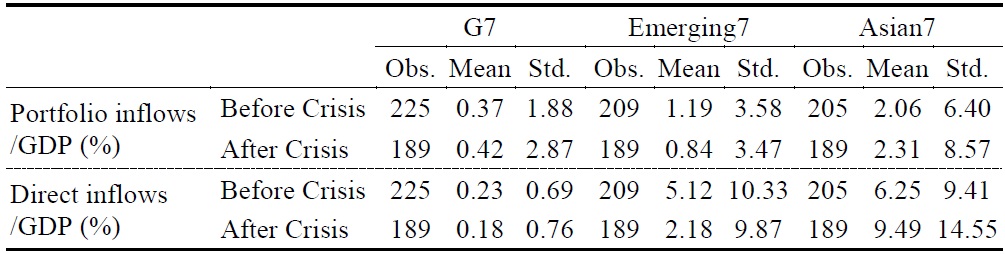
Table 4 reports the estimation result of average capital inflows in three different groups.
In terms of the (average quarterly) portfolio capital inflows increase in G7 and Asian countries after the crisis, but the range of Asian countries is very high from 2.06% to 2.31%. Similarly, the size of direct capital inflows after the crisis in these countries is very high, and it is almost four-eight times higher than other groups.
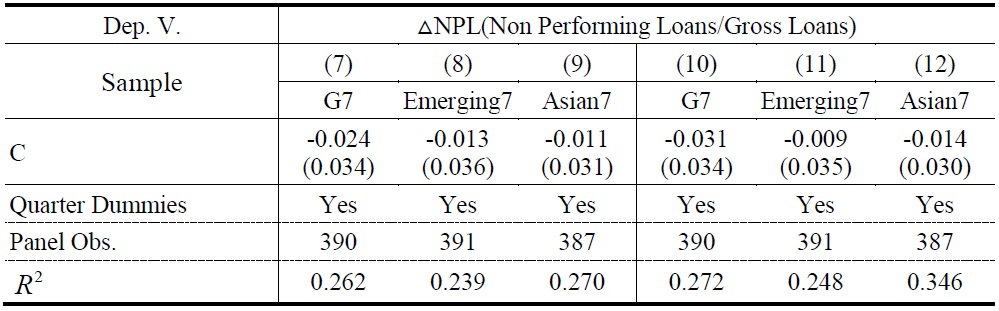
In this circumstance, the next question, then, which types of capital inflows have more significant impact on the relationship between private credit growth and credit risk? Table 5 below shows the results of panel regression of equation (9). It shows the results of estimations for the impact of two different types of capital inflows on the relationship between private credit growth and credit risk.
Columns (7), (8) and (9) of Table 5 show the results of the first type of capital inflows, that is, portfolio inflows. As expected, a high private credit growth with higher portfolio inflows leads to higher vulnerability to credit risk in the seven Asian countries (column (9), (1)×(2)). And we can see that such a trend is much stronger in these countries after the financial crisis from column (9), (1)×(2)×(4), while they are weaker in the countries of G7 and emerging countries (column (7) and (8), interaction terms (1)×(2) and (1)×(2)×(4)).
However, in case of direct inflows which are another type of inflows, we can find different results (Columns (10), (11) and (12)). First of all, it has less impact on the possibility of credit risk in all groups, and such a tendency is similar after the crisis (interaction terms (1)×(3)×(4)). For this reason, we find that a high private credit growth with higher direct inflows has less impact on the possibility of credit risk, and it is founded in every classification.
In summary, the possibility of credit excess caused by private credit growth is mainly coming from portfolio inflows rather than direct inflows.
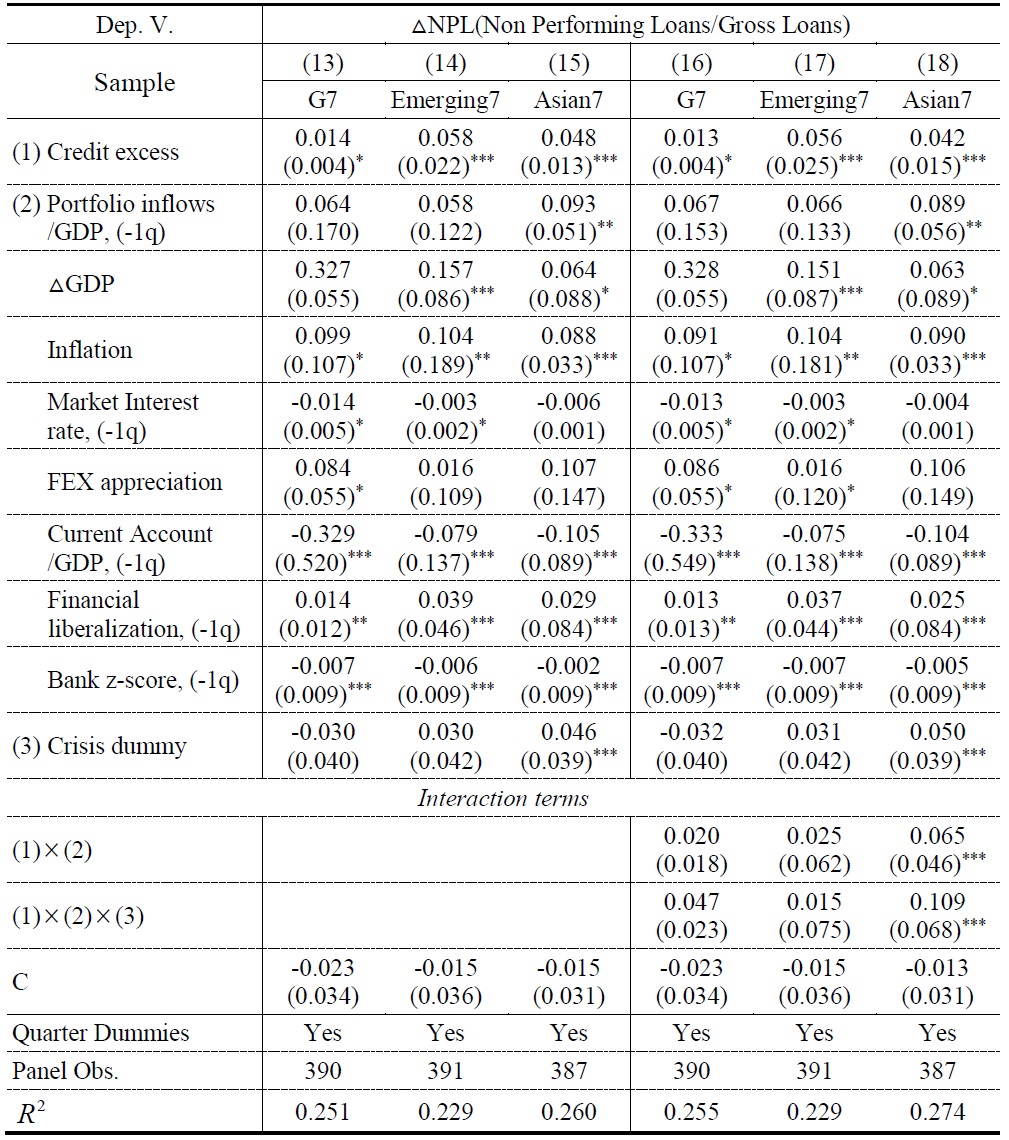
Then, how does a high private credit growth with higher portfolio inflows affect the possibility of credit risk of each group? We now turn to the estimation of the pathway of credit risk. As mentioned previously, in order to measure this, we need to use the index of bank instability which is measured by equation (10). In other words, we consider the bank instability as the proxy of private credit excess to implicate the credit risk from the relationship between private credit growth and portfolio inflows. Table 6 presents the results of our calculations using OLS estimation at first.
Columns (13), (14) and (15) of Table 6 show the results of the relationship between credit excess and credit risk in each group, and columns (16), (17) and (18) of Table 6 show the results of their interactions with crisis dummies. Firstly, we can find that credit excess arouses the credit risk in all groups (columns (13), (14) and (15)). However, we can find the only case that a high credit excess with higher portfolio inflows leads to higher vulnerability to credit risk in the seven Asian countries (column (18), (1)×(2)). And we can see that such a trend is much stronger in these countries after the financial crisis from column (18), (1)×(2)×(4).
The final question is then, to what extent can credit risk, which is positively affected by credit excess, be strengthened through capital inflows? That is to say, we need to find out the channel of capital inflows which can strengthen the relationship between private credit excess and credit risk.
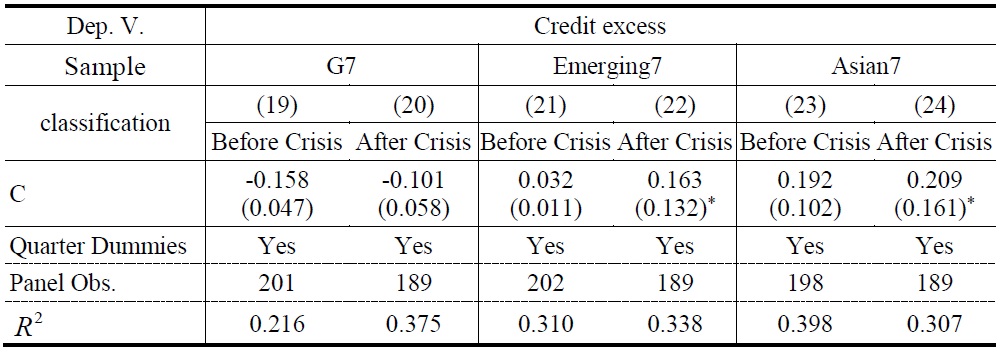
In order to capture this, TSLS of equation (11) and (11)’ are devised to estimate the relationship. That is to say, it estimates the effect that private credit excess has on the possibility of credit risk when it is affected by portfolio inflows here. Table 7 below shows the results of the 1st step of TSLS estimate.
In general, portfolio inflows show statistically weak on credit excess except for the case of Asian countries. There is only marginal significance at the 10% level for emerging 7 countries after the crisis as shown in column (22). For the Asian countries however, credit excess under portfolio inflows rather increasing as shown in columns (23) and (24). More specifically, the positive relationship between portfolio inflows and credit excess is much stronger in Asian countries after the financial crisis.
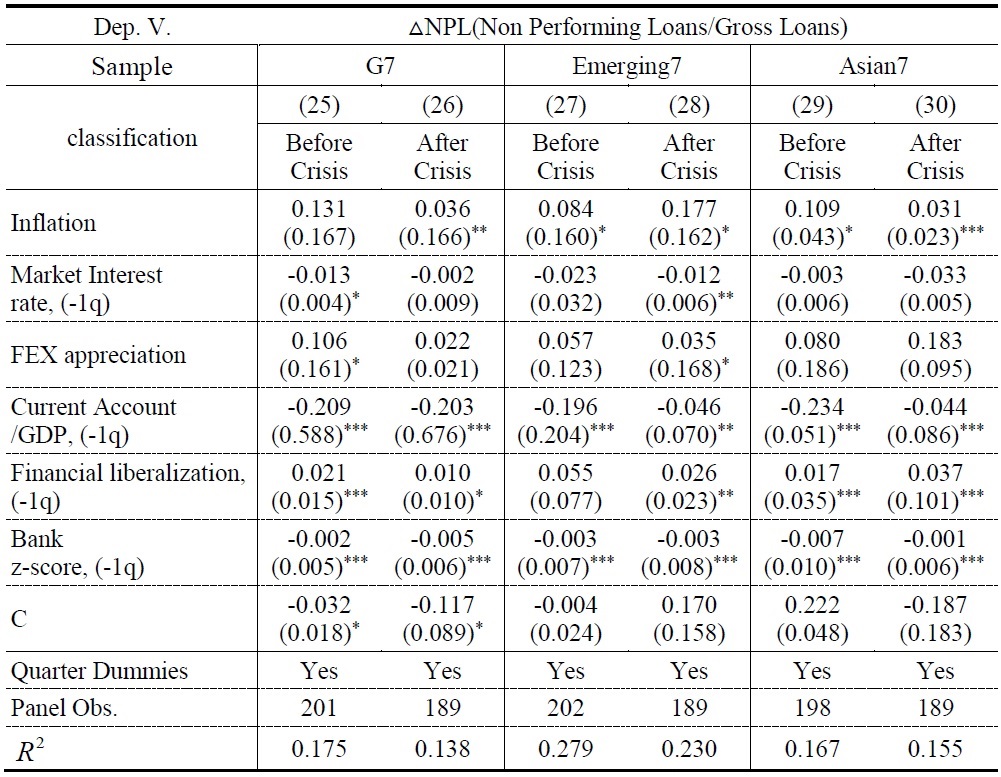
Under this circumstance, in order to capture the channel of portfolio inflows which can strengthen the relationship between credit excess and credit risk, we use Two-Stage Least Squares using the portfolio inflows as an instrument. Table 8 below shows the results of the 2nd step of TSLS estimate.
An even meaningful interpretation can be seen by comparing the results of the TSLS estimation. Firstly, we can’t find any evidence of such a channel in G7 countries (columns (25) and (26)). However we can find that portfolio inflows strengthen the positive relationship between credit excess and credit risk in Asian countries, and we find that such a trend is seen more in these after the global financial crisis (columns (29) and (30)) than in the seven emerging countries (columns (27) and (28)).
In summary, when we consider the stronger positive relationship between credit excess and credit risk, we find that such trend comes mainly from the strong positive effect of portfolio inflows on credit risk as shown in the table 6 and 7, in particular in the seven Asian countries.
2. Robustness Check
As it mentioned earlier, non performing loans are used a proxy for the possibility of credit risk. Because it represents the deterioration of sovereign risk due to the depreciation of bank loan quality (Moinescu, 2012). However, one can argue that credit risk is ex-ante risk, but non performing loan is ex-post. Hence, we estimate alternative specifications by newly adding the credit default swap (CDS) rate as a proxy of credit risk. And, we also utilize capital inflows as an instrument, and inspect the role of capital inflows on the relationship between excess credit and credit risk (credit default swap rate) by running TSLS regressions. According to the study of Moinescu, 2012, NPL and CDS have strong positive correlation.
Figure 3 below explains the trends from CDS growth.
Comparing to the trend of NPL in Figure 1, there is not so great difference between the growth of NPL and CDS. the possibility of credit risk (CDS) is relatively high in the seven Asian countries, and its volatility increased after the global financial crisis.
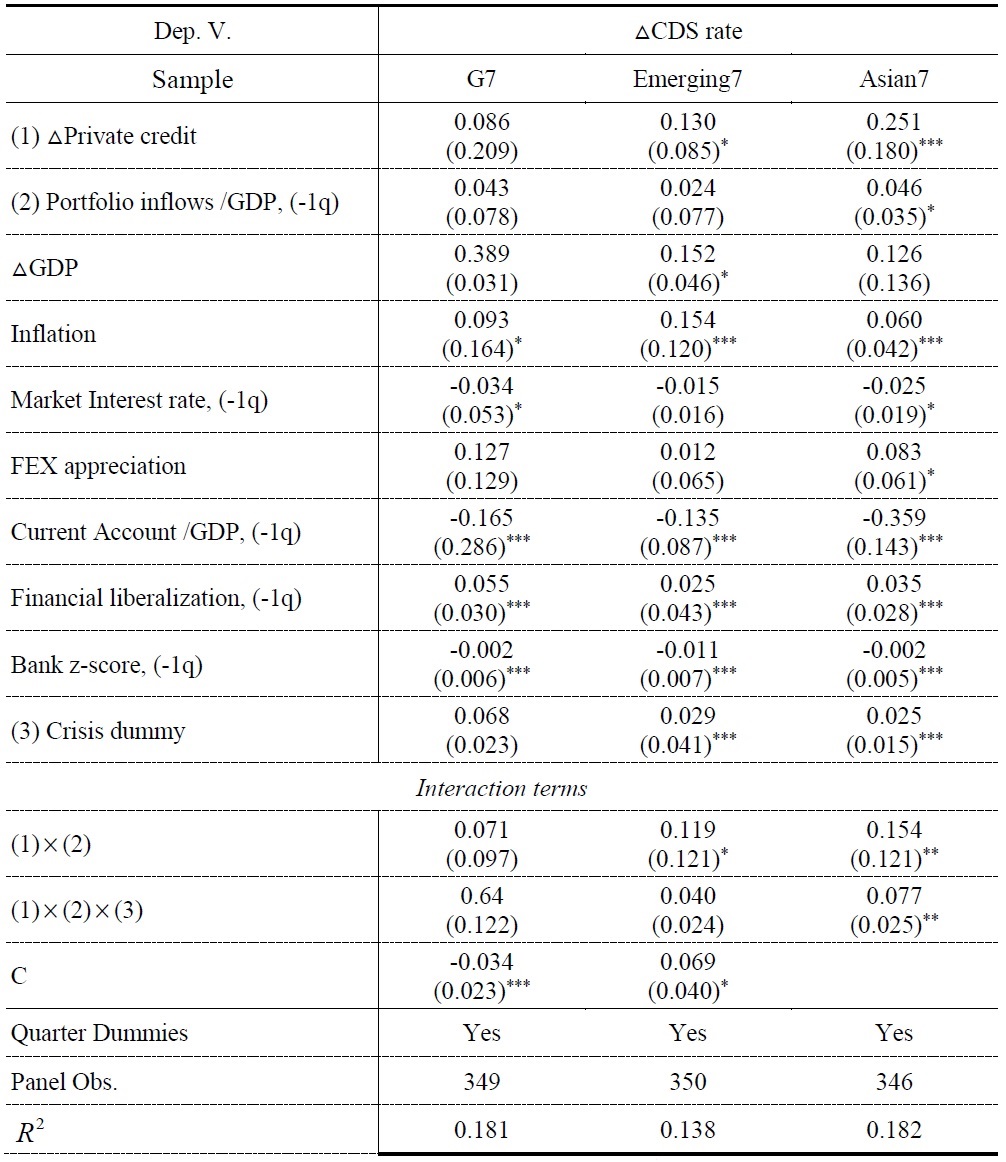
Table 9 below shows the results of panel regression of equation (9) by using the growth of CDS as a dependent variable.
Comparing the results of columns (7), (8) and (9) of Table 5, it has similar results. As expected, a high private credit growth with higher portfolio inflows leads to higher vulnerability to credit risk in the seven Asian countries. And such a trend is much stronger in these countries after the financial crisis, while they are weaker in the countries of G7 and emerging countries.
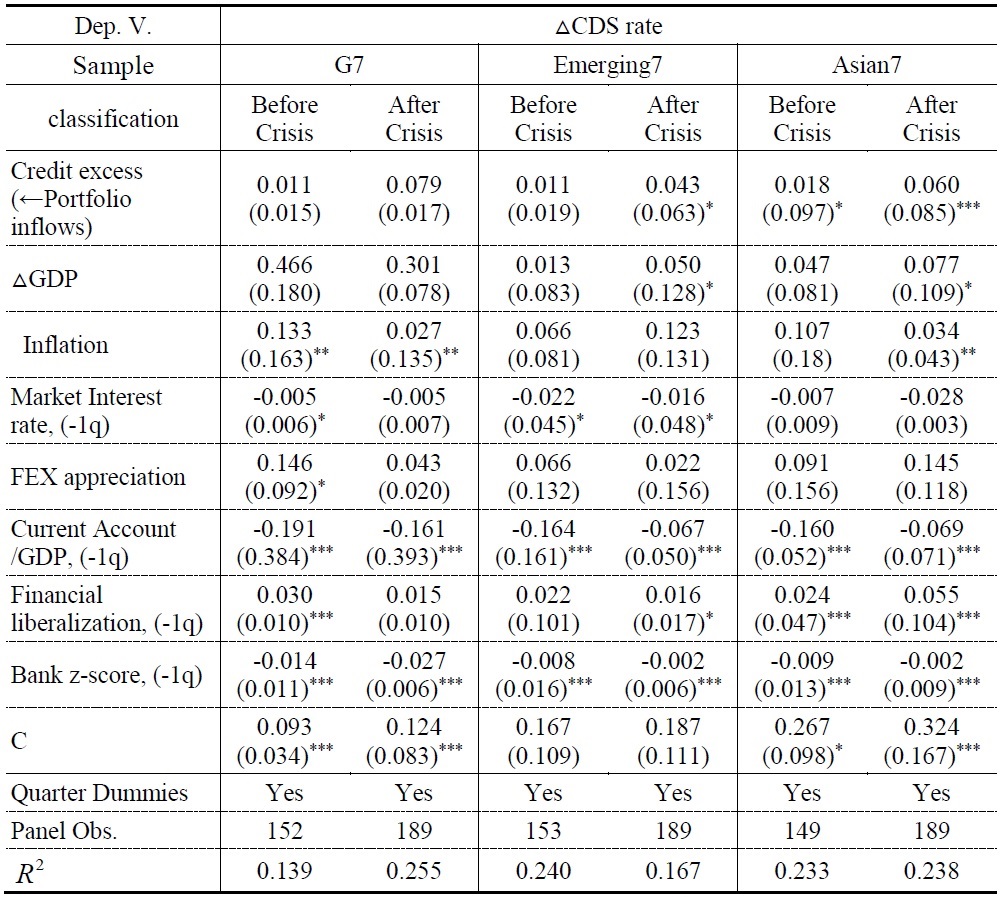
Table 10 below shows the results of the 2nd step of TSLS estimate by using the growth of CDS as a dependent variable.
The results are basically the same with the results of Table 8. The portfolio inflows strengthen the positive relationship between credit excess and credit risk (CDS) in Asian countries, and such a trend is seen more in these after the global financial crisis than in the other groups
V. CONCLUDING REMARKS
In this article, we attempt to show exploratory evidence on the relationship between capital inflows and credit growth. Moreover, we provide additional evidence on the channels through which capital inflows would relate to the possibility of credit risk through the excessive credit growth. In particular, we inspect whether and how the capital inflows enhance the linkages between credit growth and credit risk.
To accomplish this, this paper is carried out using a panel dataset covering 21 countries over the period 2000:1Q-2015:2Q. Additionally, the 21 countries are divided into three groups to test the impact of cash flows on the relationship between private credit growth and credit risk. To conduct an analysis, this paper utilizes data from seven advanced countries (G7), seven countries of central and southern America and another group which we have an interest is composed by seven countries of Asia-Hong Kong, India, Indonesia, Korea, Malaysia, Singapore, and Thailand.
Based on the results of our empirical analysis, we can draw the following three conclusions.
First, in terms of emerging and Asian countries, private credit growth turns out to have a positively significant effect on credit risk. However, for the countries of G7, it shows statistically weak. In case of the possibility of credit risk, it only increased in the seven Asian countries after the global financial crisis. From this result, we can find that higher private credit growth can lead to higher vulnerability to credit risk in these countries after the crisis. In terms of public credit, we can’t find any significant impact of public credit growth on the possibility of credit risk. Such tendency is similar after the global financial crisis.
Second, a high private credit growth with higher portfolio inflows leads to higher vulnerability to credit risk in the seven Asian countries. And such a trend is much stronger in these countries after the financial crisis, while they are weaker in the countries of G7 and emerging countries. However, in case of direct inflows, it has less impact on the possibility of credit risk in all groups, and such a tendency is similar after the crisis. For this reason, we find that the possibility of credit excess caused by private credit is mainly coming from portfolio inflows rather than direct inflows.
Third, credit excess arouses the credit risk in all groups. However, we can find the only case that a high credit excess with higher portfolio inflows leads to higher vulnerability to credit risk in the seven Asian countries. And this trend is much stronger in these countries after the financial crisis.
Finally, from the results of the TSLS estimation to find the channel of capital inflows which can strengthen the relationship between private credit excess and credit risk, there is no significant evidence of such a channel in G7 countries. However we can find that portfolio inflows strengthen the positive relationship between credit excess and credit risk in Asian countries, and we find that this trend is seen more in these after the global financial crisis.
Taken together, the stronger positive relationship between credit excess and credit risk can be strengthen under the massive portfolio inflows in particular in the seven Asian countries such as Hong Kong, India, Indonesia, Korea, Malaysia, Singapore, and Thailand.
Tables & Figures
Table 1.
Descriptive Statistics
Note: Std. stands for standard deviation.
Table 2.
Descriptive Statistics: Crisis Classification (After Crisis)
Note: Std. stands for standard deviation.
Figure 1.
Trends of Credit Risk and Private Credit Growth
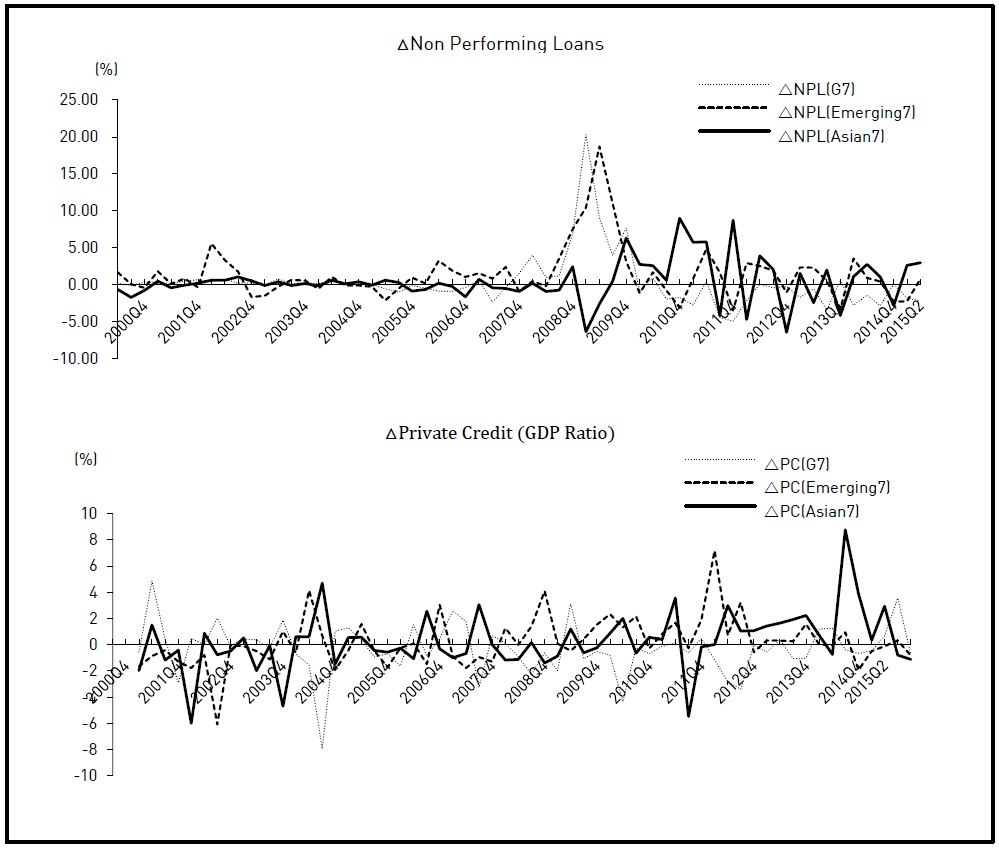
Table 3.
A Relationship Between Credit Risk and Private (or Public) Credit Growth
Notes: Panel fixed effect. Standard errors are given in parentheses. *significant at 10 percent, **significant at 5 percent, ***significant at 1 percent.
Figure 2.
Trends of Net Capital Inflows
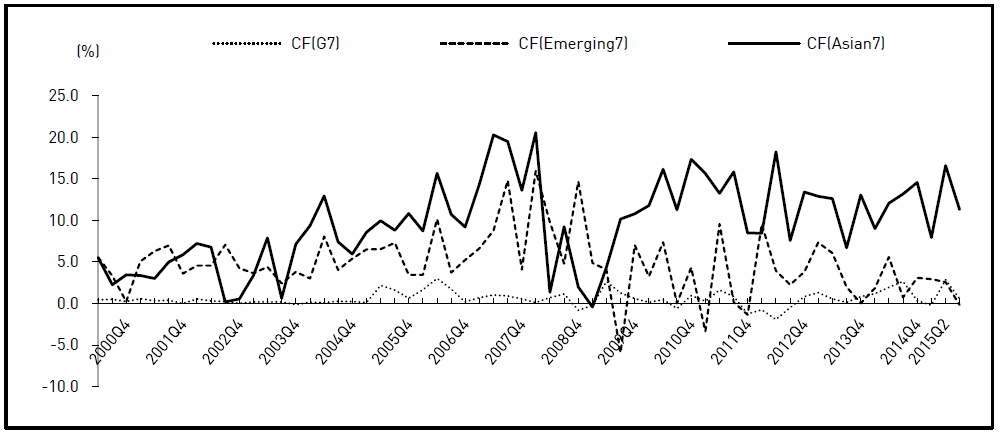
Table 4.
Average Capital Inflows
Note: Std. stands for standard deviation.
Table 5.
Impact of Capital Inflows on the Relationship Between Credit Risk and Private Credit Growth
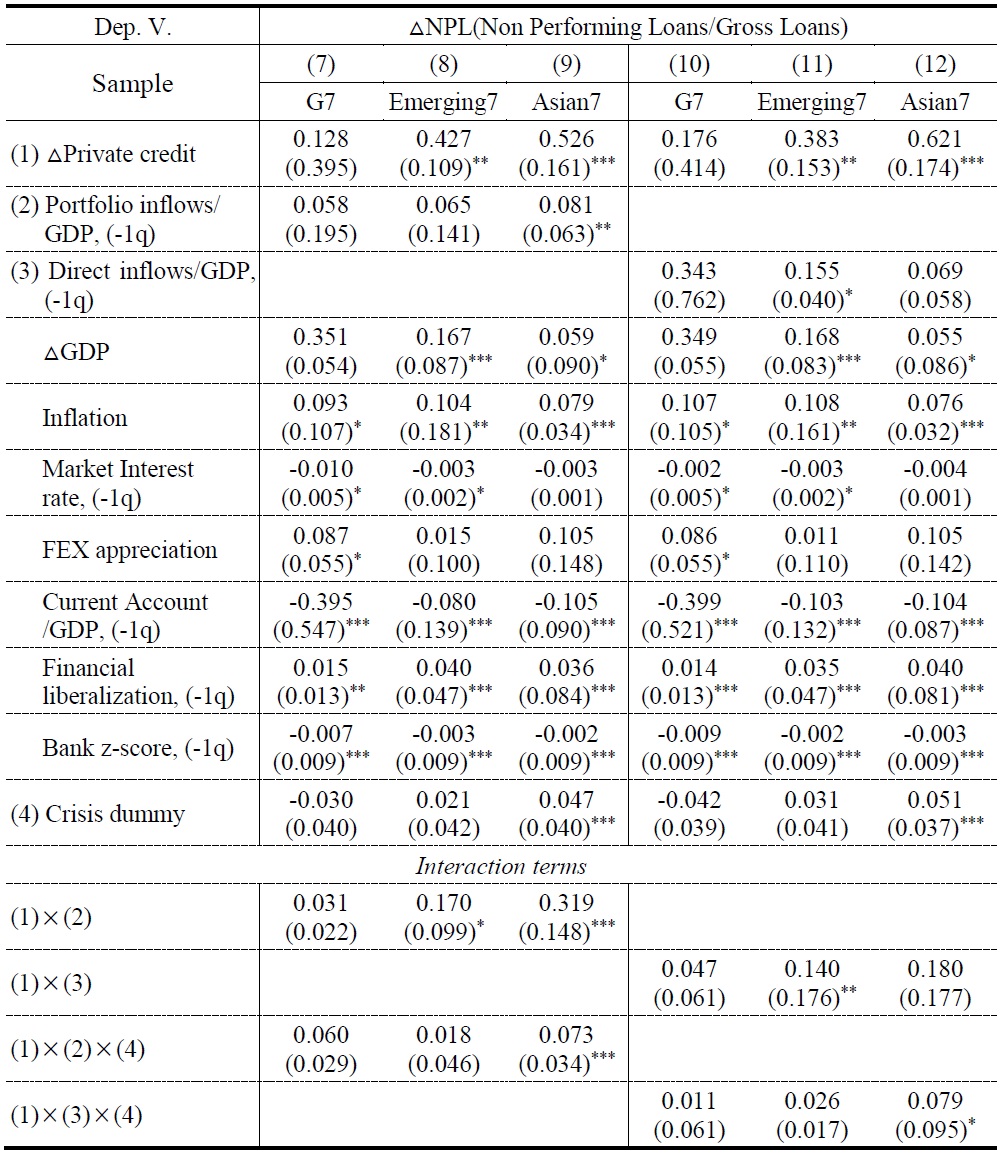
Table 5.
Continued
Notes: Panel fixed effect. Standard errors are given in parentheses. *significant at 10 percent, **significant at 5 percent, ***significant at 1 percent.
Table 6.
Impact of Capital Inflows on the Relationship between Credit Excess and Credit Risk
Notes: Panel fixed effect. Standard errors are given in parentheses. *significant at 10 percent, **significant at 5 percent, ***significant at 1 percent.
Table 7.
The Pathway of Credit Risk by Credit Excess from Portfolio Inflows (1st Step: OLS)
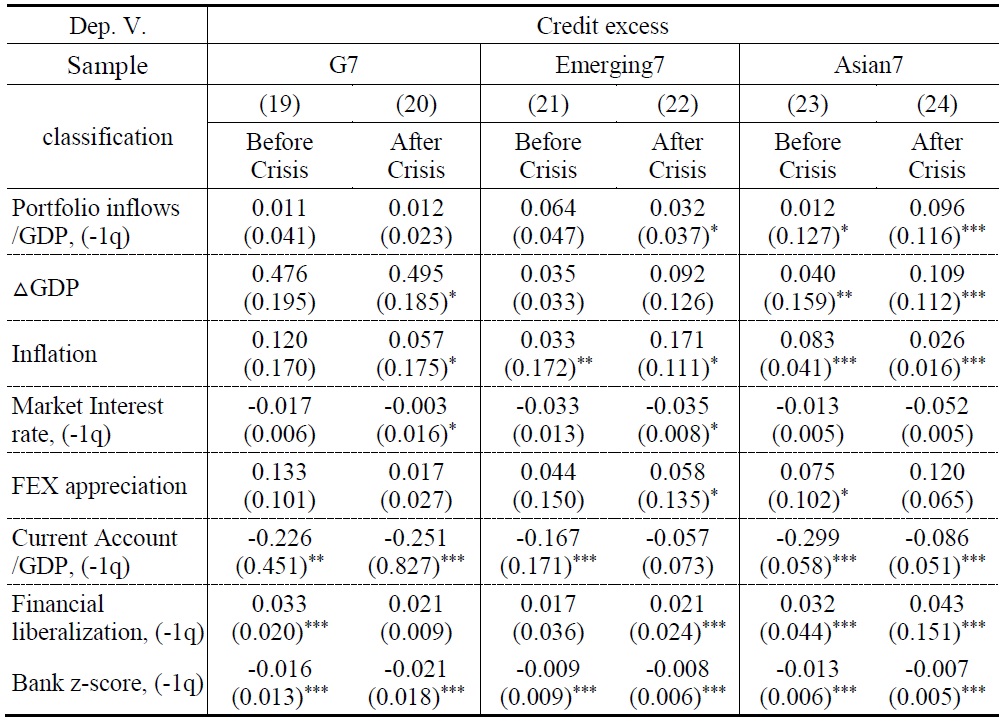
Table 7.
Continued
Notes 1: Panel fixed effect. Standard errors are given in parentheses. *significant at 10 percent, **significant at 5 percent, ***significant at 1 percent.
Table 8.
The Pathway of Credit Risk by Credit Excess from Portfolio Inflows (2nd Step: TSLS)
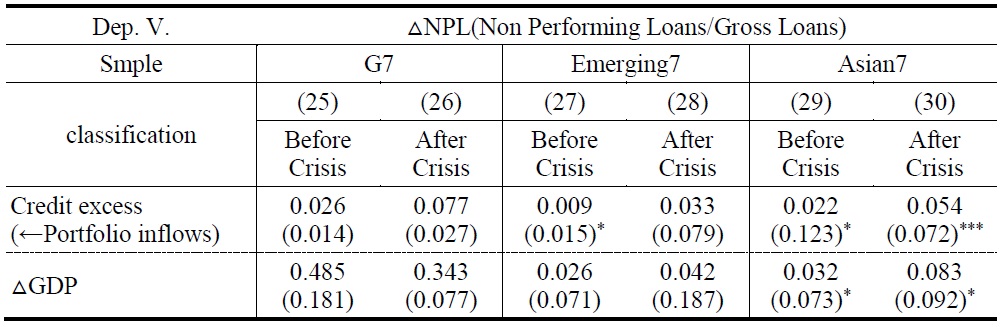
Table 8.
Continued
Notes 1: Panel fixed effect. Standard errors are given in parentheses. *significant at 10 percent, **significant at 5 percent, ***significant at 1 percent.
Notes 2: Instrument variable in TSLS is Portfolio inflows (-1q), as a share of GDP.
Figure 3.
Trends of CDS Rate
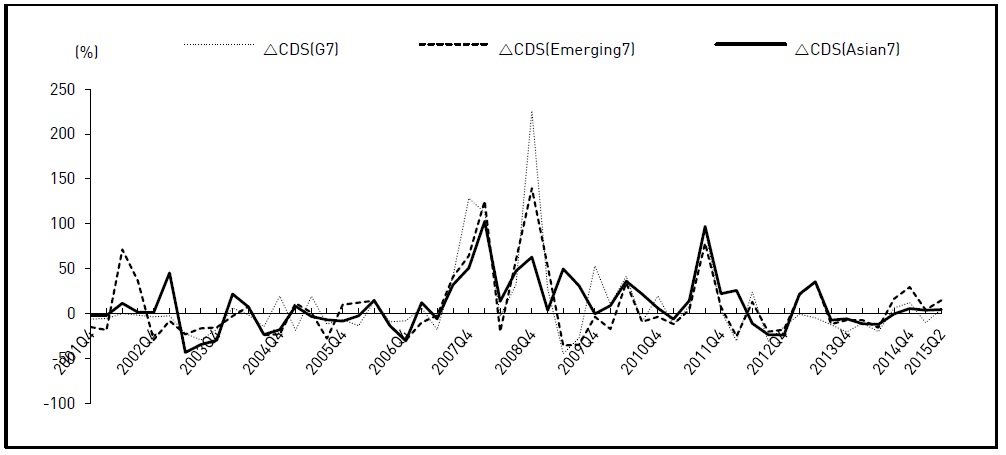
Table 9.
Impact of Capital Inflows on the Relationship between Credit Risk and Private Credit
Notes: Panel fixed effect. Standard errors are given in parentheses. *significant at 10 percent, **significant at 5 percent, ***significant at 1 percent.
Table 10.
The Pathway of Credit Risk by Credit Excess from Portfolio Inflows (2nd Step: TSLS)
Notes 1: Panel fixed effect. Standard errors are given in parentheses. *significant at 10 percent, **significant at 5 percent, ***significant at 1 percent.
Notes 2: Instrument variable in TSLS is Portfolio inflows (-1q), as a share of GDfP.
References
-
Ahmed, S. and A. Zlate. 2013. “Capital Flows to Emerging Market Economies: A Brave New World?,”
Journal of International Money and Finance , vol. 48, part B, pp. 221-248. -
Azis, I. J, and H. S. Shin. 2015.
Managing Elevated Risk: Global Liquidity, Capital Flows, and Macroprudential Policy-An Asian Perspective , Asian Development Bank, Springer. -
Borio, C. and M. Drehmann. 2009. “Assessing the Risk of Banking Crises-Revisited,”
BIS Quarterly Review , March, pp. 29-46. - Byrne, J. P. and N. Fiess. 2011. International Capital Flows to Emerging and Developing Countries: National and Global Determinants. Adam Smith Business School Discussion Paper no. 2011-01. Glasgow: University of Glasgow.
- Calderon, C. and K. Megumi. 2012. Gross Inflows Gone Wild: Gross Capital Inflows, Credit Booms and Crises. World Bank Policy Research Working Paper, no. WPS 6270.
-
Chinn, M. and H. Ito. 2008. “A New Measure of Financial Openness,”
Journal of Comparative Policy Analysis , vol. 10, no. 3, pp. 309-322.
- Crowely, J. 2008. Credit Growth in the Middle East, North Africa, and Central Asia Region. IMF Working Paper, WP/08/184.
-
Demirgüç-Kunt, A. and E. Detragiache. 1998. “The Determinants of Banking Crises in Developing and Developed Countries.”
IMF Staff Papers , vol. 45, no. 1, pp. 81-109.
-
Ehrmann, M., Gambacorta, L., Martinez-pages, J., Sevestre, P. and A. Worms. 2003. “Financial System and the Role of the Banks in Monetary Transmission in the Euro Area,” In Angeloni, I., Kashyap, A. K. and B. Mojon. (eds.)
Monetary Policy Transmission in the Euro Area: A Study by the Eurosystem Monetary Transmission Network . Cambridge: Cambridge University Press. -
Eichengreen, B., Rose, A. and C. Wyplosz. 1995. “Exchange Market Mayhem: The Antecedents and Aftermath of Speculative Attacks,”
Economic Policy , vol. 10, no. 21, pp. 249-296.
-
Fernandez-Arias, E. 1996. “The New Wave of Private Capital Inflows: Push or Pull?,”
Journal of Development Economics , vol. 48, no. 2, pp. 389-418.
-
Forbes, K. J. and F. E. Warnock. 2011. “Capital Flow Waves: Surges, Stops, Flight, and Retrenchment,”
Journal of International Economics , vol. 88, no. 2, pp. 235-251.
-
Fratzscher, M. 2012. “Capital Controls and Foreign Exchange Policy,”
Journal Economía Chilena (Chilean Economy) , vol. 15, no. 2, pp. 66-98. - Fratzscher, M., Duca, M. L. and R. Straub. 2012. A Global Monetary Tsunami? On the Spillovers of US Quantitative Easing. CEPR Working Paper no. 9195.
- Frost, J. and R. van Tilburg. 2014. Financial Globalization or Great Financial Expansion? The Impact of Capital Flows on Credit and Banking Crisis. DNB Working Paper, no. 441.
-
Ghosh, A. R., Qureshi, M. S., Kim, J. I. and J. Zalduendo. 2014. “Surges,”
Journal of International Economics , vol. 92, no. 2, pp. 266-285.
-
Gourinchas, P.-O. and M. Obstfeld. 2012. “Stories of the Twentieth Century for the Twenty-First,”
American Economic Journal: Macroeconomics , vol. 4, no. 1, pp. 226-265.
-
Hernandez, L. and O. Landerretche. 1999. “Capital Inflows, Credit Booms and Macroeconomic Vulnerability: The Cross Country Experience,”
Money Affairs , vol. 12, no. 1, pp. 1-69. -
IMF. 2004. “Are Credit Booms in Emerging Markets a Concern?,”
World Economic Outlook , April, Chapter IV. -
Jordà, Ò., Schularick, M. and A. M. Taylor. 2011. “Financial Crises, Credit Booms, and External Imbalances: 140 Years of Lessons,”
IMF Economic Review , vol. 59, no. 2, pp. 340-378.
-
Kaminsky, G. L. and C. M. Reinhart. 1999. “The Twin Crises: The Causes of Banking and Balance of Payments Problems,”
American Economic Review , vol. 89, no. 3, pp. 473-500.
-
Kaminsky, G., Lizondo, S. and C. M. Reinhart. 1998. “Leading Indicators of Currency Crisis,”
IMF Staff Papers , vol. 45, no. 1, pp. 1-48.
-
Kose, M. A., Prasad, E., Rogoff, K. and S.-J. Wei. 2009. “Financial Globalization: A Reappraisal,”
IMF Staff Papers , vol. 56, no. 1, pp. 8-62.
-
Lane, P. R. and G. M. Milesi-Ferretti. 2007. “Capital Flows to Central and Eastern Europe,”
Emerging Markets Review , vol. 8, no. 2, pp. 106-123.
-
Lane, P. R. and G. M. Milesi-Ferretti. 2008. “The Drivers of Financial Globalization,”
American Economic Review , vol. 98, no. 2, pp. 327-332.
-
Lane, P. P. and P. Mcquade. 2014. “Domestic Credit Growth and International Capital Flows,”
Scandinavian Journal of Economics , vol. 116, no. 1, pp. 218-252.
-
Levine, R. 1997. “Financial Development and Economic Growth: Views and Agenda,”
Journal of Economic Literature , vol. 35, no. 2, pp. 688-726. - Lorenzoni, G. and I. Werning, 2013, Slow Moving Debt Crises. NBER Working Paper, no. 19228.
-
Mckinnon, R. I. and H. Pill. 1999. “Exchange Rate Regimes for Emerging Markets: Moral Hazard and International Over Borrowing,”
Oxford Review of Economic Policy , vol. 15, no. 3, pp. 19-38.
-
Mendoza, E. G. and M. E. Terrones. 2012. “An Anatomy of Credits Booms and Their Demise,”
Chilean Economy , vol. 15, no. 2, pp. 4-32. -
Mendoza, E. G. and V. Z. Yue. 2012. “A General Equilibrium Model of Sovereign Default and Business Cycles,”
Quarterly Journal of Economics , vol. 127, no. 2, pp. 889-946.
-
Miniane, J. 2004. “A New Set of Measures on Capital Account Restrictions,”
IMF Staff Papers , vol. 51, no. 2, pp. 276-308. -
Mishkin, F. S. 1999. “Lessons from the Asian Crisis,”
Journal of International Money and Finance , vol. 18, no. 4, pp. 709-723.
-
Moinescu, B.-G. 2012. “Credit Accelerator, CDS Rate and Long Term Yields: Empirical Evidences from the CEE Economies,”
Journal of applied Quantitative Methods , vol. 7, no. 3, pp. 1-12. -
Reinhart, C. M. and K. S. Rogoff. 2011. “From Financial Crash to Debt Crisis,”
American Economic Review , vol. 101, no. 5, pp. 1676-1706.
-
Sa, S. 2006. “Capital Flows and Credit Booms in Emerging Market Economies,”
Financial Stability Review , no. 9, pp. 49-66. -
Schindler, M. 2009. “Measuring Financial Integration: A New Data Set,”
IMF Staff Papers , vol. 56, no. 1, pp. 222-238.
-
Schularick, M. and A. M. Taylor. 2012. “Credit Booms Gone Bust: Monetary Policy, Leverage Cycles, and Financial Crises, 1870-2008,”
American Economic Review , vol. 102, no. 2, pp. 1029-1061.
- Smith, K. A. and D. Valderrama. 2007. The Composition of Capital Inflows When Emerging Market Firms Face Financing Constraints. Federal Reserve Bank of San Francisco Working Paper no. 2007-13. San Francisco, C.A.: Federal Reserve Bank of San Francisco.
-
Stein, J. 1998. “An Adverse-Selection Model of Bank asset and Liability Management with Implications for the Transmission of Monetary Policy,”
RAND Journal of Economics , vol. 29, no. 3, pp. 466-486.
-
Von Hagen, J. and T.-K. Ho. 2007. “Money Market Pressure and the Determinants of Banking Crises,”
Journal of Money, Credit and Banking , vol. 39, no. 5, pp. 1037-1066.