



- EAER>
- Journal Archive>
- Contents>
- articleView
Contents
Citation
| No | Title |
|---|---|
| 1 | Ảnh hưởng của Google và Facebook đến tỷ suất sinh lời trên thị trường chứng khoán Việt Nam / 2024 / Tạp chí Khoa học Thương mại pp.20 / |
| 2 | The impact of Baidu Index sentiment on the volatility of China's stock markets / 2019 / Finance Research Letters |
| 3 | How investor attention affects stock returns? Some international evidence / 2022 / Borsa Istanbul Review / vol.22, no.3, pp.616 / |
| 4 | Relationship between investor attention and stock returns through wavelet analysis / 2025 / Review of Behavioral Finance / vol.17, no.1, pp.141 / |
Article View
East Asian Economic Review Vol. 21, No. 2, 2017. pp. 147-165.
DOI https://dx.doi.org/10.11644/KIEP.EAER.2017.21.2.327
Number of citation : 4View
1409
Download
420



Can Big Data Help Predict Financial Market Dynamics?: Evidence from the Korean Stock Market
|
|
Macroprudential Supervision Department, The Financial Supervisory Service |
|---|


Abstract
This study quantifies the dynamic interrelationship between the KOSPI index return and search query data derived from the Naver DataLab. The empirical estimation using a bivariate GARCH model reveals that negative contemporaneous correlations between the stock return and the search frequency prevail during the sample period. Meanwhile, the search frequency has a negative association with the one-week- ahead stock return but not vice versa. In addition to identifying dynamic correlations, the paper also aims to serve as a test bed in which the existence of profitable trading strategies based on big data is explored. Specifically, the strategy interpreting the heightened investor attention as a negative signal for future returns appears to have been superior to the benchmark strategy in terms of the expected utility over wealth. This paper also demonstrates that the big data-based option trading strategy might be able to beat the market under certain conditions. These results highlight the possibility of big data as a potential source-which has been left largely untapped-for establishing profitable trading strategies as well as developing insights on stock market dynamics.
JEL Classification: G10, G12, G14
Keywords
Big Data, Dynamic Correlation, NAVER DataLab, Stock Return, KOSPI
I. INTRODUCTION
This paper estimates dynamic relationships between the Korean stock market index and the related online search queries within a multivariate GARCH framework. In addition, the paper also attempts to investigate whether the information from search query data can be served as a potential source for designing profitable trading strategies in the Korean stock market.
The emergence of internet and social networking services combined with the extensive dissemination of smart phones have revolutionized the way we communicate and exchange information. Consequently, big data continuously flowing from increasing online activities by users have become a buzz word for recent years because of its potentials for various uses including marketing, political predictions, disease epidemics, social dynamics, etc.1
Economists are one of the late professions who delves into the investigation of possible use of big data mainly for forecasting market dynamics and related issues.2 The seminal paper by Choi and Varian (2012) shows the use of Google search query data as a key predictor for various economic activities including auto sales, travels, etc.3 It stimulates subsequent studies in the field of economics, which mostly concentrates on exploiting big data to increase the prediction power of forecasting models for economic variables of own interests.
The idea that the search query might contain information about subsequent actions by users is based on the premise that economic agents living in a contemporary society largely rely on the prior information-search process before making important economic decisions such as the purchase of durable goods and financial investments.
However, the motivaton of information demand does not always run in this direction; the heightened information-gathering activity itself can be the manifestation of a simple endogenous response to major events in markets in quest of more information, which might yield possible effects on market developments in next rounds. These intricacies in the causal relationship between the information demand and the market outcomes make it difficult to assess correctly the real importance of big data. In spite of this complicacy, the predictive power of information generated from online big data for market activity is supported by numerous studies ranging from stock markets to housing markets.4
The empirical analysis on the Korean stock market in this study reveals that the search frequency related to the Korean stock market has negative contemporaneous correlations with the KOSPI return for the majority of time with the occasional tightening of its magnitude. Furthermore, a negative association between the search query and the one-week-ahead stock return is observed, while the stock return has no statitically significant impact on the level of the future search query.
Based on these observations, we experiment with a hypothetical trading strategy that interprets the increased level of online search activity as a negative signal for future stock returns so as to examine whether profitable trading schemes can be constructed out of big data. The result from this simple exercise demonstrates that the big data-based strategy outperforms the benchmark strategy in terms of the expected utility over wealth. The other experiment also shows that the big data-based option trading strategy can beat the market for certain KOSPI200 option contracts.
As a result, this study is the first attempt to analyse the relationship between the KOSPI return and the degree of investor attention5 using the Korean stock market data and a Korean-based internet platform. We conjecture that the contribution is not limited to quantifying the dynamic relationships between stock returns and investor attention and estimating time-varying volatilities; it also explores the potential of big data as one of the practical tools for financial investment strategies, which is rarely pursued in the related literature.
This paper is structured as follows. Section 2 introduces data source and key variables used in the analysis. Section 3 provides a brief introduction the empirical model utilized. Section 4 summarizes key results out of the estimation. Section 5 discusses the experiments in which the performance of trading strategies based on big data is tested. Section 6 concludes the paper with remarks.
1)See
2)
3)
4)See
5)We use the terms “investor attention” and “information-searching effort” interchangeably in this paper.
II. DATA
The KOSPI index is used to examine the dynamic relationship between stock returns and changes in the investor information-gathering intensity. As usual, a single-period stock return is defined as the difference in logarithmic of two consecutive stock prices;

The degree of information-seeking endeavor by investors, which is a key variable in the analysis, is proxied by the search frequency for keywords related to the KOSPI market. The search frequency data is obtained from the NAVER DataLab that allows users to examine what specific topics are at the center of people’s information-search effort at the specific point of time as well as how frequently specific topics become subjects of users’ interests.6
The search frequency for the specific keywords represents the number of search invoked by anonymous users for a given period (
Recognizing that variations in search keywords might produce a different history of the search frequency, the related keywords automatically provided by the search engine-Naver-are used to minimize the author’s biases in selecting keywords for retrieval.7 The sample data runs from the 1st week of June 2009 to the last week of January 2017.
Note that because the NAVER search engine’s reach is limited to Korean resident users the coverage of this data is not comprehensive in the sense that it does not fully capture the intensity of information-search by foreign investors. It also fails to capture any kind of information acquisition and dissemination not via internet so that it only contains partial information on the intensity of information search by investors.
Although the extensive use of this variable as a proper proxy is limited, our primary concern here is that how this partially informative variable coevolves with stock prices, which we believe shed light on the potential use of big data from internet for the analysis on financial market dynamics.
The normalized search frequency-labeled as NSF- in a given point of time is defined as the deviation of the current level of search frequency from the 4-weeks moving average of it;

where 
Figure 1 shows the time path of search frequency for aforementioned keywords along with the KOSPI index. Several spikes in its search frequency after the dramatic declines in the KOSPI index are observed. It is, however, difficult to pin down the exact causal relationship between the index and the SF by simply plotting two series together, which has to be investigated in rigorous statistical tests.
Figure 2 shows the time path of KOSPI return whereas Figure 3 presents the NFS for the KOSPI market. It is evident that both series can be charaterized by the time-varying volatility. The volatilities of the NFS appear to dampen as the time laps. The KOSPI return’s volatility also seems to be attenuated as the time passes. It appears that the periods where the NFS became more volatile are followed by relatively highly volatile periods for the KOSPI return (
Examining statistical properties of variables, Table 1 shows that both the KOSPI return and the NSF do not to have unit roots in its dynamic processes. On the other hand, it is found that the NFS Granger-causes both the KOSPI return and the KOSPI 200 implied volatility-but not vice versa-at various lag structures (see Table 2, Table 3, Table 4). These observations suggest that the fluctuations in NSF might have hints for future stock price movements and volatilities.
6)The NAVER is one of leading IT companies in South Korea and provides key search engine services. Its dominance in the search engine platform market leads to deliver the beta version of big data on its users’ search patterns.
7)The specific algorithm on how the search engine produces related search keywords for a specific search query is complex. Basically, if the number of pair of search queries executed in a consecutive manner exceeds a certain threshold level, those two words are considered highly associated. In addition to this, it is known that the text mining approach is also used to identify interrelatedness of two words.
III. ESTIMATION MODEL
In this section we specifically focus on estimating the dynamic relationship between the NFS and the KOSPI return. The empirical model is based on VAR(1) model with bivariate GARCH(1,1) error terms.8 The estimation model employed in this study can be summarized by following three equations.


where 
The restrictions on the covariance matrix follow Engle (2002)’s approach that is famously known as the dynamic conditional correlation model. In this setup, the covariance matrix

where

where
A diagonal term in  . The dynamic process of conditional correlation (

where  -the standardized residuals. If
8)This specific lag structure in VAR and GARCH is chosen so as to minimize AIC (Akaike Information Criterion). Estimation results at different lags are provided in the Appendix.
IV. RESULTS
In this section, the focus of discussion centers around the estimated conditional volatilities of key variables (
A plot of volatilities in Figure 4 shows that the volatilities of the KOSPI return are smaller than those of the NFS throughout the entire sample periods. The volatility of the NSF increases dramatically around June 2010 and then gradually decays, fluctuating around 0.12. The volatility of the KOSPI return also exhibits similar dynamic patterns; after reaching the peak level around December 2011, it fluctuates within the range between 0.015 and 0.025.
Looking at correlations between two variables in Figure 5, it is interesting to note that negative correlations between the KOSPI return and the NFS dominate during the sample period with occasional positive correlations; it mainly fluctuates within the range between 0 and -0.4 while the magnitude of it heightens up to -0.6 around June 2011.
The estimates of parameters in Eq. (3) and Eq. (5) are reported in Table 5. It shows that there is a negative association between the current NSF and the one-week ahead KOSPI return with its magnitude being around 300bps. The KOPSI return does also have a negative-yet statistically insignificant-impact on the future NFS. These results support the idea that the increase in information-search activity by traders can be interepreted as a negative signal for the one-week-ahead stock return.
These findings can also be understood as the existence of a trader’s asymmetric responses to news. Bad (Good) news which have led to the decrease in stock prices might create more (less) room or incentive for seeking more information in an effort to prevent further losses and to shift the current position than in the case of good news. This kind of a trader’s asymmetric responses to news is well documented in the behavioral finance literature (
The dynamic relationship between the search query change and stock return found in this study can be understood under the environment of incomplete information with the assumption of asymmetry in investor responses. For example, when an investor receives a negative signal regarding risky assets, this might lead to the increase in information searching for the resolution of uncertainty embedded in the signal, which will translate into stock price decline in next period. Due to the assumption of asymmetric responses, for a positive signal, it is likely that the less engagement in information searching is followed by a stock price increase.
As expected, the estimates of conditional volatility show that both the lagged volatility and the lagged shock have statistically significant positive impacts on the current volatility, suggesting the strong presence of volatility clustering in both stock returns and the information-search activity.
V. NSF-BASED TRADING STRATEGY (NBTS)
In this section, we carry out simple tests to examine whether fluctuations in the NFS can provide us with profitable trading opportunities. To do so, we introduce a hypothetical trader who uses the following strategy (S1t);

The NSF-Based Trading Strategy (NBTS) simply dictates that if the aggregate attention of investors to the stock market is strong enough in the previous period then the trader is to liquidate all positions and to short-sell (1 unit). In contrast, if the NSF was weak the trader would increase his shares by the amount with which the current cash can afford.9
This type of strategy is indeed based on the empirical regularities-the negative association between the lagged NSF and the KOSPI return as well as the dominance of negative contemporaneous correlations-reported in Section 4; the strategy interprets the increased online-search activity related with the stock market as a negative symptom for the one-week-ahead return in its essence.
For the sake of simplicity, we assume that a trader starts trading with initially being endowed with 100,000 cash and one unit of stock.10 A trader has no market power so that he/she buys or sells stocks at the prevailing market prices. In addition, a trader with the short-sale contract should deliver the borrowed stock back in the next period. The number of shares to buy is also constrained by the size of cash. The benchmark strategy to which the NBTS is compared is simply assumed as the ‘Hold’ strategy, which in turn means that its performance is closely related with the overall market performance. Note that the wealth (
A plot of wealth profile of the NBTS over time in Figure 6 indicates that the proposed strategy outperforms the benchmark, provided that except for relatively short periods the wealth accrued by the NBTS exceeds that of the benchmark.
For the welfare comparison, let’s assume that a trader has a CARA (Constant Absolute Risk Aversion) utility over his wealth;

where

where 
The summary statistics out of the simulated wealth including the welfare measure (
It is well known that the volatility of underlying asset's value is one of key determinants of option prices. Acknowledging our finding that the NSF Granger-causes the KOSPI implied volatility and the empirical evidence of a positive association between the investor attention and the future stock return volatility in the existing studies (

We conduct backtestings of the proposed strategy using historical NSF and two KOSPI 200 option contracts differing in an expiration date and a strike price. The first option contract (KOSPI200 201611 262.5) starts its trading from 13 May 2016 and expires on 10 Nov 2016. The second option contract (KOSPI200) period is from 15 Jul 2016 to 12 Jan 2017. Note that the strike prices are chosen based on the ATM (At The Money) prices of the begining dates of option contracts. Table 6 compares the performance of the NBTS to the market return, showing it beats the market by a large margin; in the first option contract, the NBTS records 53.49% return while the KOSPI200 index rises by 4.73%. For the second option contract, its return reaches 40.63% whereas KOSPI200 index inreases by 3.50% over the same period.
Caveats must be made in regard to these results; we are not claiming that the aforementionend strategy can always beat the market for all kinds of the KOSPI200 option contract. The performance of the NBTS option strategy can be very sensitive to the choice of a striking price and an expiration date, and other various factors. The statistical significance of outperformance of the NBTS should be tested using a wide range of option contracts, which deserves an indepdendent research project.12
Leaving this issue as a future research topic, what we would like to emphazie here is that these simple exercises clearly illustrate the possibility that information from big data can potentially benefit individual investors. We expect that more sophisticated trading strategies anchored on big data can be developed in line with the specific trading goals.
9)More sophisticated strategies can be designed out of the NFS. The proposed strategy is simply designed solely for an illustrative purpose.
10)In this analysis, the stock refers to the KOSPI index itself as a representative stock. Therefore, the focus of this experiment is not on the selection of stocks out of many candidates but on the timing of buying or selling. For simplicity, we also assume that risk-free rate is zero.
11)This doesn’t automatically mean that this strategy will maintain its profitable position in the future. This result is solely based on the historical data of KOSPI index and its related NSF.
12)Constructing big data-based option trading strategies and testing their performances appears to be beyond the scope of this study for it requires us to investigate the vast amount of existing KOSPI 200 option contract data.
VI. CONCLUDING REMARKS
In this paper, we show that the aggregate investor information demand-which is proxied by the NAVER search query data-is negatively correlated with the KOSPI return. We also identify that it is negatively associated with the future stock return. Moreover, the analysis also demonstrates that big data can be properly used for developing profitable trading strategies in financial markets.
One should, however, acknowledge that this study is limited in the sense that the information demand variable used here does not capture the overall market sentiment -either optimisitic or pessimistic. Making it even worse, we have no toolkits-as of now-for identifying whether the change in internet users’ informational quest is demand-driven or supply-driven; it is highly difficult to verify to what extent such information-seeking efforts are materialized in terms of real bids and offers.
To overcome these limitations, multi-disciplinary collaborations and more advanced text-mining techniques combined with machine learning algorithms should be applied. It should be noted that this paper is not designed to serve as such a large-scale research project that encompasses all delicate issues. Rather, we want to set off simple exercises that aim to show the potentials of big data for providing us insights for financial market dynamics as well as designing profitable trading strategies.
Various applications of big data are readily possible for other interesting issues. For example, as aforementioned, more rigorous investigation on the potential exploitation of big data in search for profitable derivatives trading strategies appears to be a fruitful research area to pursue. In addition, location-oriented search query data might be exploited to analyse the dynamics of regional housing prices and volumes as well as spatial analysis on migration patterns. Furthermore, the area of finacial early warning systems also can be a beneficiary of the in-depth use of big data as a potential source for establishing relevant warning signals.
Tables & Figures
Figure 1.
KOSPI Index (solid, left) and Search Frequency (dash, right)
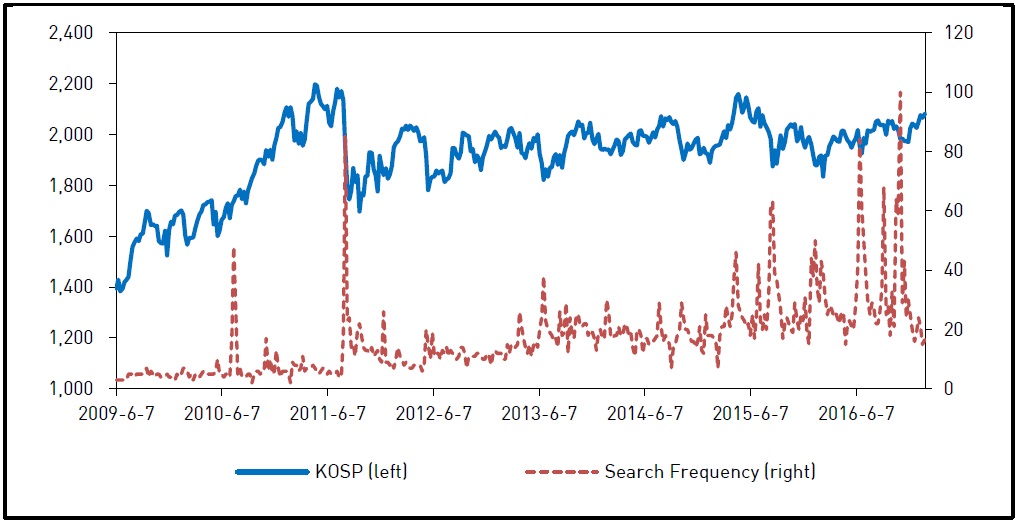
Figure 2.
KOSPI Return

Figure 3.
Normalized Search Frequency (NSF)

Table 1.
Unit Root Test Statistics

Note: **p < 0.01 ; *p < 0.05. L denotes the maximum lag in the test.
Table 2.
Granger-Causality Test Statistics: from Normalized Search Frequency

Note: **p < 0.01 ; *p < 0.05. L denotes the maximum lag in the test.
Table 3.
Granger-Causality Test Statistics: from the KOSPI return

Note: **p < 0.01 ; *p < 0.05. L denotes the maximum lag in the test.
Table 4.
Granger-Causality Test Statistics: from the KOSPI 200 Implied Volatility

Note: **p < 0.01 ; *p < 0.05. L denotes the maximum lag in the test.
Figure 4.
Conditional Volatility: KOSPI Return (solid, left) and the NSF (dash, right)

Figure 5.
Conditional Correlation between KOSPI Return and the NSF

Table 5.
Estimates of Bivariate VAR(1)-GARCH(1,1)

Note: ** p < 0.01; * p < 0.05. The number of observation is 395.
Figure 6.
Wealth Profiles of the NBTS (solid) and the Benchmark (dash)

Table 6.
Wealth Statistics

Note: Based on
Table 7.
Return Comparsion between the KOSPI200 Option Strategy and the KOSPI

Note: KOSPI200 return and KOSPI return denote the rate of return over the corresponding option contract period. The second term in an option name refers to an expiration month, while the third term denotes a striking price.
APPENDIX
In this appendix, we provide estimation results at various lags in the mean equation as a robustness check for the stability of coefficients of key variables. Table A.1 shows that the sign, the statitical significance, and the magnitude of coefficients of key variables in Eq. (3) are not greatly altered under different model specifications except for NSF(t-2) and NSF(t-3) for the NSF variable. Note that VAR(1)-GARCH(1,1) model is chosen so as to minimze Akaike Information Criterion.
Appendix Tables & Figures
Table A.1.
Estimates of Bivariate VAR(p)-GARCH(1,1)

Table A.1.
Continued

Note: ** p < 0.01; * p < 0.05. Values in parentheses denote standard errors.
References
-
Andrei, D. and M. Hasler. 2015. “Investor Attention and Stock Market Volatility,”
Review of Financial Studies , vol. 28, no. 1, pp. 33-72.
-
Aouadi, A., Arouri, M. and F. Teulon. 2013. “Investor Attention and Stock Market Acitivity: Evidence from France,”
Economic Modelling , vol. 35, pp. 674-681.
-
Bollen, J., Mao, H. and X. Zeng. 2011. “Twitter Mood Predicts the Stock Market,”
Journal of Computational Science , vol. 2, no. 1, pp. 1-8.
-
Bollerslev, T. 1990. “Modelling the Coherence in Short-Run Nominal Exchange Rates: a Multivariate Generalized ARCH Model,”
Review of Economics and Statistics , vol. 72, no. 3, pp. 498-505.
- Choi, H. and H. Varian. 2009. “Predicting Initial Claims for Unemployment Benefits,” mimeo.
-
Choi, H. and H. Varian. 2012. “Predicting the Present with Google Trends,”
Economic Record , vol. 88, no. S1, Special Issue, pp. 2-9.
- Da, Z., Engelberg, J. and P. Gao. 2010. “In Search of Earnings Predictability,” mimeo.
-
Da, Z., Engelberg, J. and P. Gao. 2011. “In Search of Attention,”
Journal of Finance , vol. 66, no. 5, pp. 1461-1499.
-
Da, Z., Engelberg, J. and P. Gao. 2014. “The Sum of All Fears: Investor Sentiment and Asset Prices,”
Review of Financial Studies , vol. 28, no. 1, pp. 1-32.
-
De Bondt, W. F. M. and R. Thaler. 1985. “Does the Stock Market Overract?,”
Journal of Finance , vol. 40, no. 3, pp. 793-805.
-
Dodds, P. S., Harris, K. D., Kloumann, I. M., Bliss, C. A. and C. M. Danforth. 2011. “Temporal Patterns of Happiness and Information in a Global Social Network: Hedonometrics and Twitter,”
PLoS ONE , vol. 6, no. 12.
- Einav, L. and J. D. Levin. 2013. “The Data Revolution and Economic Analysis,” NBER Working Paper, no. 19035.
-
Engle, R. 2002. “Dynamic Conditional Correlation: A Simple Class of Multivariate Generalized Autoregressive Conditional Heteroskedasticity Models,”
Journal of Business & Economic Statistics , vol. 20, no. 3, pp. 339-350.
- Gandelman, N. and R. Hernández-Murillo. 2014. “Risk Aversion at the Country Level,” Federal Reserve Bank of St. Louis Working Paper, 2014-005B.
-
Ginsberg, J., Mohebbi, M. H., Patel, R. S., Brammer, L., Smolinski, M. S. and L. Brilliant. 2009. “Detecting Influenza Epidemics using Search Engine Query Data,”
Nature , vol. 457, no. 7232, pp. 1012-1014.
-
Klöᵦner, S., Becker, M. and R. Friedman. 2012. “Modeling and Measuring Intraday Overreaction of Stock Prices,”
Journal of Banking & Finance , vol. 36, no. 4, pp. 1152-1163.
-
Moat, H. S., Curme, C., Avakian, A., Kenett, D. Y., Stanley, H. E. and T. Preis. 2013. “Quantifying
Wikipedia Usage Patterns Before Stock Market Moves,”Scientific Reports , vol. 3, no. 1801. -
Preis, T., Moat, H. S. and H. E. Stanley. 2013. “Quantifying Trading Behavior in Financial Markets Using Google Trends,”
Scientific Reports , vol. 3, no. 1684. -
Rubin, A. and E. Rubin. 2010. “Informend Investors and the Internet,”
Journal of Business Finance and Accounting , vol. 37, no. 7-8, pp. 841-865.
-
Varian, H. 2014. “Big Data: New Tricks for Econometrics,”
Journal of Economics Perspectives , vol. 28, no. 2, pp. 3-28.
-
Vlastakisa, N. and R. N. Markellos. 2012. “Information Demand and Stock Market Volatility,”
Journal of Banking and Finance , vol. 36, no. 6, pp. 1808-1821.
-
Vosen, S. and T. Schmidt. 2011. “Forecasting Private Consumption: Survey-based Indicators vs. Google Trends,”
Journal of Forecasting , vol. 30, no. 6, pp. 565-578.
-
Vozlyublennaia, N. 2014. “Investor Attention, Index Performance, and Return Predictability,”
Journal of Banking and Finance , vol. 41, pp. 17-35.
- Wu, L. and E. Brynjolfsson. 2013. “The Future of Prediction: How Google Searches Foreshadow Housing Prices and Sales,” mimeo.