

- EAER>
- Journal Archive>
- Contents>
- articleView
Contents
Citation
Article View
East Asian Economic Review Vol. 22, No. 1, 2018. pp. 29-54.
DOI https://dx.doi.org/10.11644/KIEP.EAER.2018.22.1.337
Number of citation : 8View
428
Download
183
Economic Policy Uncertainty in the US: Does It Matter for Korea?
|
|
Shanghai Lixin University of Accounting and Finance |
|---|

Abstract
Using the indicators of economic policy uncertainty developed by Baker et al. (2016), this paper investigates the effects of the US economic policy uncertainty on the Korea economic uncertainty as well as Korea-US foreign exchange risk. The key findings are that: (i) the degree of spillovers of policy uncertainty from the US to Korea is considerable but not comparatively high; (ii) the US policy uncertainty plays a stronger and more consistent role in Korean currency risk than Korea policy uncertainty and other macro variables. It implies that the economic policy uncertainty in the US is an important contributor to Korea-US exchange rates.
JEL Classification: C1, F2, F3
Keywords
Economic Policy Uncertainty, International Spillovers, Currency Risk, Implied Volatility, Korea Foreign Exchange Market
I. INTRODUCTION
The Korean economy seems to react to news about what the US government or central bank have done or might do. For example, the move by the US to tighten its monetary policy in 2015 was considered as the biggest risk facing Korea’s economy in the second half of that year. More recently, Korean interest rates were expected to be raised in response to the increase of Federal fund rates, due to concerns over a possible foreign capital flight from Korea to the US by those seeking higher yields. These two cases show that economic policy uncertainty in the US might influence both Korea’s economic policy and foreign exchange market.
Many articles have examined the impact of policy uncertainty on economic activities. Friedman (1968), Rodrik (1991), Hassett and Metcalf (1999), and Born and Pfeifer (2014) find negative effects of policy uncertainty on the economy. More recently, Baker, Bloom and Davis (2016) develop an economic policy uncertainty index (EPU, hereafter), based on text searching methods to measure economic policy uncertainty in various countries.1 Their EPU index has been widely used in recent studies. For example, Pastor and Veronesi (2012) develop a theoretical link between political uncertainty and stock market volatility and provide supportive evidence by using an EPU index. Gulen and Ion (2016) find that an EPU index has a negative impact on firm and industry level investment. Klößner and Sekkel (2014) estimate the spillovers of EPU indices for six major countries and find that spillovers contribute more than 25% of the dynamics of policy uncertainties in these countries. Colombo (2013) shows that US policy uncertainty shocks plays a more important role on the European aggregates than does Euro area policy uncertainty shock. In addition, Baker et al. (2016) demonstrate that policy uncertainty is associated with greater stock price volatility and reduced investment and employment in policy sensitive sectors.
In this paper, using Baker, Bloom, and Davis’ (2016) EPU indices, we first investigate the relationship between policy uncertainty in the US and in Korea. Our main interests are (1) how much of the policy uncertainty spills over from other countries to Korea, and (2) whether the level of policy uncertainty spillovers from the US overwhelms that from any other country. To answer these questions, we employ as methodology proposed by Diebold and Yilmaz (2009, 2012, 2014), which enable us to measure the direction of uncertainty spillovers across countries. From this, we demonstrate that US is a net exporter (giver) of policy uncertainty, whereas Korea is a net importer (receiver). It indicates that US economic policy uncertainty mainly originates from domestic issues, while Korean uncertainty comes from other countries. However, contrary to expectations, the degree of spillovers from US to Korea is not comparatively high. We can observe a rapid increase of spillovers from Germany to Korea during the Eurozone crisis period, spillovers from Japan with the beginning of the Japanese stimulus package in 2014, and spillovers from the UK with the Brexit shock in 2016. Korean policy uncertainty is vulnerable to global policy uncertainty, but the main contributors vary substantially over time.
Next, we examine the impacts of policy uncertainty on the Korean foreign exchange (FX) market. There are two reasons for choosing Korean-US exchange risk. First, many studies have found it difficult to link exchange rates with economic determinants since Meese and Rogoff (1983). It is meaningful to examine the driving source of exchange rates. Second, there are empirical studies which demonstrate the impact of policy uncertainties on stock volatility or stock price, but few that examine its impact on foreign exchange risk.2
Considering at-the-money implied volatility,3 realized volatility, and carry trade returns as a gauge of Korean-US foreign exchange risk, we investigate the role of the US economic policy uncertainty in Korean-US exchange risk. Interestingly, EPUs in the US have a stronger impact in both implied volatility and realized volatility than Korean policy uncertainty itself, at short-time horizon of less than a year. Controlling for Regressand’s persistence and other macroeconomic variables, coefficients for an EPU in the US stay statistically significant with high explanatory power. This indicates that the market responds more to news about US policy uncertainty rather than Korean policy uncertainty, and hence it should be taken into account to explain movements in Korean-US exchange rates. One of our key findings is a relationship between policy uncertainty in the US and carry trade return (or currency excess return) in the Korean FX market. We find that US policy uncertainty predicts 3-month-ahead excess return for holding the Korean won, where excess return is negative and in the bottom quantiles. These results imply that news on US policy uncertainty trigger to unwind the position, when investors have low tolerance. These findings consistently demonstrate that economic policy uncertainty in the US appears to be an important contributor to Korea currency markets.
The remainder of the paper proceeds are follows. In section 2, we analyze the international spillovers of economic policy uncertainties. In particular, we focus on Korea and examine how much shocks originating from the US affect uncertainty in Korea. Section 3 investigates the impact of EPUs in US on Korea-US exchange risk, and shows our empirical results. Section 4 concludes.
1)Their earlier indices are based on a weighted average of a news-based measure of uncertainty and forecast disagreements among professional forecasters. However, to extend EPU measures over time and across countries, their new indices focus on a newspaper approach.
2)
3)At-the-money implied volatility is from currency option data. By construction, options are forward-looking, and therefore convey information about market participants’ preferences or beliefs. Many studies, such as
II. ECONOMIC POLICY UNCERTAINTY
1. Data Description
There has been long-standing interest in the impacts of uncertainty on economic activities, such as growth, investment, or asset prices. Since Bloom (2009), many studies have proposed measuring various kinds of uncertainty to investigate its effects on economic activities.4 Among others, Baker, Bloom, and Davis (2016) develop indices of policy-related economic uncertainty for the United States and for other major countries. Their Economic Policy Uncertainty (EPU) index is based on newspaper coverage frequency and shows a strong relationship with other measures of economic uncertainty, such as implied stock market volatility or the frequency with which the Federal Reserve System’s Beige Books mention policy uncertainty.
Following these empirical studies, we use the monthly EPU index obtained from the Policy Uncertainty website.5 Our sample covers the period from January 1998 to September 2016 for 5 countries: Germany, Japan, Korea, the United Kingdom and the United States. Summary statistics are presented in Table 1.
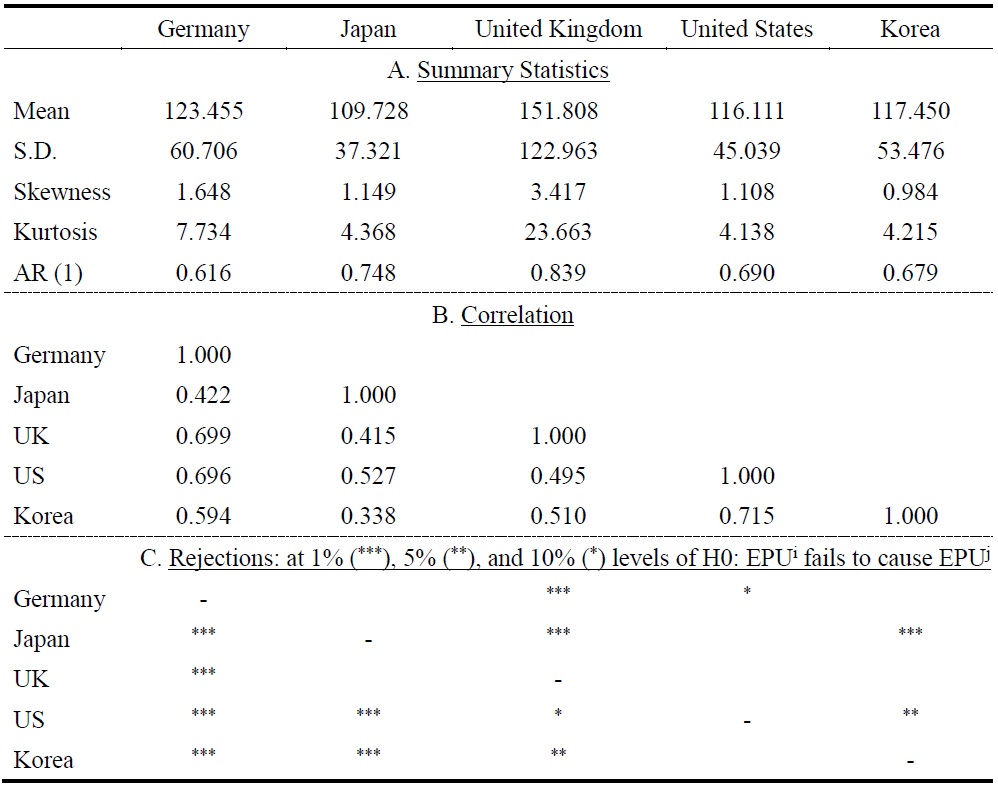
Panel A reports that the average level of policy uncertainty of United Kingdom is relatively higher, whereas that of Japan is relatively lower than the rest of the countries during sample period. The estimates of first-order autocorrelation coefficients indicate that policy uncertainties are not highly persistent for all countries. The correlation matrices for the EPU index in the different countries are presented in Panel B. As we expected, Korea has the highest correlation with the US, at 71.5%, and the lowest correlation with Japan, at 33.8% within sample period. Germany has the highest correlation with the United Kingdom, but is also highly correlated with uncertainty in the US. They demonstrate the significant co-movement among policy uncertainty measures in the different countries. Figure 1 plots the standardized uncertainty in each country. We can observe that the EPU is relatively high from the 2008 Global financial crisis to the 2014 Eurozone crisis, and there is another spike in 2016 caused by the United Kingdom European Union member referendum. To investigate the causality among countries, we report the Granger causality tests including a constant and 10 lags of each variable. Panel C in Table 1 present that the EPU in the US Granger causes its counterpart in Korea, but not vice versa. To understand the international transmission of policy uncertainty from another country to Korea, we use the spillover measure proposed by Diebold and Yilmaz (2009) in the next section.
2. Methodology: Diebold and Yilmaz (2009) Spillover Index
Diebold and Yilmaz (2009, DY hereafter) initially developed a measure of spillovers in global equity market. In subsequent papers, they apply their methodology to investigate volatility spillovers across various asset markets (DY, 2012), and stock return volatility connectedness across US financial institutions (DY, 2014). They show that their measure is closely related to other measures of network risk, such as CoVaR (Adrian and Brunnermeier, 2011) and the marginal expected shortfall (Acharya et al., 2010; Acharya et al., 2012). Klößner and Sekkel (2014) and Guimaraes-Filho and Hong (2016) use DY’s methodology to analyze the transmission of policy uncertainty shocks across major economies and the connectedness of the Asian equity market, respectively.
The assumption of DY spillover is based on variance decomposition associated with an N-variable VAR (p) process, where 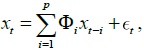 where the error term is a vector of independently and identically distributed disturbances. This process can be written in Wold form
 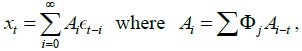 where
where
The H-step-ahead generalized forecast error variance decomposition (
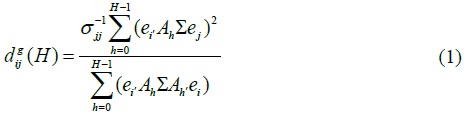
where
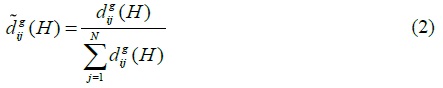
One of the advantages of DY’s methodology is that we can estimate pairwise directional spillovers very easily. First, the directional spillovers from all other countries to country
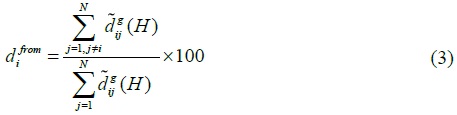
Similarly, directional spillovers to all other countries from country

Then,  quantifies the degree of the spillovers from other countries to Korea. Conversely,
  quantifies the degree of the policy uncertainty spillover from Korea to other countries.
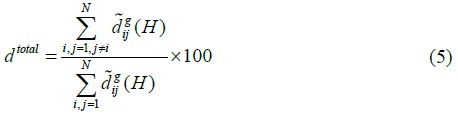
To calculate the total amount of spillovers across countries, the index for total spillovers is defined as below:
Instead of assuming fixed-parameters during whole sample period, DY (2009, 2012, 2014) and subsequent papers (i.e., Klößner and Sekkel, 2014; Guimaraes-Filho and Hong, 2016) allow the parameter to change over time by using a rollingwindow estimation.
3. International Spillovers of the Policy Uncertainty across Countries
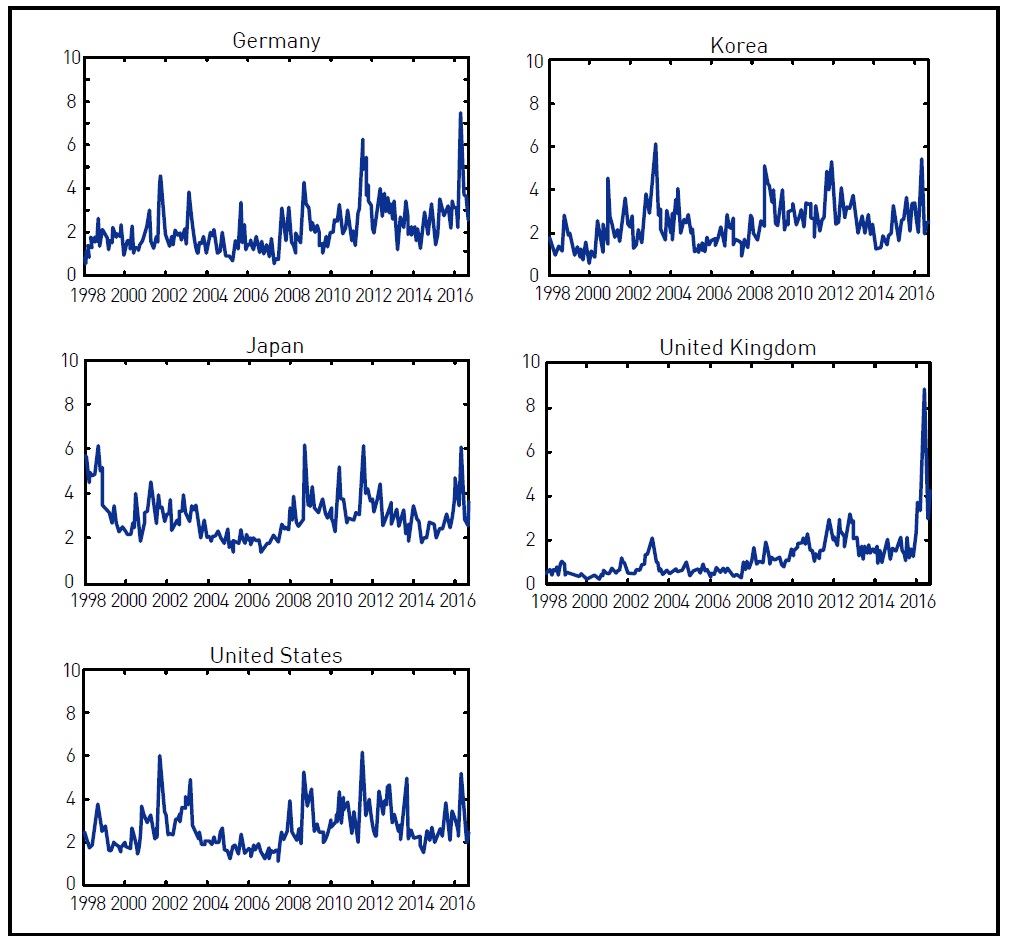
Our results are based on a VAR with 3 lags and a 10-month horizon, as well as a window size of 60 months.7 Figure 2 presents the dynamics of the total spillover index across countries from December 2002 to September 2016. We can see that the amount of economic policy uncertainty spillovers across countries varies substantially over time. The aggregate level of spillovers from policy uncertainty decreases sharply in early 2008 and spikes to its highest during the global financial crisis of 2008. Then, total spillovers across countries remain at a relatively higher level until the end of great recession in 2012. We can observe another sharp increase in mid-2016, corresponding to the UK referendum to leave the EU. As expected, countries give and receive more economic policy uncertainty when influential economic or policy events are experienced.
Figure 3 displays the directional spillovers of policy uncertainty in each country. The solid line indicates how much one country receives policy uncertainty shocks from other countries, while the dotted line indicates how much each country gives its policy uncertainty shock to remaining countries. When giving is higher than receiving, it implies that shocks are transmitted from that country to remaining countries. Based on this information, we can see that the US is a net exporter of policy uncertainty shocks most of the time, while Korea is a net importer. This indicates that US policy uncertainty typically originates from domestic issues, while Korea uncertainty usually comes from global policy uncertainty. We should note that from the 2008 global financial crisis to 2012, economic policy uncertainty in Korea was idiosyncratic, since the gap between spillover from other countries and spillover to other countries was very small.
We now focus on the degree of spillovers from uncertainty in each of the countries to uncertainty in Korea more specifically. In Figure 4, we plot the proportion of directional spillover from each of the four countries to Korea. There is time variation in spillovers from Germany, Japan, and the UK to Korea. From the beginning of the Eurozone crisis 2012, policy uncertainty shock originating in Germany had greater impact in Korea. In 2013, we can see that Japanese quantitative easing and its monetary and fiscal policy led to higher spillovers to Korea. Among the four countries, the US shows a relatively constant degree of spillover to Korea over time. Contrary to our expectations, however, policy uncertainty spillovers from the US to Korea is not comparatively high. With this exercise, we can see that policy uncertainty in Korea is greatly affected by major countries’ uncertainties, but the main contributor is time-variant.
4)See, for example,
5)See
6)We refer readers to
7)
III. CURRENCY RISK AND ECONOMIC POLICY UNCERTAINTY
In this section, we focus on the impacts of economic policy uncertainty in the US on the Korean FX market. Some of the policy makers’ or investors’ concern is more about volatility rather than level of the exchange rate, since volatility is considered as the reflection of the degree of risk. Using implied volatility and realized volatility, we analyze the relationship between second moments of Korean -US exchange rates and the EPU in the US. Then, we extend this analysis to currency risk premia, measured by the currency excess return.
1. Implied Volatility, Realized Volatility, and Economic Policy Uncertainty
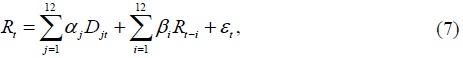
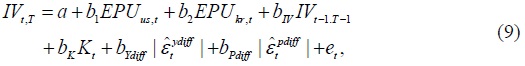
Option prices of the underlying asset are known to incorporate market beliefs about the probability of future payoffs. Different from other stock or commodity options, currency option prices are quoted in a combination of call and put options. Among others, at-the-money (ATM) implied volatility is the most liquid structure and is commonly used as a proxy for the expectation of future volatility.8 To examine the impact of policy uncertainty in the US on implied volatility of the Korean FX market, we regress the following equation.

where
Following Beber et al. (2010), we include the lagged implied volatility to prevent
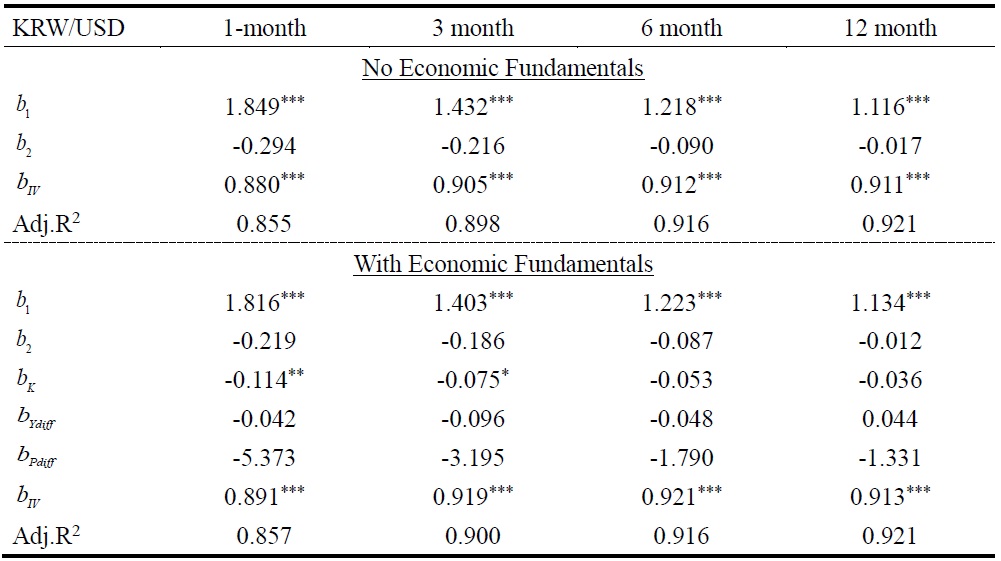
Table 3 presents the results of the estimating equation (6). A statistically significant and high level of
One might argue that estimated results are spurious because of omitted variables in equation (6). Consider the case when the macro determinant is directly linked to the implied volatility, whereas EPUs have no direct relationship with implied volatility. Under these constraints, estimated coefficients
To estimate the volatility of relative level of macro fundamentals between two countries, we use the methodology proposed by Schwert (1989). In particular, Beber et al. (2010) estimate the monthly volatility by using 12th-order autoregression and including seasonal dummies as follows:
In this paper,
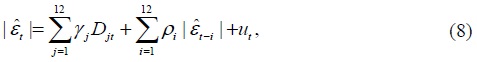
Then, we re-estimate the equation (6) including the current macroeconomic fundamentals as below:
where 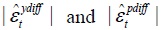 are the volatility of output growth differentials and that of inflation differentials, respectively.
Table 3 addresses the relative importance of policy uncertainty and other macro determinants. We can see that when jointly including policy uncertainty and macro variables,
As an another robust check, we re-estimate equation (6) in the form of predictive regression. To avoid the endogeneity caused by contemporaneous regressors and regressand, we use current economic policy uncertainties and economic volatility to predict the h-month-ahead implied volatility of KRW/USD. As shown in Table 4, estimated results are very similar to the previous ones. US policy uncertainty significantly predicts ATM implied volatility for all horizons, and it holds when the current macro fundamentals are included.
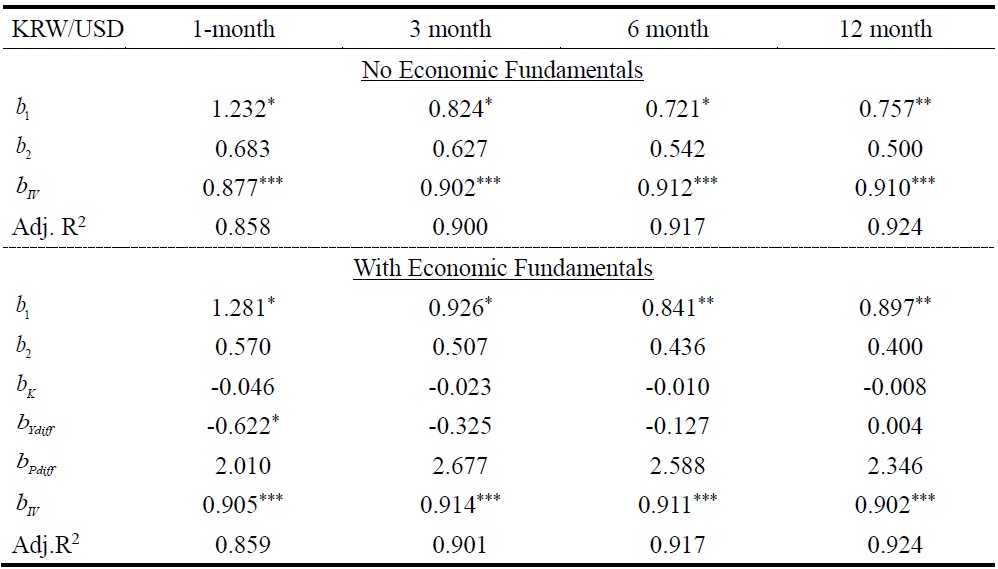
Additionally, we examine the impact of US policy uncertainty on realized volatility of KRW/USD. Following Andersen et al. (2003), we calculated the realized volatility as 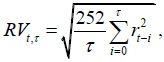 where
where
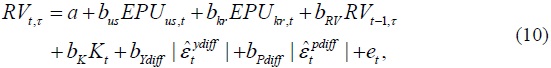
Table 5 reports the results of estimating equations (10). The upper panel shows the case where no economic fundamentals, and the bottom panel is the case where additional economic fundamentals are involved. For both cases, realized volatility is strongly correlated with policy uncertainty originating from the US rather than from Korea. Realized volatility is less persistent for the short horizon, and it makes
This series of empirical exercises confirms that economic policy uncertainty in the US is an important driver of Korea-US exchange rate uncertainties. These findings hold for different horizons and different specifications, suggesting the importance of considering economic policy uncertainty in explaining the Korean currency risk beyond other macro variables.
2. Currency Excess Returns and Economic Policy Uncertainty
In the previous section, we see that second moments of the Korean exchange rate can be explained by policy uncertainty in the US. Now, we examine the effect of policy uncertainty in the US on the risk premium in the Korean won.
We first visualize the relationship between policy uncertainty and excess return for holding the Korean won. We divide the sample into two subsamples depending on the value of EPU in each country, with the lower EPUs in one and the higher in the other. Then, annualized percentage mean excess returns from each subsample are calculated and displayed in Figure 5. This figure shows that investors receive a negative excess return for holding the Korean won when policy uncertainty in the US or Korea is high, whereas investors earn a high positive excess return when the policy uncertainties are low. While this practice is simple, it clearly shows the relationship between economic policy uncertainty and excess return for the Korean won. Times of high economic policy uncertainty are those when investments in the Korea won by borrowing USD perform poorly. Moreover, we should note that interest rate differentials are larger when EPUs are high, but the total return (i.e., the excess return for holding the Korean won) is negative. This means when policy uncertainty is high, a relatively high interest rate in Korea is not sufficient to prevent investors from unwinding their positions, which accelerates the depreciation of the Korean won.
We then test the relationship between excess returns in holding the Korean won and economic policy uncertainty in the US. Della Corte et al. (2016) discover that volatility risk premia have predictive ability for currency excess returns, and volatility risk premia are not highly correlated with EPU indices. Thus, we include the volatility risk premium as an additional regressor to prevent a potential omitted variable problem. Also, Beber et al. (2010) use a similar regression model to investigate the role of the dispersion of beliefs on carry trade. We, therefore, adjust their equation by replacing dispersion of beliefs with economic policy uncertainty indices as below:

where excess return for holding Korean won is calculated as 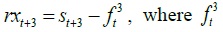 is 3-month forward rates at time t, and
We perform additional empirical work to test if the EPU has an impact on the risk premium based on the level of risk tolerance. The logic is that investors infrequently revise their tolerance in response to news on the EPU in the US, but when they do revise, they unwind their positions and an exchange rate correction occurs. To test this situation, we divide the sample according to the level of risk tolerance. We use the sign of lagged performance of the currency returns11 to isolate low tolerance, considering that the decrease in risk tolerance is known to be larger when investors have positive lagged returns.
Panel B in Table 6 shows the results from equation (12) conditional on risk tolerance. When lagged returns are positive, which represents the cases with low levels of risk tolerance, the impacts of economic policy uncertainty in the US on excess returns for investing in Korea are statistically significant. In contrast, when carry returns are negative, the significant relationship between EPU in the US and carry returns disappears. This result suggests that EPUs in the US are important determinants of risk tolerance and thus have a large impact on the excess return for holding the Korean won in certain situations.12
We extend this analysis by using a quantile regression model. Whereas the OLS regression estimates the approximation of the conditional mean of the dependent variable given predictors, the quantile regression investigates the predictive ability of predictors for the entire distribution of the dependent variable. Thus, it enables us to get a more complete picture of the predictive ability of the EPU for currency excess returns. In particular, we see that policy uncertainty plays a different role in periods of low risk tolerance, which the linear regression approach fails to capture. The theoretical model proposed by Pastor and Veronesi (2012) and empirical evidence suggested by Kelly et al. (2016), as well as our trial for high liquidity problems, all consistently demonstrate that asset prices and their risk premia respond to policy uncertainty asymmetrically. Hence, we estimate the relationship between the EPU in the US and carry trade returns using a quantile regression approach as below:

where Qrx (τ|.) is the τth quantile of excess returns given information available at time t. Table 7 reports the results from the quantile regression. Our finding is that policy uncertainty in US has significant predictive ability for carry trade returns for the Korean won at lower quantiles, while this predictive ability disappears at the median or upper quantiles. When it comes to severe loss in carry trade (i.e., bottom 20% quantile), the increase of the EPU in the US predicts greater losses, while a high EPU in Korea predicts recovery for investors. These results are in line with the previous exercise with the subsample depending on the risk tolerance. Results from the quantile regression confirm that the EPU in the US enters the pricing kernel and is priced in the currency excess return for holding the Korean won.
A possible explanation for the asymmetric response to US EPU and Korea EPU can be given based on the results of directional spillovers in previous section. We show that US policy uncertainty typically originates from domestic issues, while Korea policy uncertainty usually comes from other countries’ issue. In this regards, investors might put more weight on the importance of US policy uncertainty than that of Korean policy uncertainty, since the behavior of Korea EPU is expected to be following the movements of US EPU. Note that it is one of the possible explanation and more work is needed to improve our understanding of mechanism through which asymmetric response of market on policy uncertainties in two countries.
8)See
9)In the term structure model, the conditional variance of the depreciation rate can be expressed in terms of the conditional variance of the difference between the logarithms of the two country’s stochastic discount factors
10)Instead of volatility of relative value of economic variables between two countries, volatility of each country’s inflation and output growth are inserted into the regression as the robustness check. The estimated results appear largely robust for alternative measure of macroeconomic uncertainties.
11)See
12)
IV. CONCLUSION
In this paper, we analyze the impact of policy uncertainty in the US on policy uncertainty in Korea as well as on KRW/USD exchange risk. Using Baker et al.’s (2016) Economic Policy Uncertainty Index, we obtain two important results. First, we show that the degree of spillovers of policy uncertainty from the US to Korea is not great, and is like the degree of spillover from other countries. But the main difference is that spillovers from other countries (i.e., Japan, Germany, and UK) vary over time, whereas spillovers from the US remain at a constant level during the sample period. Second, we show that economic policy uncertainty in the US is a risk factor for the Korea FX market. Our findings demonstrate that US uncertainty should be considered as a risk measure for the foreign exchange market more so than Korea policy uncertainty and current fundamentals. This empirical finding can be useful for practitioners and policy makers, who are interested in forecasting exchange rate under the circumstance in which exchange rate determinants are still elusive. Additionally, the monitoring the behavior of US policy uncertainty could provide helpful information for the policy decision, such as stabilizing short-run Korea-US exchange rates.
Tables & Figures
Table 1.
Summary Statistics for the Policy Uncertainty Index
Note: This table presents summary statistics for economic policy uncertainty index for each country. Data are monthly from 1998M01 to 2016M08. The Granger causality test are computed from 10-order bivariate VARs
Figure 1.
Policy Uncertainty Indices
Note: This figure shows the standardized spillover indices for the 5 countries in our sample. The sample starts in January 1998 and ends in December 2016.
Figure 2.
Aggregate Dynamic Spillovers
Note: This figure shows the aggregate dynamic spillovers estimated with a rolling window of 60 months.
Figure 3.
Total from and Total to Dynamic Spillovers
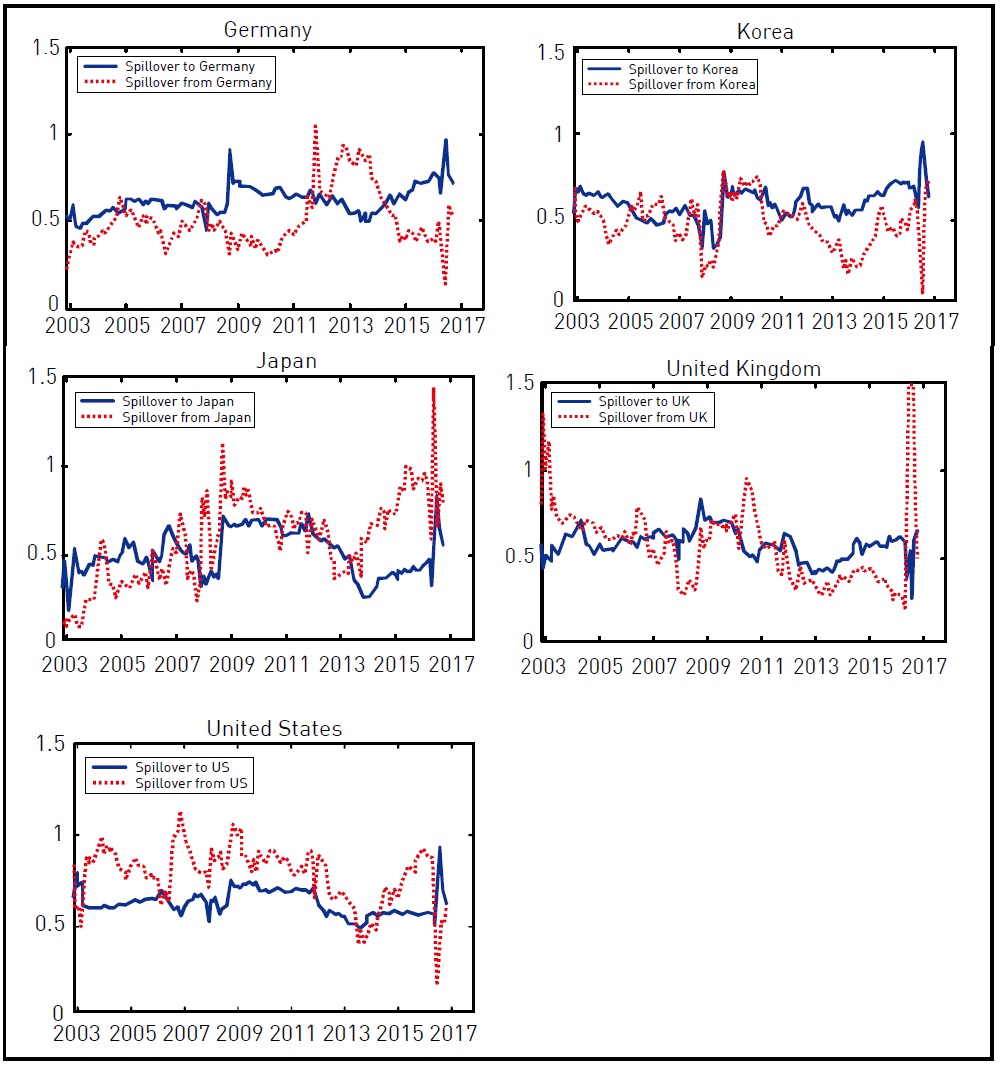
Note: This figures shows the average Total from and Total to dynamic spillovers for all countries estimated with a rolling window of 60 months. The difference between the two lines represents the net spillovers.
Figure 4.
The Proportion of Directional Spillovers: To Korea
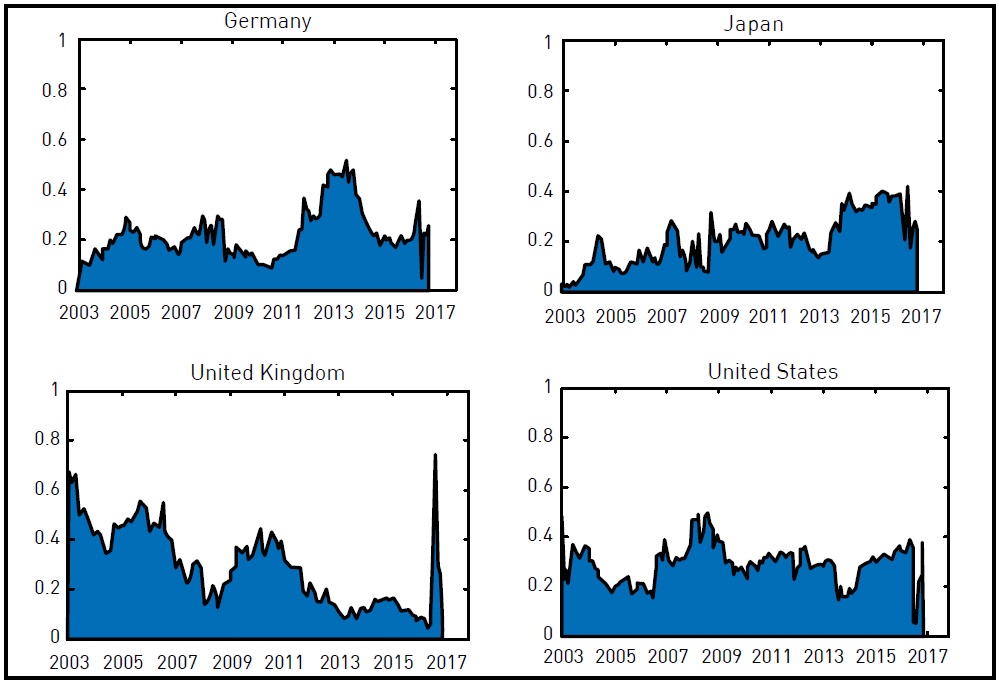
Note: This figure illustrates the proportion of directional spillover from each of the four countries to Korea. The sum of the proportion of four countries at each point of time equals to one.
Table 2.
Summary Statistics for Implied Volatility and Realized Volatility
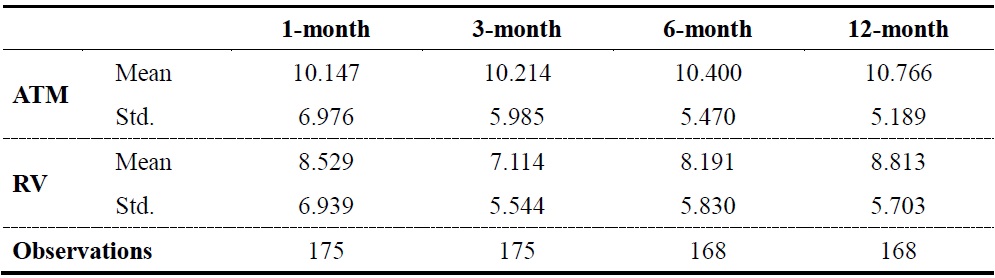
Note: This table presents the summary statistics for the at-the-money implied volatility (ATM) and the realized volatility (RV). The data are sampled at a monthly frequency from September 2002 to November 2016.
Table 3.
Implied Volatility and Economic Policy Uncertainty
Note: This table shows the results of estimating the following regression:  where
where  and volatility of inflation differentials
  The data is monthly from September 2002 to November 2016. ***, **, and * denote the statistical significance at the 1%, 5%, and 10% level, respectively.
Table 4.
Forecasting Implied Volatility with Economic Policy Uncertainty
Note: This table shows the results of estimating the following regression:  where
where  and volatility of inflation differentials
  The data is monthly from September 2002 to November 2016. ***, **, and * denote the statistical significance at the 1%, 5%, and 10% level, respectively.
Table 5.
Realized Volatility and Economic Policy Uncertainty
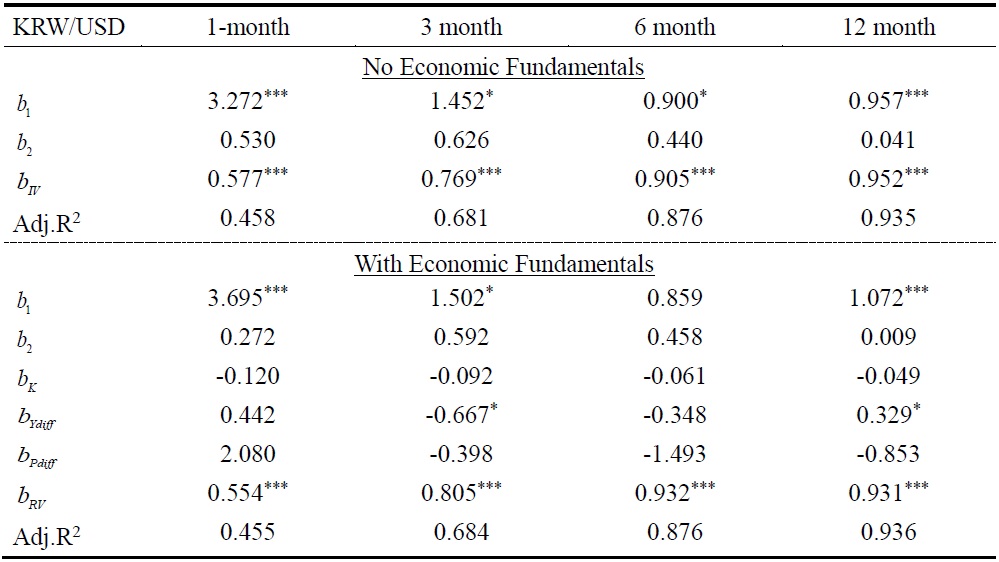
Note: This table shows the results of estimating the following regression:  where
where  and volatility of inflation differentials
  The data is monthly from September 2002 to November 2016. ***, **, and * denote the statistical significance at the 1%, 5%, and 10% level, respectively.
Figure 5.
Carry Trade Returns Conditional on the EPU
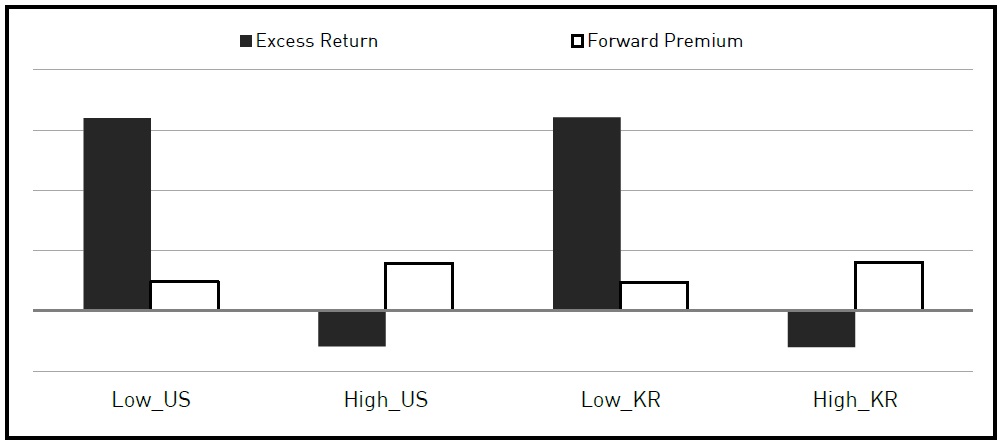
Note: This plot shows average total carry trade returns when economic policy uncertainty is low or high. For all measures, low (high) is bottom (top) quartile.
Table 6.
Currency Excess Returns and Economic Policy Uncertainty
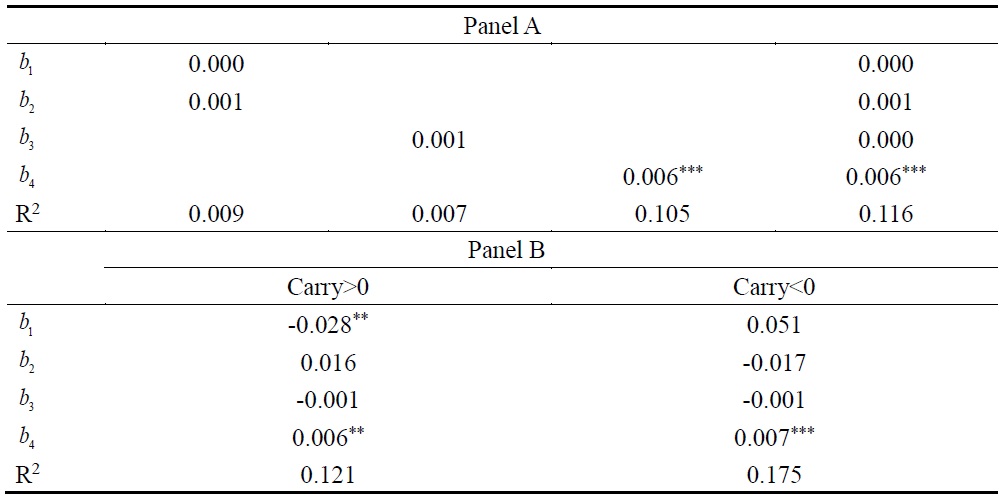
Note: Panel A shows the results of estimating the following regression:  where
where
Table 7.
Quantile Regression for the Currency Excess Returns
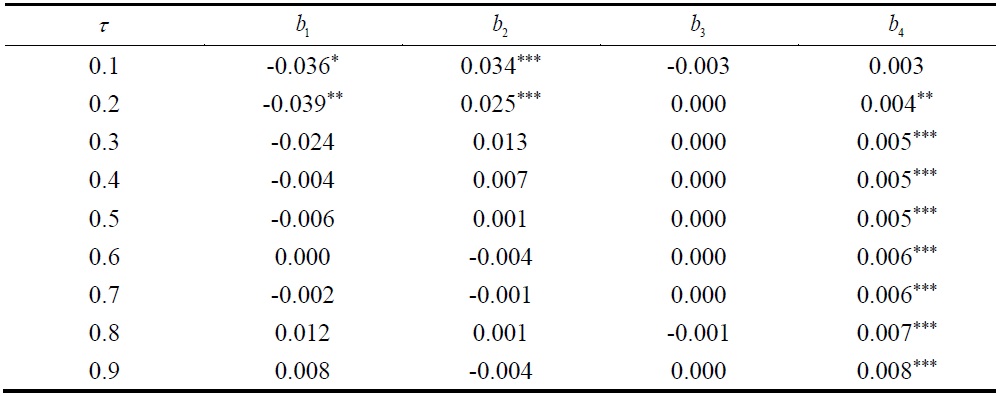
Note: This table shows the results of quantile regression estimates the following regression:  where
where
References
-
Acharya, V., Engle, R. and M. Richardson. 2012. “Capital Shortfall: A New Approach to Ranking and Regulating Systemic Risks,”
American Economic Review , vol. 102, no. 3, pp. 59-64.
- Acharya, V., Pedersen, L., Philippon, T. and M. Richardson. 2010. “Measuring Systemic Risk,” Manuscript, Stern School, New York University.
- Adrian, T. and M. Brunnermeier. 2011. CoVaR. NBER Working Paper, no. 17454.
-
Andersen, T., Bollerslev, T., Diebold, F. and P. Labys. 2003. “Modeling and Forecasting Realized Volatility,”
Econometrica , vol. 71, no. 2, pp. 579-625.
-
Backus, D. K., Foresi, S. and C. I. Telmer. 2001. “Affine Term Structure Models and the Forward Premium Anomaly,”
Journal of Finance , vol. 56, no. 1, pp. 279-304.
-
Baker, S. R., Bloom, N. and S. J. Davis. 2016. “Measuring Economic Policy Uncertainty,”
Quarterly Journal of Economics , vol. 131, no. 4, pp. 1593-1636.
-
Beber, A., Breedon, F. and A. Buraschi. 2010. “Differences in Beliefs and Currency Risk Premiums,”
Journal of Financial Economics , vol. 98, no. 3, pp. 415-438.
-
Bijsterbosch, M. and P. Guerin. 2013. “Characterizing Very High Uncertainty Episodes,”
Economics Letters , vol. 121, no. 2, pp. 239-243.
-
Bloom, N. 2009. “The Impact of Uncertainty Shocks,”
Econometrica , vol. 77, no. 3, pp. 623-685.
-
Born, B. and J. Pfeifer. 2014. “Policy Risk and the Business Cycle,”
Journal of Monetary Economics , vol. 68, pp. 68-85.
-
Brogaard, J. and A. Detzel. 2015. “The Asset-Pricing Implications of Government Economic Policy Uncertainty,”
Management Science , vol. 61, no. 1, pp. 3-18.
- Brunnermeier, M., Nagel, S. and L. Pedersen. 2008. Carry Trades and Currency Crashes. NBER Working Paper, no. 14473.
-
Brunnermeier, M. and L. Pedersen. 2009. “Market Liquidity and Funding Liquidity,”
Review of Financial Studies , vol. 22, no. 6, pp. 2201-2238.
-
Colombo, V. 2013. “Economic Policy Uncertainty in the US: Does it Matter for the Euro Area?,”
Economics Letters , vol. 121, no. 1, pp. 39-42.
-
Della Corte, P., Ramadorai, T. and L. Sarno. 2016. “Volatility Risk Premia and Exchange Rate Predictability,”
Journal of Financial Economics , vol. 120, no. 1, pp. 21-40.
-
Diebold, F. X. and K. Yilmaz. 2009. “Measuring Financial Asset Return and Volatility Spillovers, with Application to Global Equity Markets,”
Economic Journal , vol. 119, no. 534, pp. 158-171.
-
Diebold, F. X. and K. Yilmaz. 2012. “Better to Give han to Receive: Predictive Directional Measurement of Volatility Spillovers,”
International Journal of Forecasting , vol. 28, no. 1, pp. 57-66.
-
Diebold, F. X. and K. Yilmaz. 2014. “On the Network Topology of Variance Decompositions: Measuring the Connectedness of Financial Firms,”
Journal of Econometrics , vol. 182, no. 1, pp. 119-134.
- Farhi, E., Fraiberger, S., Gabaix, X., Ranciere, R. and A. Verdelhan. 2009. Crash Risk in Currency Markets. NBER Working Paper, no. 15062.
-
Friedman, M. 1968. “The Role of Monetary Policy,”
American Economic Review , vol. 58, no. 1, pp. 1-17. - Grad, D. 2010. “Foreign Exchange Risk Premia and Macroeconomic Announcements: Evidence from Overnight Currency Options,” Unpublished Dissertation Chapter.
- Guimaraes-Filho, R. and G. H. Hong. 2016. Dynamic Connectedness of Asian Equity Markets. IMF Working Paper, no. 16/57.
-
Gulen, H. and M. Ion. 2016. “Policy Uncertainty and Corporate Investment,”
Review of Financial Studies , vol. 29, no. 3, pp. 523-564. -
Hassett, K. A. and G. E. Metcalf. 1999. “Investment with Uncertain Tax Policy: Does Random Tax Policy Discourage Investment?,”
Economic Journal , vol. 109, no. 457, pp. 372-393.
-
Kelly, B., Pastor, L. and P. Veronesi. 2016. “The Price of Political Uncertainty: Theory and Evidence from the Option Market,”
Journal of Finance , vol. 71, no. 5, pp. 2417-2480.
-
Klößner, S. and R. Sekkel. 2014. “International Spillovers of Policy Uncertainty,”
Economics Letters , vol. 124, no. 3, pp. 508-512.
-
Koop, G., Pesaran, M. H. and S. M. Potter. 1996. “Impulse Response Analysis in Nonlinear Multivariate Models,”
Journal of Econometrics , vol. 74, no. 1, pp. 119-147.
- Leduc, S. and Z. Liu. 2015. Uncertainty Shocks are Aggregate Demand Shocks. Federal Reserve Bank of San Francisco Working Paper, no. 2012-10.
-
Lyons, R. 1998. Options and the Currency Risk Premium. In Chen, Z. (ed.)
Currency Options and Exchange Rate Economics . Singapore: World Scientific. pp. 94-107. -
Meese, R. and K. Rogoff. 1983. “Empirical Exchange Rate Models of the Seventies,”
Journal of International Economics , vol. 14, no. 1-2, pp. 3-24.
-
Pastor, L. and P. Veronesi. 2012. “Uncertainty About Government Policy and Stock Prices,”
Journal of Finance , vol. 67, no. 4, pp. 1219-1264.
-
Pesarana, H. H. and Y. Shin. 1998. “Generalized Impulse Response Analysis in Linear Multivariate Models,”
Economics Letters , vol. 58, no. 1, pp. 17-29.
-
Rodrik, D. 1991. “Policy Uncertainty and Private Investment,”
Journal of Development Economics , vol. 36, no. 2, pp. 229-242.
-
Schwert, W. 1989. “Why Does Stock Market Volatility Change Over Time?,”
Journal of Finance , vol. 44, no. 5, pp. 1115-1153.