



- EAER>
- Journal Archive>
- Contents>
- articleView
Contents
Citation
| No | Title |
|---|---|
| 1 | Exchange rate spillovers in the CIS / 2024 / Eurasian Economic Review / vol.14, no.2, pp.539 / |
| 2 | Do China's policy measures for RMB internationalization foster currency co-movements? / 2024 / International Review of Economics & Finance / vol.91, pp.1033 / |
| 3 | The effects of the counter-cyclical factor on renminbi co-movements / 2025 / Journal of International Financial Markets, Institutions and Money / vol.101, pp.102144 / |
Article View
East Asian Economic Review Vol. 24, No. 1, 2020. pp. 31-59.
DOI https://dx.doi.org/10.11644/KIEP.EAER.2020.24.1.371
Number of citation : 3View
101
Download
113



What Drives Growing Currency Co-movements with the Renminbi?
|
|
Kyung Hee University |
|---|---|
|
|
Kyung Hee University |


Abstract
China’s increasing trade volume and continuous integration with global financial markets have strengthened the influences of the renminbi on the exchange rates of different currencies. Previous studies find closer co-movements between the renminbi and other currencies. This paper is novel to investigate the underlying determinants of the comovement further, using panel data of over thirty-four countries. Our results show that stronger bilateral trade and financial linkages with China have a positive association with the currency co-movement. Moreover, countries with greater flexibility in exchange rate regimes show stronger co-movements. These findings imply that growing co-movements are the consequence of autonomous decisions at the market rather than that of management by governments or central banks.
JEL Classification: F31, F33, F36
Keywords
Currency Co-movements, Renminbi, Trade Linkage, Financial Linkage, Exchange Rate Regime
I. INTRODUCTION
China has increased its influence on the global economy in the real sector, such as production and trade. Recently, many studies report that the renminbi (RMB), the currency of China, also exerts strong influences on the value of other currencies, particularly in Asia. These influences are confirmed by growing exchange rate co-movements between the RMB and other currencies, shortly currency co-movements with the RMB. Discussions on the growing influence of the RMB lead to debates on the possibility of a regional RMB bloc and, further, of becoming an international vehicle currency in the future. These discussions are much akin to those on the formation of the yen bloc in Asia examined in Frankel and Wei (1994).
However, it should be noted that the degrees of currency co-movements with the RMB vary across countries. Within Asia, for instance, Kawai and Pontines (2016, Table 1) show that the co-movements with the RMB in the Philippines is much weaker than in Korea. Moreover, the co-movements witness significant variations in their degree over time. In particular, after the global financial crisis of 2008, the degree has grown in many countries.1 This study goes further by examining what factors affect the magnitude of the currency co-movements with the RMB.
The theory of optimum currency areas (OCA) suggested by Mundell (1961) can be the starting point for this study. A common currency area is a currency bloc where member countries share a single currency or where the value of the currency in all member countries is pegged to an anchor currency to make perfect co-movements each other. Mundell (1961)’s model and its extended versions suggest several criteria for an optimum currency area (currency pegging or perfect currency co-movement) such as labor mobility, capital mobility, and trade.
Under these theoretical frameworks, we conduct empirical analyses to examine the underlying factors of currency co-movements using country panel data. The results provide the implications on the possibility for the RMB to form a currency bloc and more to be an international currency. Our findings are as follows. First, in many economies, their currencies witnessed significantly stronger co-movements with the RMB after the 2008 Global financial crisis (GFC). Second, bilateral trade linkage with China has a positive association with the currency co-movement with the RMB, which is in line with the previous studies. Third, bilateral financial linkage proxied by portfolio investment in and out of China turns out to relate to the currency co-movement despite still tight controls over the investment. Previous literature discussed little in the roles of financial linkage with China due to a lack of data. Thus, our findings are noble and critically contribute to the literature. Fourth, economies with greater flexibility in exchange rate regimes show stronger currency co-movements with the RMB. This finding implies that growing co-movements are the consequence of autonomous decisions at the market rather than that of management by governments or central banks, which is also distinct from the conventional wisdom. Last, currency co-movement is not restricted to China’s neighboring countries or the Asian region. This global co-movement suggests that the RMB is more likely to become an international currency than to form a regional currency bloc in the future.
Section 2 calculates the degree of currency co-movement with the RMB and shows the growing influences of the RMB on the value of other currencies. Section 3 discusses the theoretical framework and the possible underlying factors of the currency co-movement. Section 4 explains the empirical model and the data for analyses. Section 5 presents the empirical results and interprets the main findings. Finally, section 6 concludes the paper.
1)Please refer to
II. GROWING CURRENCY CO-MOVEMENTS WITH THE RMB
Frankel and Wei (1994) develop a model to estimate the weights of international reference (or anchor) currencies in implicit or explicit currency baskets. In their model, a movement of a country’s exchange rate depends on international currencies’ movements, and the estimated coefficients are widely interpreted as the magnitude of influence (or currency co-movements) of each currency. Subramanian and Kessler (2013) and Kawai and Pontines (2016) estimate the influence of the RMB on other currencies by including the RMB movements in the right-hand side of Frankel and Wei (1994) model. In equation (1), similar to their methodology, we estimate currency co-movements with the RMB.

where  is the exchange rate returns of a country’s currency i at time t. The equation (1) is estimated at each currency i. The model includes exchange rate returns of four international reference currencies on the right-hand side: Yuan (RMB), Euro (EUR), Japanese Yen (JPY), and US dollar (USD). The exchange rates are measured against a common numeraire. We adopt the Swiss franc (CHF) as the numeraire to control for the influence of the USD. We also control for the effects of global financial uncertainty by including the changes of VIX (the Chicago board options exchange volatility index). The daily returns of exchange rates and VIX (
 Δ
Δ is the RMB co-movement coefficient of currency i. In our analysis, thirty-four currencies’ co-movements with the RMB are calculated using the equation (1).2
Kawai and Pontines (2016) point out that the equation (1) embeds the problem of multicollinearity due to a strong correlation between the movements in the US dollar and the RMB when the RMB was pegged to the US dollar. Thus, when estimating the coefficients, we choose only periods when the RMB was not pegged to the US dollar. In July 2005, China changed to the managed exchange rate regime from the fixed peg. However, during the GFC, the RMB was temporarily repegged to the USD. The un-pegged periods are from July 2005 to June 2008 for the pre-GFC and July 2010 to December 2018 for the post-GFC.
First, we determine whether there is a significant change in co-movements before and after the GFC for our sample currencies. Table 1 columns (1)-(2) show  before and after GFC of all currencies in the sample and the last column presents the difference of
  between them. The majority of the currencies show stronger co-movements with the RMB after the GFC. Twenty-eight currencies show the statistical significance in positive co-movement, and eighteen currencies increase the value of coefficients, maintaining the significance. Polish zloty and Israeli new shekel lessen the co-movements with the RMB significantly. Besides, we calculate co-movement coefficients
  in each quarter to present the dynamics of the co-movement with the RMB. Later, we construct the thirty-four country (currency) panel data using the time-varying co-movement coefficients and other variables. Figure 1 displays the trend of the quarterly co-movement coefficients for eight selected currencies in different regions. They all show steadily positive values after the GFC. However, as we discussed in the previous section, the dynamics of the co-movement with the RMB vary across economies.
2)We obtain daily exchange rates from the BIS (the Bank for International Settlements) website. Initially, the BIS data covers 60 countries excluding Eurozone. Among them, we exclude 15 currencies that are pegged to other currency. Pegged currencies have only one currency, anchor, say the US dollar, in their currency basket, which has 100% weight. Thus, the RMB’s weight in those currencies is zero. Moreover, six currencies with few observations are dropped. After taking out the five international currencies (RMB, EUR, JPY, USD, CHF) in the regressions, 34 currencies’ co-movements with the RMB are estimated.
III. THEORETICAL FRAMEWORK
As found in section 2, previous studies also observe growing co-movements with, or stronger influences of the RMB on many other currencies in the recent years (Ito, 2010; Pontines and Siregar, 2012; Shu et al., 2015; McCauley and Shu, 2019; Keddad, 2019). Some conclude that beyond merely stronger co-movements, an RMB bloc has been emerging in Asia. This RMB block discussion means that the RMB became the dominant currency, by its weight exceeding the weight of the US dollar in implicit or explicit currency baskets of some Asian economies (Ho et al., 2005; Henning, 2012; Fratzscher and Mehl, 2014). On the contrary, others present evidence that the RMB is still less influential than the US dollar in most Asian economies, although it is more influential than before. That is, a renminbi bloc is too early to tell (Kawai and Pontines, 2016; Kim et al., 2018).
All the studies present the evidence of growing co-movements with the RMB, albeit to a different degree, but few studies explain what causes growing currency co-movements. Neither examines why currencies show different magnitudes in the currency co-movement. Just some studies conjecture that China’s growing trade share over time and different geographical distance to China among countries could determine the magnitudes. This study aims to fill this gap through a rigorous empirical analysis.
The majority of previous studies tend to explain the currency co-movement with trade linkage between countries. Frankel and Wei (1994) first examined if a yen bloc was created by calculating the weight assigned to the Japanese yen in the currency baskets of the Asian economies. They assumed that Japan’s increased trade shares would lead to the increased weight of the yen, producing stronger currency co-movements. This assumption is based on the idea that massive trade partners of Japan want to stabilize exchange rates by linking their currencies to the yen. Although they did not find the trade linkage effects for the yen, the idea to relate the currency co-movement to bilateral trade linkage remains steady. Some attempt to explain higher weights of the RMB in the currency baskets of Asian countries with China’s increased trade shares in the region (Eichengreen and Lombardi, 2017; Kim et al., 2018; Keddad, 2019). Their rationales are also based on the same idea in Frankel and Wei (1994), i.e., the stabilization of the value of the currency against the primary trade partner. However, they present supposition without empirical evidence. Fratzschner and Mehl (2014) is the only study that attempts to find underlying causes of the growing influence of the RMB through data analysis. Their results from a cross-country analysis show an inconsistent relationship between trade or finance linkages and China’s currency influence, measured as the responsiveness to China’s exchange rate policies.
The scarcity of empirical studies on the underlying causes of the currency co-movement relates to the absence of an established theory on that issue. Before theories are developed, it is appropriate to start from discussions of the OCA theory. According to the OCA theory, an important determinant of whether a country participates in a common currency area is the potential reduction in transaction costs. In a currency bloc, a relaxed version of the common currency area, an anchor currency is chosen, and then, the values of other currencies perfectly co-move with that of the anchor currency. Although this anchor currency example is an extreme case of the currency co-movement, the determinants of the choice of an anchor currency are likely similar to underlying causes of the currency co-movement. Following the OCA theory, the studies on the currency bloc assume that currency to minimize the transaction costs is determined as an anchor. The transaction costs include the cost due to the uncertainty of exchange rates. Therefore, it is optimal for a member country to choose the currency of its largest trading partner. Such a choice can also alleviate the difficulties from the limited autonomy of the monetary policy due to currency pegging because strong bilateral trade linkage produces synchronized business cycles between two countries.
Consequently, the currency of the largest trade partner will be the anchor for other currencies in a peg system or a currency bloc and be the currency with which other currencies highly co-move in floating exchange rate regimes. This trade linkage effect creates network externalities or positive feedback effects to incentivize the third country to participate in the currency bloc (Yehoue, 2004). This approach is in the same line with Frankel and Wei (1994). This transaction cost approach can be extended to financial linkage effects, suggesting that the currency of a country with more financial transactions is more likely chosen as an anchor.
Following this theoretical framework, some empirically study on the determinants of anchor currency choice and participation in a currency bloc. Meissner and Oomes (2009) and Fischer (2016) examine the dollar and former European currencies such as the Mark and the Franc as anchor currencies and find consistent and expected results on trade linkage. For financial linkage, however, Meissner and Oomes (2009) only find ambiguous results.
Given a limited number of previous empirical works, this study contributes to the literature by examining which underlying factors affect the co-movement with a currency in question, i.e., the RMB. We mainly focus on trade and financial linkages, following the theoretical framework of transaction costs.3 A country that has stronger trade or financial linkage with China is expected to reveal greater co-movements with the RMB. In the analysis, we control for inflation rates and interest rates because they also affect exchange rates in non-fixed exchange rate regimes. If a country’s monetary policy is highly synchronized with China’s to produce similar variations in inflation rates and interest rates, two countries will show strong currency co-movements,
3)The variable of business cycle correlations, a determinant of the OCA formation, is deliberately not included in our estimations, considering very high correlations between trade links and business cycle synchronization (
IV. EMPIRICAL METHODOLOGY
1. Model
In this section, we mainly focus on the roles of trade and finance linkages with China in the currency co-movements with the RMB, as discussed in section 3. The empirical analysis employs a country-panel data model that can measure two aspects of panel data relationship: time-varying and time-invariant factors. First, main regressors such as trade and finance linkages with China have dramatically increased since the GFC. Moreover, Table 1 confirms the time-variant changes of currency co-movements with the RMB. The panel data represents those time-varying effects. Second, unobserved time-invariant factors (such as culture, history, etc.) can influence the roles of trade and finance linkages with China. We consider those relationships in empirical models by applying the country-panel data.
In the analysis, we employ the Driscoll and Kraay (1998)’s nonparametric covariance matrix estimator. The Driscoll and Kraay (1998) estimator produce heteroscedasticity consistent standard errors when there is cross-sectional and temporal dependence, which is the characteristics of our country panel data. Driscoll and Kraay’s standard errors are adjusted for country-pair-level heteroskedasticity and autocorrelation. The base empirical model for estimation is:

In equation (2),  in section 2) using the daily BIS nominal exchange rates dataset. We choose the quarterly frequency 1) because higher frequency such as monthly or daily requires overlapping window between time intervals in equation (1) regressions, and 2) the available high frequency of economic variables is quarterly.
  is a vector of control variables which will be discussed later in this section. The quarterly country panel data with
2. Trade and Financial Linkages
The absence of studies on determinants of currency co-movement contrasts with abundant studies on business cycle co-movement (Ductor and Leiva-Leon, 2016, etc.). Given few studies on the former, this paper applies the discussions on business cycle co-movement to the currency co-movement. As major determinants or channels of business cycle co-movement, trade and financial linkages have been examined carefully (Frankel and Rose, 1998; Kose et al., 2003; Imbs, 2004; Shin and Sohn, 2006; Pyun and An, 2016).

We can expect that an economy with a more profound trade linkage to China will show stronger currency co-movement because it is much affected by the Chinese economy. Many studies find that bilateral trade linkage causes the business cycle synchronization with an increased intra-industry trade (Shin and Sohn, 2006; Inklaar et al., 2008; Duval et al., 2016). The synchronization of the business cycle, a fundamental factor of exchange rates, may lead to the currency co-movement.


A deep financial linkage or more capital holdings will affect the degree of currency co-movement, similar to the trade linkage effect.
3. Control Variables
We consider other potential determinants such as the similarity of monetary policy, the flexibility of the exchange rate system in China and counterpart economies, and financial risk in China. The subscripts, i and t, are omitted for simplicity of expression.
Table 2 presents the summary statistics of the variables described above. The number of observations with non-missing
4)One might suggest to use GDP instead of total trade in normalizing the bilateral trade linkage. In our robustness tests, we calculate the bilateral trade over GDP and find similar results. However, when using the bilateral trade over GDP, we find that trade and economic variables over GDP are highly correlated. To avoid the multicollinearity issues, we mainly report results using the bilateral trade as a percentage of total trade.
V. EMPIRICAL RESULTS AND DISCUSSIONS
1. Results from FDI Stocks as Financial Linkage
Table 3 shows the results from pooled OLS models where the shares of China in total trade and FDI (foreign direct investment) are used as the indicators of trade and financial linkages, respectively. Model (1) ~ (3) show positive and significant coefficients for trade linkage, meaning that a country that trades with China more as a percentage of total trade shows stronger currency co-movements with the RMB. This outcome is consistent with the theories of OCA and the anchor currency choice. However, it is notable that bilateral FDI stocks turn out to be not significant in explaining the currency co-movement. To check the sensitivity of the results, model (4) ~ (6) incorporate control variables. The control variables for the similarity of monetary policies, i.e., differences of changes in interest rates (
As well, we note that the degree of currency co-movement can also be affected by the flexibility of exchange rate regimes in China and counterpart countries. Model (5) and (6) control for this effect. We use
With regard to the flexibility of the RMB exchange rates, China returned to the managed floating system after the GFC and widened the daily fluctuation band from ±0.5% to ±2.0% step by step. The most notable shift appeared in August 2015 when the People’s Bank of China (PBC) announced a transition to the
Table 4 displays the results from fixed-effect models that control for time-specific or country-specific heterogeneity. Model (1) and (2) apply time-fixed effects assuming that there are common factors all the countries encounter in each quarter. This assumption is relevant because China frequently introduced slight changes in its exchange rate policies or big devaluations to which all other currencies were commonly exposed. Therefore, it is reasonable to consider these unobserved time-specific factors. In model (1),
2. Results from Portfolio Investment Stocks as Financial Linkage
In recent decades, China has rapidly increased FDI in overseas infrastructure and natural resource sectors, while in the opposite direction, foreign countries have carried out voluminous FDI in China to utilize its vast market and cheap labor. These FDI flows are part of long-term investment and deeply linked to real sectors, which possibly leads to a concern that
In Table 5, all the results are the same as the previous ones, except for portfolio investment stocks. Different from
It is a noble finding of our study that
3. Robustness Tests
There is a concern that multicollinearity can arise between the weights of anchor currencies calculated following Frankel and Wei (1994) when the Swiss franc or the SDR is used as numeraire. In particular, the RMB may have multicollinearity with the US dollar because the RMB was pegged to the US dollar for a long time and, after allowed to fluctuate, carefully managed to be stable against the dollar. To include both the RMB and the US dollar on the right-hand side of the equation may produce multicollinearity, which leads to the overestimated weight of the RMB (Ho et al., 2005; Fratzscher and Mehl, 2014; Kawai and Pontines, 2016). Confining the sample to the period for the RMB to float cannot be enough. As numeraire, therefore, we use the US dollar instead of the Swiss franc and recalculate the weight of the RMB or the co-movement coefficients, following Ho et al. (2005).
Table 7 displays the results from the regressions using the recalculated weights of the RMB. The effects of trade linkages are the same as the earlier results, though they lose the significance in the country-fixed-effect models. Remarkably, portfolio investment stocks continue to have significant and positive effects on currency co-movement. We can conclude that the possible multicollinearity of the RBM with the US dollar does not change the primary findings of the study.
Another test for robustness adds the overall openness of trade and capital flows to control variables. It is to allow for channels to co-movements with the RMB through indirect links to the Chinese economy. That is, the Chinese economy can affect the exchange rates of other currencies through its impacts on the global economy. This indirect effect, if any, is expected to be stronger in an economy more open to the global economy. The openness is measured as trade and portfolio investment stocks as percentages of GDP. As shown in Table 8, the results are similar to the earlier ones.
4. Discussions
The primary findings of the study are that a country strongly tied with China in terms of trade and portfolio investment witnesses more synchronized currency movement with the RMB. Although the effect of trade linkages is expected from and consistent with the previous studies on related topics, it is a notable new finding that bilateral portfolio investment, part of financial linkages, turns out to have stronger effects than trade linkages. Now, we need to deliberate how bilateral trade and financial linkages lead to currency co-movements. Most of the literature on the common currency area or the anchor currency choice supposes that the connections between underlying factors or bilateral linkages and the currency co-movement are constructed through policy maker’s decisions or management. It is because the participation in a particular currency bloc or the choice of anchor currency belongs to the realm of policy decision making. Most studies using the equation in Frankel and Wei (1994) implicitly assume that the weights of anchor currencies or currency co-movements are determined as a result of intervention or policies by central banks. This assumption is understandable when we consider that initially, Frankel and Wei (1994) develop the equation to estimate the weight of each currency in the basket system, one of managed floating regimes. These studies explain that central banks keep the value of currency stable with that of major trading partners to minimize the uncertainty of exchange rates, consequently creating currency co-movements.
However, our findings challenge this conventional wisdom because the flexibility of exchange rate regimes shows consistently significant and positive coefficients, that is, stronger co-movements with the RMB in a country with a more flexible exchange rate regime. This result suggests that currency co-movements are the outcome of market operations rather than the central bank’s interventions. For instance, it is reasonable to interpret that strong co-movements of the Korean won or the Australian dollar with the RMB is generated through autonomous foreign exchange trading agents because Korea and Australia have virtually free-floating exchange rate regimes. Such reactions at foreign exchange markets are likely driven by the expectation that two countries’ economic fundamentals, such as growth rates, will change in a synchronized manner with China’s due to tight economic ties. In conclusion, increased economic integration with China may lead to currency co-movements with the RMB naturally, not intentionally. The positive coefficients of portfolio investment imply that financial linkages not less than trade linkages contribute to bilateral economic integration to cause currency co-movements.
5)Appendix
6)The exchange rate regime is time-varying variable in principle, but it is actually time-invariant because few countries changed their exchange rate regimes in the sample period. Thus, we don’t include the variable in country-fixed effect models.
VI. CONCLUSION
Empirical results show increased influences of the RMB on the value of other currencies after the GFC and further acceleration of the trend since China’s official transition to the currency basket system. Currency co-movements, an indicator of the influences, appear strongly in countries with tighter trade and financial linkages with China. Previous studies on the related topics such as the optimal currency area or the currency bloc little considered the effects of financial linkages, possibly because the theories were developed before capital account liberalization in emerging economies. In contrast, it is a contribution of this study to find that bilateral portfolio investment stocks work as an underlying factor of currency co-movements, at least for the RMB. Another remarkable finding is that currency co-movements are observed in countries with more flexible exchange rater regimes. This finding is not consistent with the previous literature to understand that currency co-movements are the result of central banks’ alignment or management of exchange rates. In particular, it implies that the growing influences of the RMB are the result of foreign exchange markets’ responses to increasing linkages to the Chinese economy. It is an interesting topic for future research whether those findings are also observed for other anchor currencies like the US dollar and the former German mark and French franc.
This study finds that trade linkage using gross trade data is a determinant of currency co-movement with RMB. The value-added trade data or the intra-industry trade structure may be another proxy variables for trade linkages. Future research should also consider whether they have an impact on currency co-movements.
The results of this study predict further growing influences of the RMB over the value of other currencies, given the expected progress toward a more flexible exchange rate regime and more liberalized capital flows in China, thus more financial linkages to overseas. As well, the influences of the RMB will not stay just as a regional phenomenon because its growing trade and financial linkages will be confined to Asian or neighboring countries.7
7)Though not reported in the paper, the geographical distance from China does not significantly affect the currency co-movement.
Tables & Figures
Table 1.
Currency Co-Movements with the RMB: The Pre/Post-GFC Periods

Table 1.
Continued
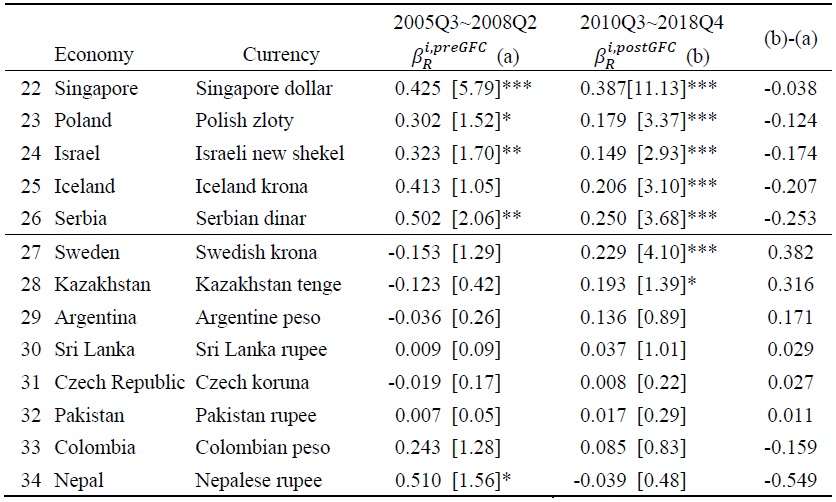
Note: The regression for each country follows the equation (1) for each sample period. The first section presents currencies based on (b)-(a) ranking, and both (a) and (b) are positive. This table reports only  to save spaces. [ ] shows t-values of
  *, **, and *** indicates 10%, 5%, and 1% significance level. Source: Authors’ calculation
Figure 1.
Trend of Currency Co-Movements with the RMB in Selected Economies

Figure 1.
Continued

Source: Authors’ calculation
Table 2.
Summary Statistics and Correlation Coefficients

Note: This table reports descriptive statistics of variables. The sample is country-quarter observations from 2010Q3 to 2018Q4 of 34 countries. C and Cus are the currency co-movements with the RMB of the exchange rate per Swiss franc and US dollar, respectively. The definitions of other variables are explained in the main text. Panel A shows the distribution of these variables. SD is the standard deviation, and P5 is the data point at 5% distribution. Panel B shows the correlation coefficients.
Table 3.
Trade and FDI: Pooled OLS

Note:
Table 4.
Trade and FDI: Fixed Effects

Note:
Table 5.
Trade and Portfolio Investment: Pooled OLS

Note:
Table 6.
Trade and Portfolio Investment: Fixed effects

Note:
Table 7.
Robustness Tests: Per Dollar

Note:
Table 8.
Robustness Tests: Trade and Financial Openness

Note:
Table A1.
Definition of Exchange Rate Regimes

Source:
References
-
Bank for International Settlements (BIS). <
https://www.bis.org > (accessed January 21, 2020) -
Driscoll, J. and A. C. Kraay. 1998. “Consistent Covariance Matrix Estimation with Spatially Dependent Data,”
Review of Economics and Statistics , vol. 80, no. 4, pp. 549-560.
-
Ductor, L. and D. Leiva-Leon. 2016. “Dynamics of Global Business Cycle Interdependence,”
Journal of International Economics , vol. 102, pp. 110-127.
-
Duval, R., Li, N., Saraf, R. and D. Seneviratne. 2016. “Value-added Trade and Business Cycle Synchronization,”
Journal of International Economics , vol. 99, pp. 251-262.
-
Eichengreen, B. and D. Lombardi. 2017. “RMBI or RMBR? Is the Renminbi Destined to become a Global or Regional Currency?”
Asian Economic Papers , vol. 16, no. 1, pp. 35-59.
-
Fischer, C. 2016. “Determining Global Currency Bloc Equilibria: An Empirical Strategy based on Estimates of Anchor Currency Choice,”
Journal of International Money and Finance , vol. 64, pp. 214-238.
-
Frankel, J. A. and A. K. Rose. 1998. “The Endogeneity of the Optimum Currency Area Criteria,”
Economic Journal , vol. 108, no. 449, pp. 1009-1025.
-
Frankel, J. A. and S. J. Wei. 1994. Yen bloc or dollar bloc? Exchange rate policies of the East Asian economies. In Ito, T. and A. O. Krueger. (eds.)
Macroeconomic Linkage: Savings, Exchange Rates, and Capital Flows . NBER-EASE Volume 3, Chicago: University of Chicago Press. pp. 295-333. -
Fratzescher, M. and A. Mehl. 2014. “China’s dominance hypothesis and the emergence of a tri-polar global currency system,”
Economic Journal , vol. 124, no. 581, pp. 1343-1370.
- Henning, R. 2012. Choice and coercion in East Asian exchange rate regimes. Peterson Institute for International Economics. Working Paper, no. 12-15.
-
Ho, C., Ma, G. and R. McCauley. 2005. “Trading Asian Currencies,”
BIS Quarterly Review , (March). pp. 49-58. -
Ilzetzki, E., Reinhart, C. M. and K. S. Rogoff. 2019. “Exchange Rate Arrangements Entering the 21st Century: Which Anchor will Hold?”
Quarterly Journal of Economics , vol. 134, no. 2, pp. 599-646.
-
Imbs, J. 2004. “Trade, Finance, Specialization, and Synchronization,”
Review of Economics and Statistics , vol. 86, no. 3, pp. 723-734.
-
Inklaar, R., Jong-A-Pin, R. and J. De Haan. 2008. “Trade and Business Cycle Synchronization in OECD Countries-A Re-Examination,”
European Economic Review , vol. 52, no. 4, pp. 646-666.
-
International Monetary Fund (IMF). <
http://data.imf.org > (accessed January 21, 2020) -
Ito, T. 2010. “China as Number One: How about the Renminbi?”
Asian Economic Policy Review , vol. 5, no. 2, pp. 249-276.
-
Kalemli-Ozcan, S., Sørensen, B. E. and O. Yosha. 2001. “Economic Integration, Industrial Specialization, and the Asymmetry of Macroeconomic Fluctuations,”
Journal of International Economics , vol. 55, no. 1, pp. 107-137.
-
Kawai, M. and V. Pontines. 2016. “Is there really a renminbi bloc in Asia?: A modified Frankel–Wei approach,”
Journal of International Money and Finance , vol. 62, pp. 72-97.
-
Keddad, B. 2019. “How Do the Renminbi and Other East Asian Currencies Co-Move?”
Journal of International Money and Finance , vol. 91, pp. 49-70.
-
Kim, C. S., Kim, S. and Y. Wang. 2018. “RMB bloc in East Asia: Too early to talk about it?”
Asian Economic Papers , vol. 17, no. 3, pp. 31-48.
-
Kose, M. A., Prasad, E. S. and M. E. Terrones. 2003. “How Does Globalization Affect the Synchronization of Business Cycles?”
American Economic Review , vol. 93, no. 2, pp. 57-62.
-
McCauley, R. N. and C. Shu. 2019. “Recent Renminbi Policy and Currency Co-Movements,”
Journal of International Money and Finance , vol. 95, pp. 444-456.
-
Meissner, C. M. and N. Oomes. 2009. “Why Do Countries Peg the Way They Peg? The Determinants of Anchor Currency Choice,”
Journal of International Money and Finance , vol. 28, no. 3, pp. 522-547.
-
Mundell, R. A. 1961. “A Theory of Optimum Currency Areas,”
American Economic Review , vol. 51, no. 4, pp. 657-665. -
Pontines, V. and R. Siregar. 2012. “Fear of Appreciation in East and Southeast Asia: The Role of the Chinese Renminbi,”
Journal of Asian Economics , vol. 23, no. 4, pp. 324-334.
-
Pyun, J. H. and J. An. 2016. “Capital and Credit Market Integration and Real Economic Contagion during the Global Financial Crisis,”
Journal of International Money and Finance , vol. 67, pp. 172-193.
-
Shin, K. and C. H. Sohn. 2006. “Trade and Financial Integration in East Asia: Effects on Co-Movements,”
World Economy , vol. 29, no. 12, pp. 1649-1669.
-
Shu, C., He, D. and X. Cheng. 2015. “One Currency, Two Markets: The Renminbi’s Growing Influence in Asia-Pacific,”
China Economic Review , vol. 33, pp. 163-178.
- Subramanian, A. and M. Kessler. 2013. The Renminbi Bloc is Here: Asia Down, Rest of the World to Go? Peterson Institute for International Economics. Working Paper, no. 12-19.
- Yehoue, M. E. B. 2004. Currency Bloc Formation as a Dynamic Process based on Trade Network Externalities. IMF Working paper, no. 04-222.