

- EAER>
- Journal Archive>
- Contents>
- articleView
Contents
Citation
| No | Title |
|---|---|
| 1 | Minimum Wage Effects on Gender Wage Gap in Türkiye / 2025 / Çalışma ve Toplum / vol.1, no.84, pp.223 / |
| 2 | How does minimum wage affect firm pollution discharges: Evidence from China / 2023 / Journal of Cleaner Production / vol.414, pp.137504 / |
| 3 | Legitimation and Perversity: A Comparison of the Politics of Minimum Wage Reforms in Japan and South Korea / 2024 / Asian Studies Review / vol.48, no.1, pp.159 / |
| 4 | Effects of the Minimum Wage (MW) on Income Inequality: Systematic Review and Analysis of the Spanish Case / 2024 / Economies / vol.12, no.9, pp.223 / |
| 5 | Sosyal Politika Aracı Olarak Asgari Ücret: Türkiye Üzerine Bir İnceleme / 2025 / Akademik Araştırmalar ve Çalışmalar Dergisi (AKAD) / vol.17, no.32, pp.72 / |
Article View
East Asian Economic Review Vol. 24, No. 3, 2020. pp. 253-273.
DOI https://dx.doi.org/10.11644/KIEP.EAER.2020.24.3.379
Number of citation : 5View
89
Download
144
Minimum Wages and Wage Inequality in the OECD Countries
|
|
Korea Institute for International Economic Policy |
|---|---|
|
|
Jeonbuk National University |

Abstract
This paper investigates the impact of the effective minimum wage, defined as the log difference between the minimum and the median wages, on wage inequalities in the OECD countries. Unlike the previous studies that focus on single countries in which the minimum wage has no cross-sectional variation and rely instead on within-country variations of wage distribution across regions or socio-economic characteristics, we use a country panel that allows for both cross-sectional and time-series variations in minimum wage. We also control for more factors than in the previous studies whose absence may cause endogeneity. Our results confirm the previous findings that increases in minimum wage alleviate the wage inequality at the lower tail of the wage distribution, while having little effect at the upper tail. The estimated effect is larger for women than for men, which is consistent with the fact that the share of workers who are directly affected by the changes in minimum wage is bigger among women than men. An application of the IVs of Autor, Manning and Smith (2016) supports the robustness of our findings.
JEL Classification: J23, J31, J381
Keywords
Minimum Wage, Wage Inequality, Effective Minimum Wage, Labor Demand, Labor Supply
I. INTRODUCTION
Minimum wage increase often provokes intense debates, as was the case in South Korea in 2018 when the government increased the statutory minimum wage by 16.4%.1 While the debates largely focus on its employment effect, it is known to, and intended to, affect inequality. For instance, DiNardo, Fortin and Lemieux (1996) and Lee (1999) show that the decline in real value of the U.S. federal minimum wage during the 1980s accounted for a large share of the concurrent increase in wage inequality, particularly for women.2 In a similar vein, Dickens and Manning (2004a, 2004b) show that the introduction of a national minimum wage in the U.K. in 1999 improved the inequality at the lower tail. Seong (2014) finds similar effect of minimum wage in Korea during 2008-2012.
This paper attempts to complement the existing literature on the impact of minimum wage on inequality, using the panel of those OECD countries that had statutory minimum wage during any time between 1960 and 2017. As briefly mentioned above, many studies focus on a single country, within which the minimum wage has no cross-sectional variation. They rely instead on the variation of its relative level, across regions or socio-economic groups for instance, such as the log difference between the minimum and the median wages. To identify the impact of minimum wage, they rely on sensible but strong assumptions (see the review in the next section). By using a country-level panel, which has both cross-sectional and time-series variation in minimum wage, we estimate the impact of minimum wage. Also, by not relying on a single country, we deliver a more general picture of this impact, controlling for other relevant factors such as the changes in international trade and production technology which are likely to affect all regions or all socio-economic groups of a single country used in previous studies.
Our empirical models are similar to those of Lee (1999) and Autor, Manning and Smith (2016) who use the U.S. state-level panel. In particular, we employ the cross-sectional unit specific trends in Autor, Manning and Smith (2016) to mitigate the potential bias from endogeneity and omitted variables. We also apply their IV strategy to check the robustness of our findings. Because we use a country panel, we are able to control for more macroeconomic factors that are likely to affect wage inequality than in these previous studies. Our results show that the findings of the previous studies largely extend to the cross-country setting; that is, minimum wage increase alleviates the wage inequality at the bottom of the wage distribution, while having little effect at the top of the wage distribution.
The composition of this paper is as follows. Section 2 reviews the literature on the effect of minimum wage on wage inequality. Section 3 describes the data and our empirical approach. Section 4 presents the estimation results and discusses their robustness. Section 5 concludes.
1)In the academic literature,
2)
II. RELATED LITERATURE
Wage inequality is a function of labor demand, labor supply and labor market institutions, among other factors. While the focus in the related literature is more on the demand factor,3 several existing studies analyze the particular institutional factor that we study in this paper, namely the minimum wage. As briefly mentioned above, DiNardo, Fortin and Lemieux (1996), Lee (1999) and Autor, Manning and Smith (2016), for instance, investigate how much of the rapid expansion of wage dispersion in the 1980s in the U.S. is explained by the concurrent decrease in real value of the federal minimum wage, using the Current Population Survey data.4 During this period, wage inequality occurred largely at the bottom of the wage distribution in the US, which corresponds to a decline in the real value of the federal minimum wage as well as to the factors that induce the increase in the demand for skills.
DiNardo, Fortin and Lemieux (1996) use a kernel density estimation method and find that the minimum-wage decline accounted for a substantial portion of the increase in wage inequality at the lower tail, but not the gap between the ninth decile and the median. Lee (1999) constructs a state-level panel and estimates the impact of the log difference between the minimum and the median wages on the gap between the first decile and the median. Surprisingly, he finds that the minimum-wage decline explains nearly all the wage gap between the first decile and the median, particularly for women. Autor, Manning and Smith (2016) extend the panel data of Lee (1999) until 2011 and control for state fixed effects and state-specific trends. They also apply an instrumental variables estimation. Albeit smaller in magnitude, they also find that the minimum-wage decline widens the wage inequality at the lower tail of wage distribution.
Several studies investigate the impact of minimum wage on wage inequality in other countries. For instance, Dickens and Manning (2004a, 2004b) estimate the effect of the introduction of the national minimum wage in the UK, using a difference-indifference method. They find that the introduction of the national minimum wage modestly reduced wage inequality, mainly due to a spike effect, with no significant spill-over effect; that is, it induced rightward shifts at the lower end of the wage distribution, without having affecting those that are located further right. Jeong et al. (2011) estimate the impact of minimum wage increase in Korea, using a panel of 15 Korean provinces during 1998-2008, based on the Korean Labor and Income Panel Study (KLIPS). Because the minimum wage is the same across provinces, they use the variation across provinces in the percentage of workers below the increased minimum wage (i.e., the impact rate). They find that the increase in impact rate reduces the gap between the ninth and the first deciles. Seong (2014) calculates the ratio of minimum wage to median wage using the fact that the median wages are different across regions, although the minimum wage is the same. He finds that the increase in the ratio reduces wage inequality at the bottom of the wage distribution. Seong (2014), following the approaches of Lee (1999) and Autor, Manning and Smith (2016), finds that the minimum wage increase reduces the wage gap at the lower half of the wage distribution. On the contrary, Lee and Hwang (2018), using the variation in the impact rate across socio-economic groups in Korea during 2006-2016, finds little impact of minimum wage increase on wage inequality.
3)Many existing analyses of the rising wage inequality focus on the increase of demand for skills. Two popular explanations are skill-biased technological changes
4)Until the late 1980s, most U.S. states did not have a state minimum wage and thus had a common (federal) minimum wage. Nominal value of the federal minimum wage remained constant during the period of 1980-88. This stagnancy had forced the state governments to adopt their own state-level minimum wages.
III. DATA AND EMPIRICAL MODEL
1. Minimum Wage in the OECD Countries
Before we introduce our empirical model, let us first describe the variation of the minimum wage across the OECD countries, our population of interest. Figure 1 shows the real hourly minimum wages in 1997, 2007 and 2017 of the OECD countries that had a statutory minimum wage in 2017,5 expressed in the 2018 USD PPPs (Purchasing Power Parities). Since it is real and PPP, both time-series and cross-sectional comparisons make sense. Notice first the wide cross-country dispersion. For instance, in 2017, the minimum wages in Mexico, Colombia and Chile were less than or around 3 dollars, while it was more than 11 dollars in Germany, France, Australia and Luxembourg. The average and the median among the OECD countries in 2017 were around 7 dollars. Also, there were substantial increases over time in most countries. In Korea, for instance, it increased by about 2 dollars every 10 years, from 2.61 in 1997 to 4.65 in 2007, then to 6.91 in 2017. However, it was stagnant in Mexico, while Greece saw it decreasing from 6.18 in 2007 to 5.02 in 2017. These variations in both cross-sectional and time-series dimensions also suggest that our explanatory variable, to be defined below, has enough variation.
Even if two countries have the same level of minimum wage, its effectiveness can differ, depending on its location in the wage distribution in each country. To have a glimpse of the variation of the effectiveness of minimum wage, Figure 2 shows the ratio of the minimum wage to the median wage of full-time workers in 1997, 2007 and 2017 of the OECD countries that had a statutory minimum wage in 2017.6 Notice again the wide cross-country dispersion. In 2017, for instance, the ratio in Colombia was nearly 0.9, while it was a mere 0.3 in the U.S. and between 0.4 and 0.6 in most other countries. Also, it continuously and rapidly increased in Korea and Japan, while it stagnated, or even decreased, in many Western European countries.
Log of the ratio in Figure 2, which is equivalent to the log difference between the median and minimum wages, is often used as a measure of the effective minimum wage in the related literature (see Section 2), and we follow this usage in this paper, denoting it by
2. Empirical Model
Following Lee (1999), Newmark and Wascher (2004), and Autor et al. (2016), we estimate

where the subscripts
Secondly, to control for the impact of labor supply, we include, all in logarithm, the ratio of the population aged15-24 and 65 or older to those aged 25-64 (denoted by
Finally, to control for the impact of labor demand, we include the external openness (denoted by
3. Data
We use the data from the OECD and the Penn World Table (for the human capital index and the external openness), for the period of 1990-2017. Our sample consists of the 27 OECD countries that have had a statutory minimum wage any time during the sample period. Due to the difference in time of the introduction of minimum wage and data availability, our panel is unbalanced. Table 1 shows the summary statistics of our sample.
5)The latest available data from the source is 2018. We show the year 2017, because it has more observations. For instance, the data for Japan is not available for 2018.
6)The OECD provides the data for the ratio of minimum wages to median earnings of full-time employees for cross-country comparisons of earnings dispersion of full-time workers. According to the OECD, these earnings include overtime and bonus payments which generate measurement errors and make international comparisons further difficult. To mitigate these measurement errors, our empirical analysis focuses on within-county variations by employing fixed effect estimation approach. We also include the country specific trends in the specifications to capture the effects of some labor market institutional changes over time.
7)
8)Another explanation, the skill-biased technological change hypothesis
IV. RESULTS
This section presents our estimation results of equation (1). Our benchmark estimation strategy is the OLS with country fixed effects and country-specific trends. Later, we check the robustness of our results by applying the IV strategy of Autor, Manning and Smith (2016).
1. Main Results
Table 2 presents the OLS estimates for both male and female. Columns 4 to 6 include country-specific trends. Columns 1 and 4 do not include the control variables (
In all specifications, we find that the effective minimum wage significantly shrinks the lower-tail of the wage distribution. In particular, recall from equation (1) that the elasticity of
Let us consider the specific cases of some countries using the results in column (6). In 2017, the effective minimum wage,
Columns (2) and (5) include variables measuring the relevant macroeconomic conditions, namely unemployment rate (
Columns (2) and (5) also include variables measuring the relevant factors of labor supply, namely the shares of unskilled workers (
We conduct the analogous analyses for women and men separately. Table 3 presents the results. Because we observe in most, if not all, countries an over-representation of women in low-skill jobs and an under-representation in high-skill jobs, as well as a general wage gap between the genders, these results can show how minimum wage is related to these issues. Columns (1) and (2) are for the male sample, and columns (3) and (4) for the female sample. Columns (2) and (4) include country-specific trends. To increase the sample size, we do not include the backward participation rate in the global value chains (GVC), which is not statistically significant at the 10% level (as in Table 2).
Overall, we find that the effective minimum wage significantly shrinks the lower-tail of the wage distribution for each gender, similarly to when they are considered together. In all specifications, the estimates of
2. Robustness
We have shown the evidence that the (effective) minimum wage shrinks the lower-tail of the wage distribution in the OECD countries, even when the genders are considered separately. This section provides some evidence that our findings are robust.
We first examine if the relation between minimum wage and the lower-tail of the wage distribution is spurious, following Lee (1999) and Autor, Manning and Smith (2016). Specifically, we estimate regression (1) for the ratio of the ninth decile to the median, denoted by
Table 4 shows results, columns (1) and (2) for the entire sample, columns (3) and (4) for the male sample, and columns (5) and (6) for the female sample. The estimates of
Next, to take care of the potential endogeneity of the effective minimum wage in regression (1), we apply the instrumental variables of Autor, Manning and Smith (2016), namely the log of the statutory minimum wage, its square and its interaction with the sample mean of each country of the log median wage. The idea is that because median wage is used to construct the effective minimum wage (the main explanatory variable)
Overall, the IV results are consistent with our main results that the effective minimum wage significantly shrinks the lower-tail of the wage distributions. In all columns, the estimates of
V. CONCLUSION
This paper investigates the impact of minimum wages on wage inequality in the OECD countries, using an unbalanced country-level panel data from 1990 to 2017. We estimate several specifications relating wage inequality measures to the effective minimum wage, controlling for the changes in macroeconomic conditions, labor supply and labor demand. The use of the effective minimum wage is particularly useful for our empirical setting for several reasons. First, the effective minimum wage is less sensitive to the economy-wide income level and price level. It can also mitigate the influence of the difference in data sources for wage distribution across countries. Further, the effective minimum wage reflects the proportion of potential workers who will be affected by a change in minimum wage: the closer the (log) distance between the minimum wage and the median wage, the greater the share of potential workers affected by changes in minimum wage.
We find that an increase in minimum wage alleviates the wage inequality at the lower-tailof wage distribution (i.e., the log distance between the median and the first decile of the wage distribution). The magnitude of this effect is larger for women than for men, implying that minimum wage increase can reduce the gender wage gap. This last observation can be explained by the fact that there are more female workers than male workers who can be directly affected by changes in minimum wage. We also find that minimum wage has little effect on the wage inequality at the upper-tail of the wage distribution (i.e., the log distance between the ninth decile and the median of wage distribution). We take this last finding as supporting evidence that our main results are not spurious. All these findings are consistent with the theory that minimum wage increases mainly affect the lower-tail of wage distribution and their ripple effects decrease towards the upper-tail of wage distribution.
Final words of caution when using our results for policy implications: Our data for wage dispersion are of gross earnings of full-time dependent employees which exclude part-time workers who are more likely to be dis-employed when minimum wage is raised.9 Taking account of part-time workers when estimating the impact of minimum wage using cross-country data is, while being difficult due to the lack of available data, will be a valuable contribution to our understanding of the effect of minimum wage.
9)The minimum wage change may affect working hours of workers as well.
Tables & Figures
Figure 1.
Minimum Wage in the OECD Countries
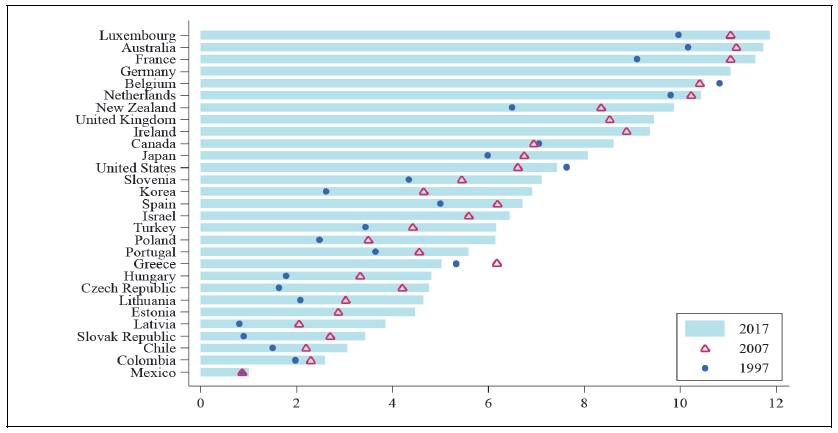
Note: In 2018 constant prices at 2018 USD PPPs.
Source: OECD, “Real minimum wages” (accessed on June 26, 2020).
Figure 2.
Minimum to Median Wage Ratio in the OECD Countries
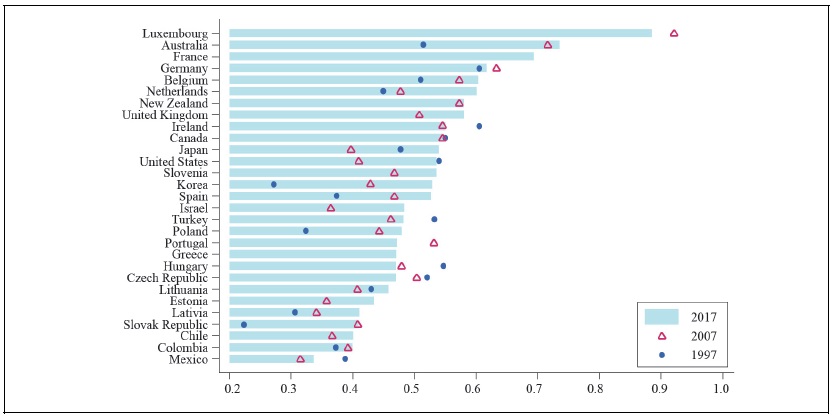
Source: OECD, “Dataset: Minium relative to average wages of full-time workers” (accessed on June 30, 2020).
Figure 3.
Income Inequality and the Median to Minimum Wage Ratio in the OECD Countries in 1990-2018
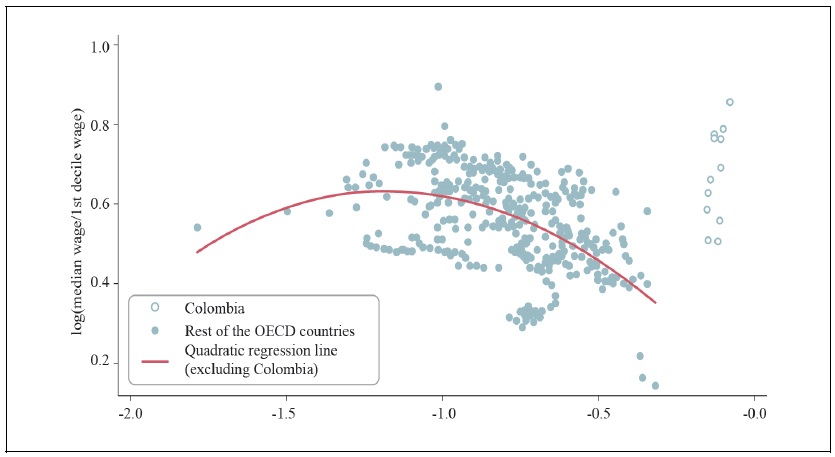
Source: OECD, “Dataset: Minium relative to average wages of full-time workers” and “Decile ratios of gross earnings” (all accessed on June 30, 2020).
Table 1.
Summary Statistics
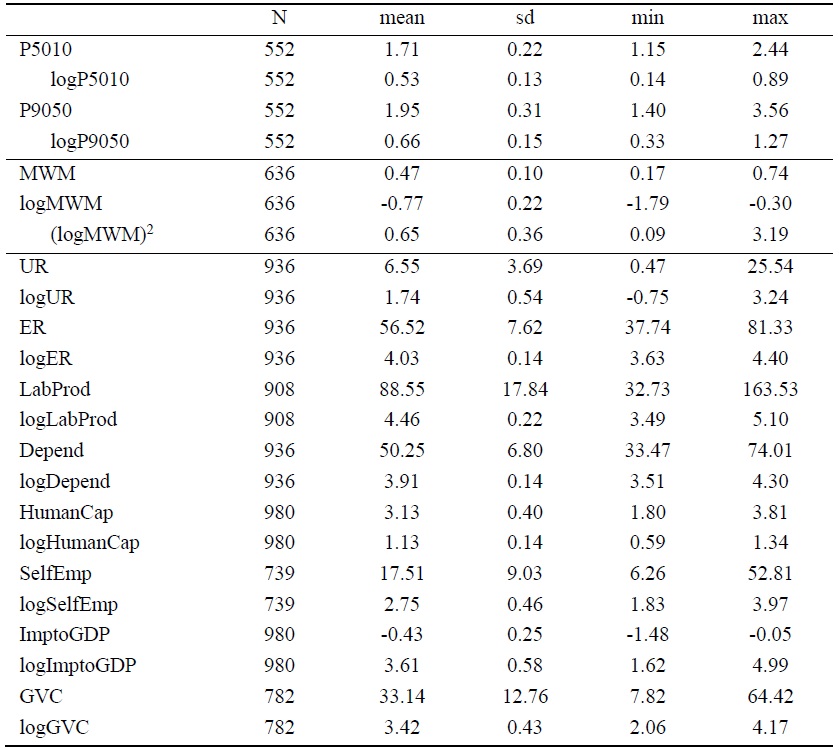
Table 2.
Impact of the Effective Minimum Wage on the Lower-tail of the Wage Distribution
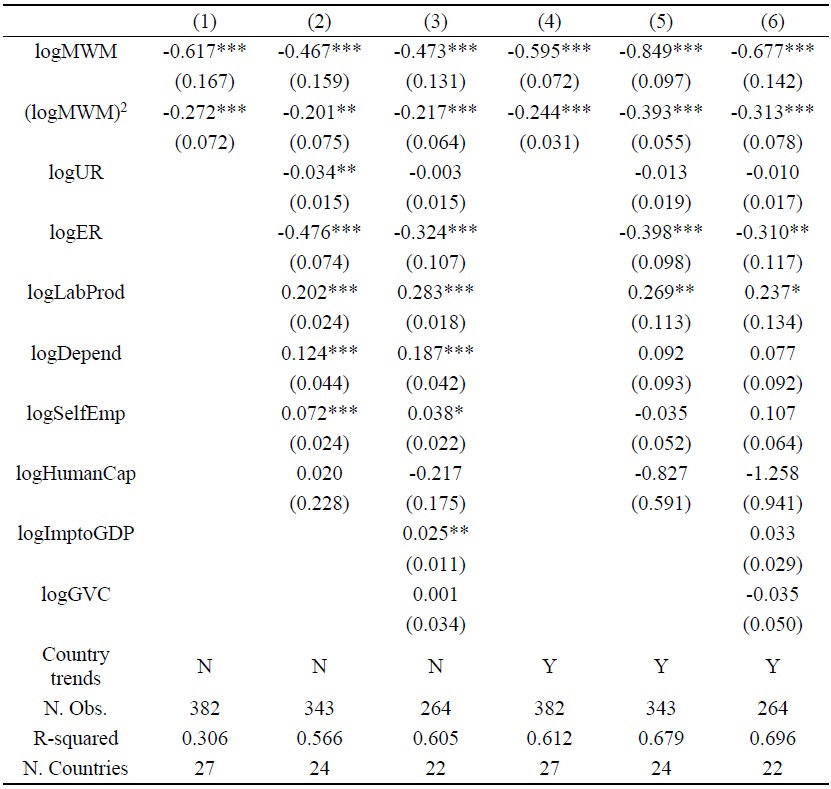
Note: See Section 3 for definitions. All specifications control for country fixed and year fixed effects. Numbers in parentheses are clustered robust standard errors. *, **, *** means significance at the 10%, 5%, and 1% levels, respectively.
Table 3.
Impact of the Effective Minimum Wage on the Lower-tail of the Wage Distribution by Gender
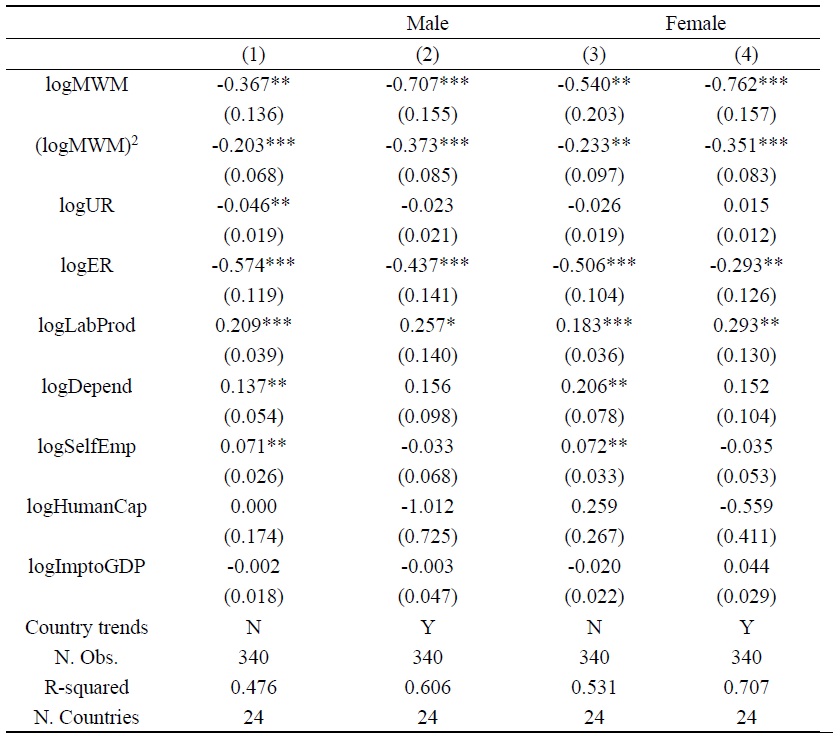
Note: See Section 3 for definitions. All specifications control for country fixed and year fixed effects. Numbers in parentheses are clustered robust standard errors. *, **, *** means significance at the 10%, 5%, and 1% levels, respectively.
Table 4.
Impact of the Effective Minimum Wage on the Upper-tail of the Wage Distribution
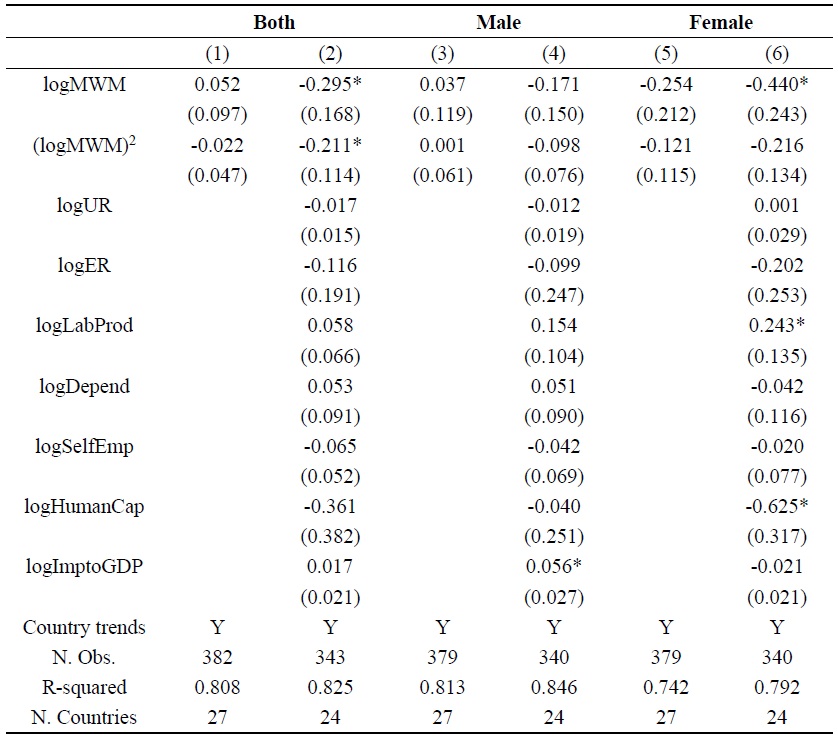
Note: See Section 3 for definitions. All specifications control for country fixed and year fixed effects. Numbers in parentheses are clustered robust standard errors. *, **, *** means significance at the 10%, 5%, and 1% levels, respectively.
Table 5.
Impact of the Effective Minimum Wage on the Lower-tail of the Wage Distribution: An IV Estimation
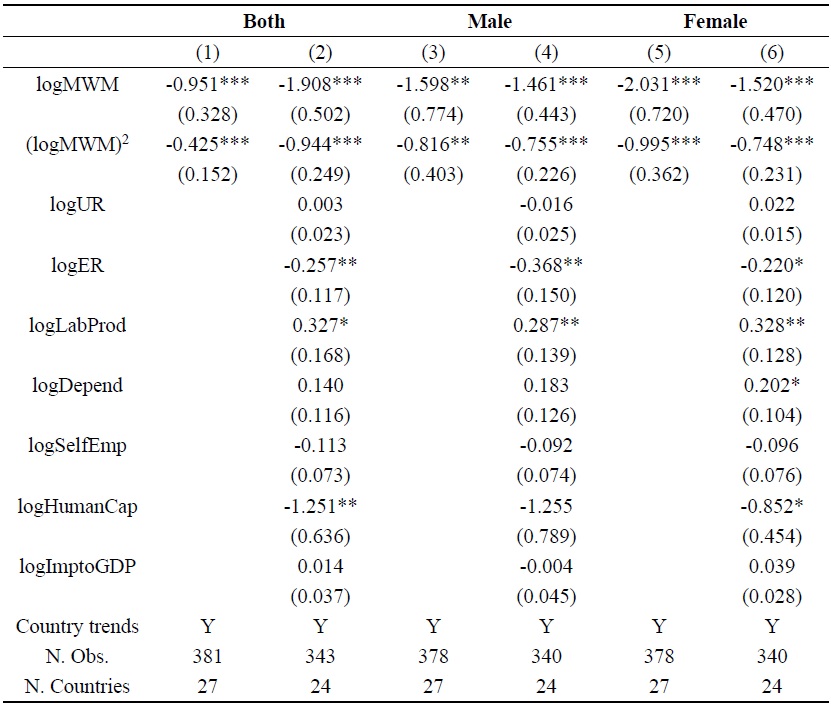
Note: See Section 3 for definitions. All specifications control for country fixed and year fixed effects. Numbers in parentheses are clustered robust standard errors. *, **, *** means significance at the 10%, 5%, and 1% levels, respectively. The effective minimum wage and its square are instrumented by the log of the statutory minimum wage, its square and its interaction with the average of log median wage of each country over the sample period.
References
-
Acemoglu, D. and D. Autor. 2011. “Skills, Tasks and Technologies: Implications for Employment and Earnings.” In Ashenfelter, O. and D. Card. (eds.)
Handbook of Labor Economics . vol. 4B, Amsterdam: North-Holland. pp. 1043-1171. -
Autor, D., Manning, A. and C. L. Smith. 2016. “The Contribution of the Minimum Wage to US Wage Inequality over Three Decades: A Reassessment,”
American Economic Journal: Applied Economics , vol. 8, no. 1, pp. 58-99.
-
Barro, R. J. and J.-W. Lee. 2013. “A New Data Set of Educational Attainment in the World, 1950-2010,”
Journal of Development Economics , vol, 104, pp. 184-198.
-
Berman, E., Bound, J. and Z. Griliches. 1994. “Changes in the Demand for Skilled Labor within U.S. Manufacturing Industries: Evidence from the Annual Survey of Manufactures,”
Quarterly Journal of Economics , vol. 109, no. 2, pp. 367-397.
-
Borjas, G. and V. Ramey. 1995. “Foreign Competition, Market Power and Wage Inequality,”
Quarterly Journal of Economics , vol. 110, no. 4, pp. 1075-1110.
-
Bound, J. and G. Johnson. 1992. “Changes in the Structure of Wages in the 1980s: An Evaluation of Alternative Explanations,”
American Economic Review , vol. 82, no. 3, pp. 371-392. - Butcher, T., Dickens, R. and A. Manning. 2012. Minimum Wages and Wage. Inequality: Some Theory and an Application to the UK. CEP Discussion paper, no. 1177.
-
Card, D. 1992. “Do Minimum Wages Reduce Employment? A Case Study of California, 1987-1989,”
Industrial and Labor Relations Review , vol. 46, no. 1, pp. 38-54. -
Card, D. and A. B. Kruger. 1994. “Minimum Wages and Employment: A Case Study of the Fast-Food Industry in New Jersey and Pennsylvania,”
American Economic Review , vol. 84, no. 4, pp. 772-793. - Card, D. and A. B. Kruger. 1995. Myth and Measurement: the New Economics of the Minimum Wage. Princeton NJ: Princeton University Press.
-
Card, D. and J. E. DiNardo. 2002. “Skill-Biased Technological Change and Rising Wage Inequality: Some Problems and Puzzles,”
Journal of Labor Economics , vol. 20, no. 4, pp. 733-783.
-
Dickens, R. and A. Manning. 2004a. “Has the National Minimum Wage Reduced UK Wage Inequality?”
Journal of the Royal Statistical Society, Series A . vol. 167, no. 4, pp. 613-626.
-
Dickens, R. and A. Manning. 2004b. “Spikes and Spill-Overs: The Impact of the National Minimum Wage on the Wage Distribution in a Low-Wage Sector,”
Economic Journal , vol. 114, no. 494, pp. C95-C101.
-
DiNardo, J., Fortin, N. M. and T. Lemieux. 1996. “Labor Market Institutions and the Distribution of Wages, 1973-1992: A Semiparametric Approach,”
Econometrica , vol. 64, no. 5, pp. 1001-1044.
-
Dube, A., Lester, W. and M. Reich. 2010. “Minimum Wage Effects Across State Borders: Estimates Using Contiguous Counties,”
Review of Economics and Statistics , vol. 92, no. 4, pp. 945-964.
-
Feenstra, R. and G. H. Hanson. 1996. “Globalization, Outsourcing, and Wage Inequality,”
American Economic Review , vol. 86, no. 2, pp. 240-245. - Jeong, J.-H., Nam, J., Kim, J.-Y. and Y.-J. Jun. 2011. The Analysis on Minimum Wages. KLI Research Series, 2011-02. (in Korean)
- Joe, D.-H., Kim, J., Kim, H., Moon, S., Yoon, Y. J. and Y. J. Lim. 2018. Income-Led Growth: Policy Cases of Europe and the U.S. KIEP Research Paper Policy Analyses, 18-08. (in Korean)
-
Juhn, C., Murphy, K. M. and B. Pierce. 1993. “Wage Inequality and the Rise in Returns to Skill,”
Journal of Political Economy , vol. 101, no. 3, pp. 410-442.
-
Katz, L. and A. B. Kruger. 1992. “The Effect of Minimum Wage on the Fact-Food Industry,”
Industrial and Labor Relations Review , vol. 46, no. 1, pp. 6-21.
-
Katz, L. F. and K. M. Murphy. 1992. “Changes in Relative Wages, 1963-1987: Supply and Demand Factors,”
Quarterly Journal of Economics , vol. 107, no. 1, pp. 35-78.
- Koske, I., Fournier, J.-M. and I. Wanner. 2012. Less Income Inequality and More Growth-Are They Compatible? Part 2 The Distribution of Labour Income. OECD working paper, no. 925.
-
Krueger, A. B. 1993. “How Computers Changed the Wage Structure: Evidence from Micro Data,”
Quarterly Journal of Economics , vol. 108, no. 1, pp. 33-60.
-
Krugman, P. 2008. “Trade and Wages, Reconsidered,”
Brookings Papers on Economic Activity , vol. 2008, Spring, pp. 103-137.
-
Lee, D. S. 1999. “Wage Inequality in the United States During the 1980s: Rising Dispersion or Falling Minimum Wage?”
Quarterly Journal of Economics , vol. 114, no. 3, pp. 977-1023.
-
Lee, J. and S. J. Hwang. 2018. “The Effects of the Minimum Wage on Wage Distribution in Korea,”
Journal of Korean Economic Analysis , vol. 24, no. 2, pp. 1-42. (in Korean) -
Lemieux, T. 2008. “The Changing Nature of Wage Inequality,”
Journal of Population Economics , vol. 21, no. 1, pp. 21-48.
- Moon, S. 2019. The Effects of Minimum Wages on Wage Inequality and Gender Pay Gap in APEC Economies. KIEP APEC Study Series, 19-03.
-
Murphy, K. M. and F. Welch. 1993. “Occupational Change and the Demand for Skill, 1940-1990,”
American Economic Review , vol. 83, no. 2, pp. 122-126. -
Neumark, D. and W. Wascher. 1992. “Employment Effects of Minimum and Subminimum Wages: Panel Data on State Minimum Wage Laws,”
Industrial and Labor Relations Review , vol. 46, no. 1, pp. 55-81.
- Neumark, D. and W. Wascher. 2010. Minimum Wages. Cambridge, Massachusetts: The MIT Press.
-
Neumark, D. and W. Wascher. 2004. “Minimum Wages, Labor Market Institutions and Youth Employment: A Cross-National Analysis,”
Industrial and Labor Relations Review , vol. 57, no. 2, pp. 223-248.
- Seong, J.-M. 2014. Wage Inequality: Trends and Causes. KLI Research Series, 2014-02. (in Korean)