

- EAER>
- Journal Archive>
- Contents>
- articleView
Contents
Citation
| No | Title |
|---|---|
| 1 | Key Success Factors for Export Structure Optimization in East Asian Countries Through Global Value Chain (GVC) Reorganization / 2025 / Systems / vol.13, no.1, pp.22 / |
| 2 | Shifting paradigms: digital transformation’s role in corporate cash management / 2025 / Technology Analysis & Strategic Management pp.1 / |
| 3 | Taxation and corporate investment efficiency in common prosperity / 2025 / The Quarterly Review of Economics and Finance / vol.102, pp.102013 / |
Article View
East Asian Economic Review Vol. 28, No. 3, 2024. pp. 315-357.
DOI https://dx.doi.org/10.11644/KIEP.EAER.2024.28.3.438
Number of citation : 3View
105
Download
37
Fintech and R&D financing: Evidence from China
|
|
Kyungpook National University |
|---|---|
|
|
Kyungpook National University |
|
|
Kyungpook National University |

Abstract
The rapid development of China’s digital economy has enabled China to lead the world in financial technology (FinTech). In this context, it is imperative to study the impact of FinTech at the macro level on the sources of R&D financing for micro-enterprises. Using the data of A-share listed companies on the main boards of China’s Shanghai and Shenzhen cities and the municipal-level FinTech development index from 2011 to 2020, this paper conducts an empirical test by applying the system generalized method of moments estimation (system GMM). Fintech facilitates firms’ external financing of R&D. There is significant heterogeneity across different types of firms, with fintech facilitating R&D financing more strongly for young and non-state firms. This study not only complements the literature on the impact of fintech on R&D financing but also has essential practical guidance significance, which can provide valuable guidance and assistance to different types of enterprises in their R&D financing decision-making process.
JEL Classification: D21, G32, M41
Keywords
Fintech, R&D financing, GMM
I. Introduction
In recent years, financial technology (fintech) has developed rapidly around the world. Many studies have shown that fintech serves the real economy. For example, Fintech can expand corporate financing channels (Bollaert et al., 2021), reduce corporate financing constraints (Guo et al., 2023; Lai et al., 2023), and improve corporate investment efficiency (Huang, 2022; Lin et al., 2022; Lv and Xiong, 2022), promote corporate innovation (Chen et al., 2019; Tan et al., 2023), promote corporate transformation and sustainable development (Luo et al., 2022), etc. Compared with other countries, the development of fintech in China is unique and representative. To the best of our knowledge, few rigorous studies link macro-Fintech development with micro-level corporate R&D funding. Therefore, this article aims to reveal the evidence that Fintech development affects the R&D financing of Chinese listed companies.
Our study is divided into the following steps. First, based on the model developed by Brown and Petersen (2011), using the financial data of A-share listed companies on the main board of China’s Shenzhen Stock Exchange and Shanghai Stock Exchange from 2011 to 2020, we validate the sources of R&D financing and R&D smoothing of Chinese listed companies. We use OLS, FE, and system GMM estimation methods to conduct regression analysis to control the endogeneity problem to the greatest extent. The study found that operating cash flow, equity financing and debt financing have a significant positive impact on R&D, verifying that all three are sources of funding for the R&D of Chinese listed companies and that changes in cash holdings have a significant negative impact on R&D. This shows that companies use cash holdings for R&D smoothing.
Second, based on the data of A-share listed companies on the main board of China’s Shenzhen Stock Exchange and Shanghai Stock Exchange from 2011 to 2020, we matched the Fintech Development Index data of the cities where the listed companies are located, which is used to measure the degree of Fintech development of listed companies’ cities, based on the above model, the interaction term between key variables and fintech was added, and OLS, FE, and system GMM estimation methods were also used for regression analysis. The study found that fintech has a significant positive impact on external financing sources for R&D, indicating that fintech can promote external R&D financing. Still, there is little evidence that fintech impacts R&D internal financing. At the same time, there is also little evidence that fintech affects R&D smoothing.
Third, we group the sample, first by firm size, by considering the fraction of firms whose natural logarithms of sales are located at 70% and above of the total sample as large firms and the fraction of firms located at 30% and below of the total sample as small and medium-sized enterprises (SMEs). Then, grouped by firm age, firms with less than or equal to 15 years of listing are categorized as young firms, and firms with more than 15 years are categorized as mature firms. Finally, the sample is grouped by the ownership structure and categorized into two groups, state-owned enterprises (SOEs) and non-state-owned enterprises (non-SOEs), representing the sample groups with low and high financing constraints, respectively. Regression analysis using systematic GMM estimation was conducted to test the above question again. The study found no significant difference between large firms and SMEs, but fintech facilitated R&D financing more for young and non-state firms compared to mature and state-owned firms. We use alternative estimation strategies for the robustness test, including two-step systematic GMM estimation, changing the lag order of instrumental variables, and orthogonal transformation. The tested results do not change much, indicating that our findings are robust.
Our study contains the following contributions: first, it adds to the stream of literature on the impact of Fintech on R&D financing, which is rarely mentioned in prior studies, and we validate the role of Fintech for R&D financing in China. Second, it complements the stream of literature on the sources of funding for R&D. We test internal financing, external financing, and R&D smoothing separately and confirm the sources of R&D funding for listed companies in China. Third, it is of practical guidance, utilizing our findings to guide and assist different types of firms in their financing decision-making process.
The following section is the research background, deriving the hypotheses based on prior research. The third section is the methodology, including data, model, and descriptive statistics. Section IV is the empirical analysis and results. Section 5 is the conclusion and policy recommendations.
II. Literature Review
1. Background
Fintech, an abbreviation for financial technology, is commonly regarded as combining financial services and information technology (Arner et al., 2015). Fintech is considered one of the biggest innovations in the financial industry, and the Fintech revolution has emerged (Lee and Shin, 2018). The foundation of the Fintech revolution in finance consists of three independent pillars of innovation: the accumulation of significant capital, the development of new services, and the alteration of business models (Gomber et al., 2018). With the advancement of fintech, much research has been accumulated. Some studies have argued that fintech has become part of the financial industry and that banks have begun to face competition from non-financial institutions such as those providing payment services (Romānova and Kudinska, 2016). Another study argues that the rapid growth of fintech is changing the traditional financial system (Boot et al., 2021). The advantages of fintech are reflected in the fact that digital technologies automate a wide range of financial activities, which financial institutions can use as a basis to offer new and more cost-effective products (Navaretti et al., 2018). Financial analytics can extract valuable information and mitigate information asymmetry (Grennan and Michaely, 2021). The development of digital finance can promote sustainable development, fill financing gaps, and prevent market failures (Macchiavello, 2023).
Since 2008, fintech has emerged in developed and developing countries (Arner et al., 2015). In 2013, Alipay, a subsidiary of Ant Group, opened a balance transfer business. In the next ten years, fintech has exploded in China, with the industry calling this the first year of Fintech development in China. H2Ventures and KPMG (2016) show that in just three years, from 2014 to 2016, the number of Chinese tech companies has changed from one Chinese company among the top 50 global tech companies to four among the top 5. In addition, in the payments sector, a sub-sector of Fintech, JuniperResearch (2022) reports that Alipay is the leader in QR code payments, with three of the world’s top five QR code payment providers being Chinese companies. On May 23, 2023, the Cyberspace Administration of China released the “Digital China Development Report (2022)”, which stated that the size of China’s digital economy reached 50.2 trillion yuan in 2022, ranking second in the world with a year-on-year growth of 10.3% and accounting for 41.5% of GDP (Cac.gov.cn, 2023). As a result, China’s Fintech is highly representative and valuable to study.
2. Determinants of R&D Investment
There are three important streams of literature on the factors influencing R&D. The first stream is summarized in a study by Barge-Gil and Lopez (2014), which further divides the prior studies into those based on the Schumpeterian hypothesis and those based on specific industries. Earlier studies tested the Schumpeterian hypothesis that R&D increases with firm size and market concentration. Unfortunately, however, there is no agreement on the conclusions of the pioneer studies. On the size side, some studies concluded that size and R&D are positively correlated (Cohen and Levin, 1989; Rammer et al., 2009), while others reached the opposite conclusion (Holmstrom, 1989). On the market side, some studies verified the positive impact of the market on R&D (Crépon et al., 1998; Blundell et al., 1999), while others found a negative impact (Geroski, 1990; Harris et al., 2003). On the other hand, some studies have criticized studies based on Schumpeter’s hypothesis, arguing that attention should be paid to industry-specific influences such as demand-pull (Schmookler, 1966; Cohen et al., 1987), technological opportunity (Griliches et al., 1991) and appropriability (Mansfield et al., 1981; Mansfield, 1986).
The second stream of literature focuses on the impact of internal factors on R&D. Lai et al. (2015) categorized the internal factors affecting R&D investment activities, taking into account the characteristics of East Asian countries and relying on Del Canto and Gonzalez (1999). The internal factors are further categorized into three parts: financial resources, physical resources, and intangible resources. Financial resources include financial autonomy (Kim et al., 2008; Kim and Park, 2012) and profitability (Coad and Rao, 2010), material resources include firm size (Tsai and Wang, 2004; Park et al., 2010) and tangible assets (Del Canto and Gonzalez, 1999), and intangible resources include intangible assets (Weerawardena et al., 2006; Arora et al., 2008), human resources (Dalziel et al., 2011) and export business (Tomiura, 2007).
The third stream of literature focuses on the institutional determinants of R&D investment. With emerging markets in the foreground, Alam et al. (2019) suggest the importance of the external environment for R&D investment, particularly the institutional environment for R&D investment in emerging markets. He proposes government efficiency (Mahmood and Rufin, 2005; Szczygielski et al., 2017), rule of law (Acharya and Subramanian, 2009; Seitz and Watzinger, 2017), corruption (Anokhin and Schulze, 2009; Javorcik and Wei, 2009), political instability (Julio and Yook, 2012; Masino, 2015; Atanassov et al., 2024), and regulatory quality (Zuhdi et al., 2015; Blind et al., 2017) five institutional factors, where government efficiency, rule of law, and regulatory quality have a positive impact on R&D investment, while corruption and political instability have a negative impact.
3. Fintech Affects R&D Financing Channels
R&D activities are long-cycle, high-risk, and irreversible, so firms often face financing problems when carrying out these activities. When funds are insufficient to support R&D investment, it can lead to R&D failure. FinTech can alleviate the R&D financing problems of enterprises in the following three aspects:
First, fintech can reduce transaction costs and accelerate payment recovery (Ding et al., 2022; Shim and Shin, 2016). Fintech drastically reduces transaction costs by providing convenient payment methods. While traditional payment methods often involve cumbersome procedures and higher fees, fintech applications such as mobile payments, e-wallets, and blockchain payments make transactions easier and faster. This not only reduces the time and capital costs for businesses in the transaction process but also accelerates the recovery of payment and improves liquidity. For enterprises relying on rapid capital turnover, such convenient payment methods can significantly improve their operational efficiency and market competitiveness.
Second, applying fintech has driven the transformation and upgrading of financial markets (Gomber et al., 2017; Kauffman et al., 2015). Through smartphone applications, tablets, and other terminal devices, users can easily trade securities and obtain the latest data from financial markets in real-time. These trading platforms provide convenient operation interfaces and powerful data analysis functions, enabling investors to trade at any time and place, freeing them from the time and space constraints of traditional financial transactions. This transformation has increased the market’s liquidity and attracted more individuals and institutions to participate in the financial market, further promoting the market’s prosperity.
Third, fintech can alleviate information asymmetry with simplified approval procedures (Buchak et al., 2018; Chen et al., 2019; Tan et al., 2023). Fintech plays an important role in alleviating information asymmetry. Through big data analytics and artificial intelligence technologies, fintech can more comprehensively and accurately assess customers’ credit risk, thereby lowering the barrier to entry for customers. In addition, fintech has simplified many traditional approval procedures, utilizing automated processes and online approval systems, making it easier for customers to access financial services. This transformation not only improves the operational efficiency of financial institutions but also enables more small and medium-sized enterprises (SMEs) and individuals to enjoy financial services, promoting financial inclusion and sustainable socio-economic development.
III. Hypothesis Development
1. R&D Internal Financing
Schumpeter (1942) pioneering research on innovation theory, the difficulty of financing innovation has been confirmed by existing literature (Nelson, 1959; Arrow, 1972). The special attributes of R&D investment make it different from ordinary investment. The research of Hall and Lerner (2010) found that, first, more than half of R&D expenditures are spent on the salaries of R&D personnel, who are highly specialized, and thus termination and rehiring of R&D personnel imposes large adjustment costs on R&D activities (Hall et al., 1986). Second, the uncertainty of the output of R&D investments is much greater than that of other investments, as revenues can only be generated when R&D results are transformed into commodities, and interruptions, suspensions, and failures of R&D activities incur substantial sunk costs (Stiglitz et al., 1987; Manez et al., 2009).
Pecking order theory holds that due to information asymmetry and transaction costs, companies prioritize using internal funds when financing new projects (Myers and Majluf, 1984; Hall, 2002). Researchers have recognized internal financing as a major source of R&D inputs for SMEs and young firms, but there is no consistent evidence from existing studies for large and mature firms. For example, Hall (1992) found a positive elasticity between R&D investment and cash flow for manufacturing firms in the U.S. Himmelberg and Petersen (1994) also confirmed that internal funding is the main source of financing R&D for small high-tech firms. Brown et al. (2009) confirmed that cash flow significantly impacts R&D in young US firms, while no similar findings were found for mature firms. Brown and Petersen (2011) confirm that firms hold more cash for precautionary motives and use cash reserves to smooth R&D expenditures. He and Ciccone (2020) find that the sensitivity of R&D expenditures to cash holdings increased significantly between 1971 and 2012 for US industrial firms. Excess cash enabled innovative firms to afford more R&D expenditures despite financing constraints.
It has been established that fintech helps to increase corporate cash flow. For example, Shim and Shin (2016) pointed out that Chinese customers prefer cash and third-party payments over credit cards and that third-party payments provide a simple and secure way to save on transaction costs. Ding et al. (2022) pointed out that instant fintech payment can reduce consumers’ transaction costs and promote their purchase of goods. Customer payments are more convenient, which can reduce the company’s accounts receivable and increase sales cash inflow, giving Companies more cash to invest in research and development activities. Fan et al. (2024) found that fintech can alleviate the negative impact of financing constraints on corporate liquidity, allowing companies to have more funds to invest in research and development. Based on the above analysis, we propose the first research hypothesis:
2. R&D External Financing
The cost of internal financing is the lowest, but when internal funds are insufficient, or cash flow is restricted, companies are bound to use the issuance of new shares to finance R&D (Brown et al., 2009). It has been confirmed that the stock market is an important source of R&D financing for firms. For example, Carpenter and Petersen (2002) found that small technology firms fully use IPO financing. Still, due to the high cost of equity financing, most firms utilize their funds to sustain their R&D after going public. A small number of firms will continue to use equity financing. Hence, equity financing is not a perfect substitute for internal financing. Brown et al. (2009) used data on US high-tech companies from 1990 to 2004. They confirmed that equity financing of young companies significantly impacts R&D expenditures, but this impact is not significant for mature companies. Martinsson (2010) compared the European market with the United States and pointed out that the United Kingdom and the United States are similar. The reason why British companies have higher R&D intensity is that they have obtained external equity. At the same time, most European countries lack R&D equity financing because their stock markets are not as good as The United States and the United Kingdom are developed. Zhang et al. (2019) are based on a cross-national sample of 35 developed countries from 1996 to 2015. Equity financing has a more positive impact on innovation than debt financing. Even in economic downturns, equity financing can well support technology innovation.
Technology-based financial innovations have led to the transformation of financial markets (Kauffman et al., 2015). Established studies have confirmed that fintech is changing the securities trading market, which is summarized in the study of Gomber et al. (2017), including the following aspects: Mobile trading, using applications on mobile phones, tablets, and other terminal devices for securities trading, the trading platform provides real-time data on the financial market, getting rid of the limitations of time and space. Social trading uses social software such as Facebook and Twitter to conduct real-time securities trading, realizing the combination of social media networks and investment activities, which is more conducive to spreading information. Highfrequency trading (HFT) uses computers and mathematical models in software to execute trading decisions in extremely short periods without human intervention. To sum up, the development of fintech is conducive to companies using equity financing to support innovative activities better. From this, our second hypothesis is derived:
On the other hand, it has been shown that debt financing for R&D is not as favored by firms as equity financing. Szewczyk et al. (1996) confirm that debt financing for R&D requires a higher rate of return due to information asymmetry problems. Carpenter and Petersen (2002) also argue that it is difficult for small technology companies to obtain debt financing due to information asymmetry and lack of collateral. Hall (2002) provides evidence that debt is not a favorable funding source for R&D investments, with R&D-intensive firms generally having much lower leverage than other firms. Brown et al. (2009) also confirmed this conclusion, arguing that young high-tech companies rarely obtain debt financing. Brown et al. (2012) further confirm that cash holdings and equity financing significantly affect R&D for firms facing financing constraints. Still, there is no evidence that debt financing significantly affects R&D. The above studies negate the role of debt financing for R&D to varying degrees. Still, it does not mean that debt financing is useless because these studies are all based on the mature financial systems of developed countries. At the same time, China is a developing country in transition with an imperfect financial market. Bank credit is still an important source of corporate financing.
Evidence that fintech helps debt financing is abundant. First, fintech can alleviate the information asymmetry between banks and enterprises, reduce corporate financing constraints, and promote corporate innovation (Chen et al., 2019; Guo et al., 2023; Tan et al., 2023). Second, unlike traditional financial services, fintech does not need to establish branches and can provide financial services by only utilizing terminal equipment, which greatly reduces service costs; it also relies on the big data of Fintech companies, which lowers the threshold of customer access and expands the breadth of financial services (Buchak et al., 2018; Ding et al., 2022). Third, fintech development can also simplify the process of credit approval and speed it up, and this fast approval does not increase the risk of loan default (Fuster et al., 2019). It can be seen that fintech can better serve R&D debt financing. Based on the above evidence, we propose a third hypothesis:
IV. Research Design
1. Data
The Fintech data in our study is sourced from the “Peking University Digital Inclusive Finance Index (2011-2020)” (PKU-DFIIC) released by the Digital Finance Research Center of Peking University. The index was compiled by the research team from Peking University’s Digital Finance Research Center and Ant Group Research Institute, utilizing massive data from Ant Group (Guo et al., 2020). The index includes three dimensions: breadth of coverage, depth of use and degree of digitization of fintech in each region, and the depth of use further includes six aspects: payment, insurance, money fund, credit service, investment and credit, in order to comprehensively portray the development level of fintech in each region. The distribution of the 2020 Fintech Index by province is shown in Figure 1, which shows that the Fintech Index of Shanghai, Beijing, and Zhejiang is significantly higher than that of other provinces and are in the first echelon, while the provinces with an index after Tibet are located in the western or northeastern regions, and have a significantly lower level of development of Fintech and are in the third echelon; and the other eastern and central provinces are in the middle of the two echelons mentioned above.
Financial and other data are sourced from the China Stock Market & Accounting Research (CSMAR) database. The sample used in this study comprises data from A-share listed companies on the Shenzhen Stock Exchange and Shanghai Stock Exchange from 2011 to 2020. To ensure representativeness, the following data processing steps were applied to the sample: 1) exclusion of listed companies in the financial industry, 2) exclusion of listed companies with three consecutive years of ST status, and 3) exclusion of samples with missing data for key variables. Additionally, to mitigate the influence of extreme values, a Winsorization procedure was performed on data points below the 1st percentile and above the 99th percentile for the main continuous variables. An unbalanced panel dataset of 20442 observations was constructed.
2. Model
Our study builds on the Brown and Petersen (2011) model and uses a two-step process to construct an econometric model of the impact of fintech on R&D financing. First, drawing on Brown and Petersen (2011), we examine the sources of financing for R&D expenditures in a model that incorporates cash flows, equity, and debt financing and also includes changes in cash holdings to explore the use of cash reserves for R&D smoothing directly. That is, firms use cash reserves to ensure the stability of R&D investment, leading to cash holdings fluctuations. The model is as follows:
In the model,  is expected to be negative. The key variables include current and lagged cash flow (cf), equity financing (stock), and debt financing (debt), which are used to measure the sources of financing for R&D. The expected coefficients are positive. The expected coefficient on the change in current and lagged cash holdings (Δcash) is negative, indicating the presence of R&D smoothing behavior by firms. Market-to-book ratio (mb) and sales growth (grow) control investment demand variables. The model includes firm effects (
Second, to test hypotheses 1-3, we introduce the fintech variable (dif) and the interaction variables of fintech with other variables to construct a model (2) based on model (1), which is as follows:
The Fintech variable (dif) represents the Fintech development index of the city where the company is located, with a higher value indicating a higher level of Fintech development in that city (Guo et al., 2020). The expected coefficients of the current and lagged cash flow interaction term (cf × dif), the equity financing interaction term (stock × dif), and the debt financing interaction term (debt × dif), which are used to measure the sources of R&D financing from different channels, are positive, indicating the facilitating effect of Fintech on R&D financing. The expected coefficients of the current and lagged change in cash holdings interaction term (Δcash×dif) are negative further to test fintech’s mitigating effect on firms’ R&D smoothing behavior. The variables are defined in Table 1.
Due to the presence of lagged variables as explanatory variables, the model may suffer from heteroscedasticity or autocorrelation issues. Therefore, we employ the Generalized Method of Moments (GMM) estimator specifically designed for dynamic panel models (Arellano and Bover, 1995; Blundell and Bond, 1998). System GMM is based on the principle of GMM estimation of difference and level equations as a system of equations to improve estimation efficiency and estimate the coefficients of variables that do not vary over time. This approach combines the advantages of difference GMM and level GMM to improve the efficiency and accuracy of estimation by forming an integrated system. Specifically, the system GMM can process the data more efficiently by using information from the difference and level equations while allowing for the estimation of coefficients on variables that do not vary over time. It is common practice to use lagged variables of endogenous explanatory variables as instrumental variables. In our model, on the one hand, the endogenous explanatory variables on the right-hand side of the equation are correlated with their lagged variables. On the other hand, the lagged variable indicates that it has already occurred and is uncorrelated with the current period’s disturbance term. Thus, the assumption condition of instrumental variables is satisfied, which ensures the reliability and validity of the system GMM estimation results.
As a comparison, we also employed Ordinary Least Squares (OLS) estimation with firm effects, time effects, additional firm-specific clustered robust standard errors, and a Fixed Effects (FE) model incorporating firm and time effects. We consider all financial variables as potentially endogenous. We used the lagged level at time t-3 as an instrument for the difference equation and the lagged difference at time t-2 as an instrument for the level equation.
To assess the effectiveness of the GMM estimator, we report a series of test results. In the presence of second-order autocorrelation issues, GMM estimation may be inconsistent, so we present the results of the m2 test for second-order autocorrelation. To address the concern of overidentification, we also report the results of the Hansen J-test. Additionally, we report the difference-in-Hansen test, which evaluates the validity of the instruments.
3. Descriptive Statistics
Tables 2 and 3 show the sample distribution at the industry and regional levels, respectively. Table 4 presents the descriptive statistics for the main variables. As shown in Table 4, there are significant differences in the R&D investment of the listed companies, with a maximum value of 0.266 and a minimum value of 0.001. The mean values for both external financing methods are similar, indicating that debt and equity financing play equally important roles for Chinese companies. For some firms, cash flows can be negative, suggesting that cash flow is not a sustainable funding source for R&D activities. The mean change in cash holdings is relatively small, indicating that companies’ cash holdings exhibit minimal fluctuations and remain relatively stable. Regarding control variables, the market-to-book ratio and the variance of sales growth are large, indicating significant differences among the listed companies.
V. Empirical Results
1. Correlations
The Pearson correlation coefficients for the main variables are presented in Table 5. Equity financing (stock) correlates significantly positively with R&D investment (rd). At the same time, the change in cash holdings (Δcash) is significantly negatively correlated with R&D investment (rd), in line with findings from Brown and Petersen (2011). However, operating cash flow (cf) and debt financing (debt) are significantly negatively correlated with R&D investment (rd), contrary to our expectations, warranting further investigation. The level of Fintech development in the city where the company operates (dif) is significantly positively correlated with R&D investment (rd), aligning with our expectations and indicating that the level of Fintech development in a company’s operating city promotes its R&D activities. In terms of control variables, the market-to-book ratio (mb) is significantly positively correlated with R&D investment (rd), while sales growth (grow) is significantly negatively correlated with R&D investment (rd).
2. Baseline Regression
Columns (1)-(3) of Table 6 provide evidence of R&D financing in listed companies. The coefficient for the lagged R&D variable (rdt-1) is close to 1, and the coefficient estimated using GMM lies between OLS and fixed effects (FE), indicating no model fitting issues. As expected, the coefficient on the quadratic term (rd2t-1) is negative but insignificant (-0.555).
The joint significance of the three variables of current and lagged operating cash flow (cf), equity financing (stock), and debt financing (debt) are all significantly positive (0.006, 0.020, 0.015, and the p-values of the χ2 test are 0.059, 0.000, 0.000), indicating that all three are the main sources of financing for R&D. Additionally, we can also observe from the regression results that the influence of equity financing (stock) on R&D (0.020) is slightly greater than the influence of debt financing (debt) on R&D (0.015). This indicates that among external financing methods, Chinese publicly listed companies rely more on equity financing for R&D, followed by debt financing. In contrast, the impact of the current and lagged operating cash flow (cf) on R&D is much smaller (0.006). The joint significance of the change in current and lagged cash holdings (Δcash) is significantly negative (-0.010, the p-value of the χ2 test is 0.006), indicating that Chinese companies also hold cash to smooth R&D expenditures. These are the same as the findings of Brown and Petersen (2011).
In terms of economic significance, according to Mitton (2024), variable cf, stock, debt is economically significant at 0.007, 0.012, 0.011 as a one standard deviation increase in operating cash flow, equity financing, and debt financing is associated with an increase in the R&D intensity of 0.06, 0.15, 0.09 percentage points, which translates to a 1.20%, 3.34%, 2.01% increase in R&D intensity relative to the standard deviation. Variable Δcash is economically significant at -0.010 as a one standard deviation increase in the change in cash holdings is associated with a decrease in the R&D intensity of 0.11 percentage points, which translates to a 2.43% decrease in the R&D intensity relative to the standard deviation.
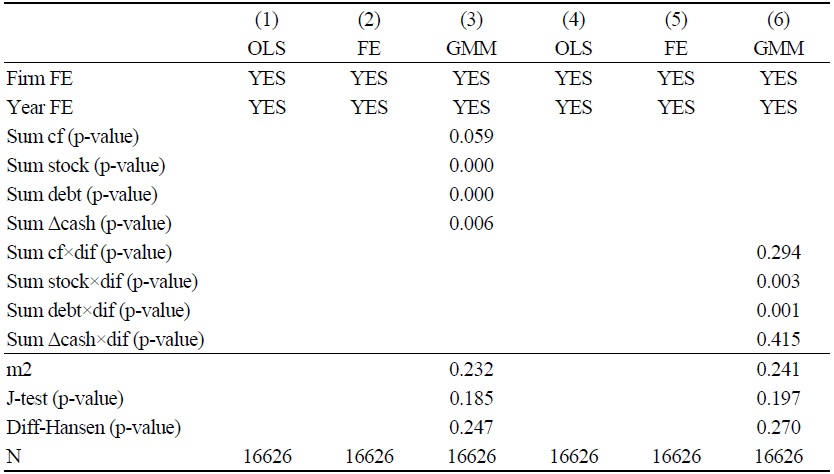
Additional test results are provided at the end of column (3) of Table 6. The values of the m2 test (0.232) indicate the absence of autocorrelation issues, the J-test (0.185) indicates the absence of overidentification problems, and the value of the Diff-Hansen test (0.247) indicates the effectiveness of the instrumental variables. Taken together, these results demonstrate the effectiveness of the GMM estimator.
To test our hypothesis, we built model (2) based on model (1) by introducing the Fintech variable (dift) and the interaction variables between fintech and other variables. The results of the regression analysis are shown in columns (4)-(6) of Table 6, and as above, the coefficient of the lagged R&D (rdt-1) is close to 1 (0.975) and the coefficients estimated by the systematic GMM are located between the OLS and the FE, which suggests that there is no model fitting problem. The coefficient on the quadratic term (rd2t-1) remains negative but insignificant (-0.565), and these are consistent with expectations.
In terms of external financing, the joint significance of the two variables of the current period and lagged equity financing interaction term (stock×dif) and debt financing interaction term (debt×dif) are both significantly positive (0.028, 0.034, the p values of χ2 test respectively (0.003, 0.001), indicating that fintech can promote equity and debt R&D financing. Hypotheses 2 and 3 have been verified. In addition, we can also see from the regression results that fintech promotes R&D debt financing more than equity financing. In terms of internal financing, the joint significance of the interaction term between current period and lagged operating cash flow (cf×dif) is positive but not significant (0.012, the p-value of χ2 test is 0.294), and no evidence can be obtained that fintech promotes internal R&D financing, hypothesis 1 cannot be verified. In terms of R&D smoothing, the joint significance of the interaction term (Δcash×dif) between the current period and lagged cash holdings is negative but not significant (-0.010, the p-value of the χ2 test is 0.415). The relationship between Fintech and R&D smoothing cannot be proven.
As for the control variables, the interaction between firm growth and fintech (grow×dif) is significantly negative, indicating that fintech reinforces the negative relationship between firm growth and R&D intensity. There are two main reasons for this: fintech development makes it more diverse and convenient for enterprises to obtain financing. For example, the popularity of crowdfunding, P2P lending, and online financial platforms has made it easier for firms to obtain funding during periods of revenue growth. This may lead to a greater tendency for firms to invest in shortterm return projects rather than long-term research and development. Second, in cities with high levels of fintech development, capital markets are more active, and investors and financial institutions are more concerned about the short-term performance of firms. This may prompt firm management to prioritize short-term revenue growth at the expense of long-term R&D investment.
Additional test results are presented at the end of column (6) of Table 6. The value of the m2 test (0.241) indicates the absence of autocorrelation issues. The value of the J-test (0.197) suggests no overidentification problems. The value of Diff-Hansen test (0.270) indicates the effectiveness of the instrumental variables. Taken together, these results affirm the effectiveness of the system GMM estimator.
VI. Alternative Tests and Robustness
In this section, we have examined a range of alternative measures and different estimation methods. The conclusions drawn remain consistent with those presented in the previous section, confirming the robustness of our findings.
1. Alternative Sample Splits
Prior research has confirmed the existence of varying degrees of financing constraints among firms (Fazzari et al., 1988; Almeida et al., 2004). We adopted two commonly used indicators to differentiate financing constraints: firm size and age. Following the approach of Brown and Petersen (2011), we categorized firms based on firm size and age. As highlighted by (Gertler and Gilchrist, 1994), during economic downturns, monetary tightening leads to a greater influx of credit funds into large firms, resulting in higher cash flow sensitivity for small firms. We grouped firms based on firm size, considering firms with sales above the 70th percentile of the entire sample as large firms, and those below the 30th percentile as SMEs.
Drawing from Devereux and Schiantarelli (1990) findings, different firm ages also lead to varying financing constraints, with younger firms being more susceptible to information asymmetry and thus more sensitive to cash flows. We classified firms aged 15 years or less as young firms and those older as mature firms. Furthermore, considering the unique characteristics of China’s socialist market economy, ownership structure serves as a third indicator for classifying firms’ financing constraints. Liu et al. (2021) pointed out that due to implicit government guarantees, financial institutions prefer SOEs when extending credit, making them more likely to access bank loans and thus having lower financing constraints than private enterprises. Building upon this insight, we divided the sample into SOEs and non-SOEs, representing low and high financing constraints.
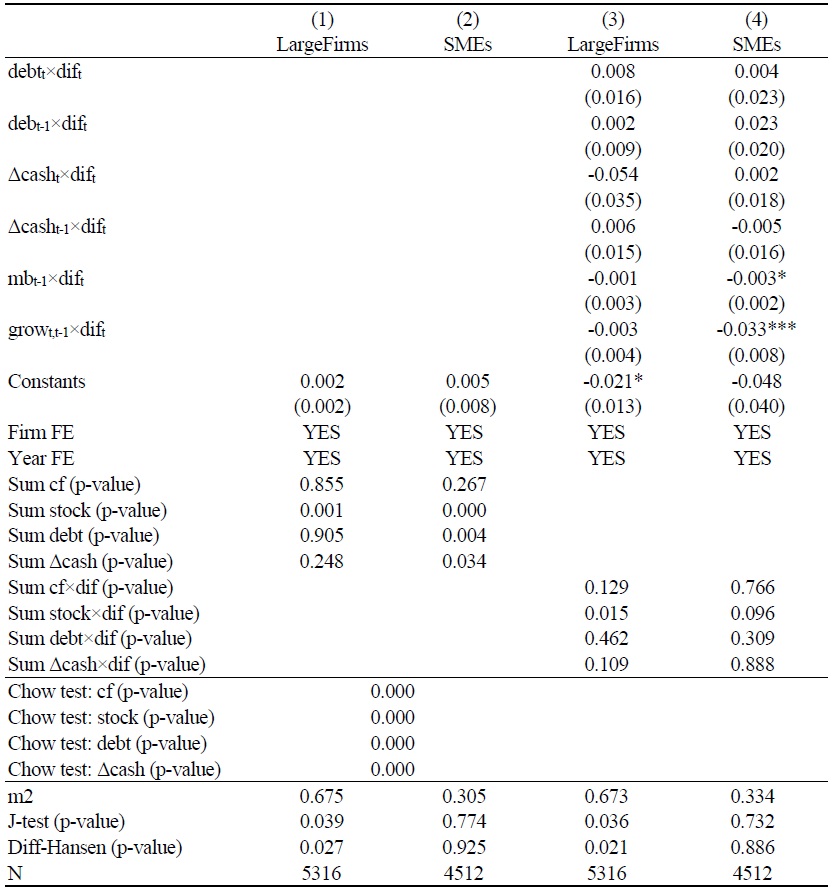
The results of grouping by firm size are shown in Table 7. Columns (1) and (3) are the regression results for the large firm sample; it can be seen that only the joint significance of the current and lagged equity financing (stock) is significantly positive (0.015, the p-value of the χ2 test is 0.001), while the joint significance of the current and lagged equity financing interaction term (stock×dif) is also significantly positive (0.038, p-value of 0.015 for χ2 test), but unfortunately, our test does not pass, so we change the lagged order of the instrumental variables to 3 to 4 periods, at which point the test passes in its entirety (test results are omitted) and the results are unchanged. It suggests that for large firms, equity financing is the main source of R&D and that fintech can facilitate R&D equity financing.
Columns (2) and (4) show the regression results for the sample of SMEs. It can be seen that, unlike large enterprises, the joint significance of the current and lagged equity financing (stock) and debt financing (debt) of SMEs are significantly positive (-0.027, -0.028, the p-value of the χ2 test is 0.000, 0.004, respectively), which indicates that for SMEs, equity and debt financing are the main sources of R&D; the joint significance of change in cash holdings (Δcash) is significantly negative (-0.016, p-value of 0.034 for the χ2 test), indicating that SMEs engage in R&D smoothing behavior. On the other hand, the joint significance of the interaction term of current and lagged equity financing only (stock×dif) is significantly positive (0.032, the p-value of 0.096 for the χ2 test), suggesting that for SMEs, fintech promotes R&D equity financing, which is the same as that of large firms. The test results at the end of columns (2) and (4) of Table 7 show no autocorrelation or over-identification problem and the instrumental variables are valid.
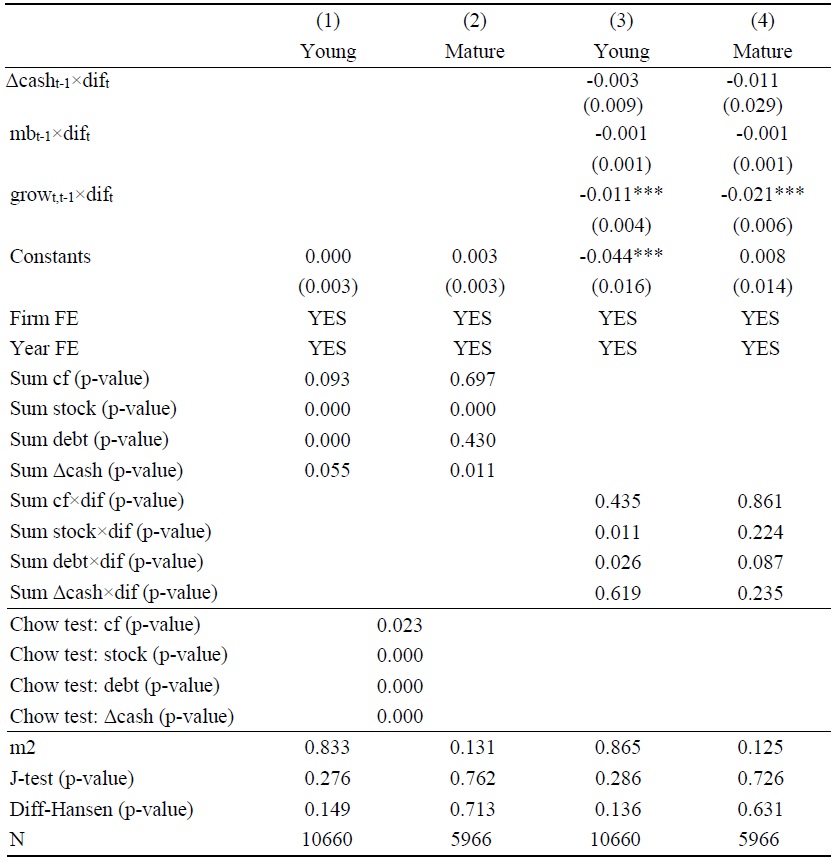
The results of grouping by firm age are shown in Table 8. Columns (1) and (3) are the regression results for the sample of young firms; it can be seen that the joint significance of current and lagged operating cash flow (cf), equity financing (stock), and debt financing (debt) for young firms are all significantly positive (0.008, 0.020, 0.021, and the p-value of χ2 test (0.093, 0.000, 0.000), indicating that for young firms, internal financing, equity financing, and debt financing are the main sources of R&D, and enterprises rely on external financing more than internal financing; the joint significance of the change in cash holdings (Δcash) is significantly negative (-0.008, the p-value of the χ2 test is 0.055), suggesting that young firms have R&D smoothing behavior. On the other hand, the joint significance of the current and lagged equity financing interaction term (stock×dif) and the debt financing interaction term (debt×dif) are significantly positive (0.028, 0.027, and the p-value of the χ2 test is 0.011 and 0.026, respectively), suggesting that, for young firms, fintech promotes external financing of R&D. The test results presented at the end of columns (1) and (3) of Table 8 show that there is no autocorrelation problem, there is no over-identification problem, and the instrumental variables are valid.
Columns (2) and (4) show the regression results for the sample of mature firms. It can be seen that the joint significance of current and lagged equity financing (stock) is significantly positive (0.019, the p-value of 0.000 for the χ2 test), suggesting that for mature firms only equity financing is the main source of R&D; the joint significance of change in cash holdings (Δcash) is significantly negative (-0.017, the p-value of 0.011 for the χ2 test), suggesting that R&D smoothing behavior is also present for mature firms. On the other hand, while the joint significance of the interaction term of current and lagged debt financing only (debt × dif) is significantly positive (0.035, the p-value of 0.087 for the χ2 test), the joint significance of the current and lagged debt financing (debt) is not significant (0.004, p-value of 0.430 for the χ2 test), suggesting that for mature firms, no evidence of fintech facilitating R&D financing can be found. To ensure the robustness of the results, we further tested the marginal effect of debt. Upon testing, we find that the marginal effect of debt on rd is insignificant at low, medium, and high levels of dif (t-values of 1.96, 0.55, and -0.99, respectively). This indicates that our results are robust. The results of the tests presented at the end of columns (2) and (4) of Table 8 show that all the tests are passed, and it is clear that the results of the system GMM estimator are valid.
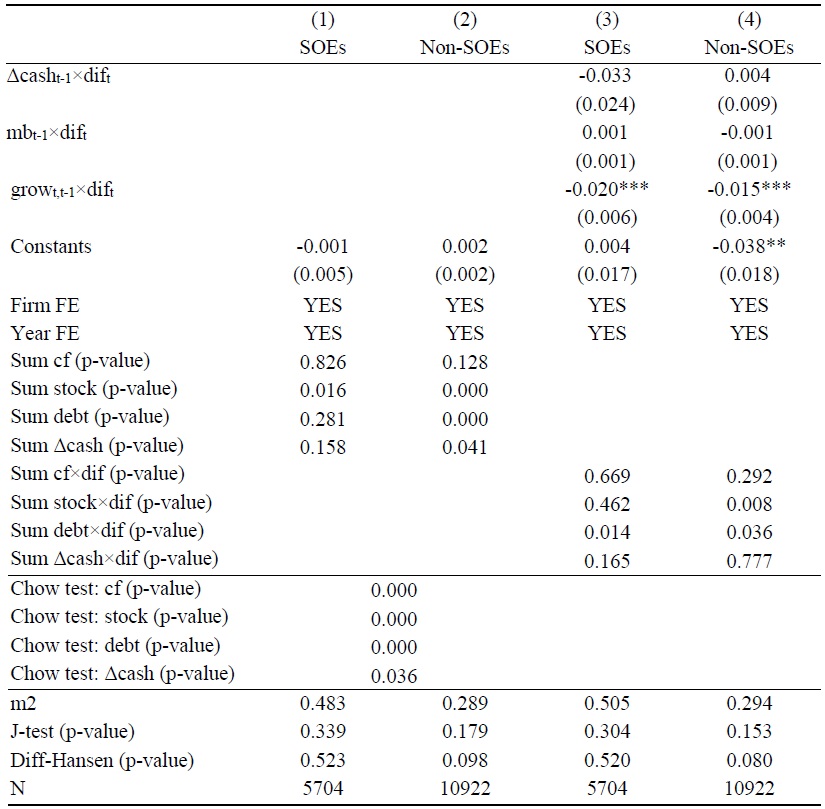
The results grouped by firm ownership structure are shown in Table 9. Columns (1) and (3) show the regression results for the SOE sample. It can be seen that the joint significance of the current and lagged equity financing (stock) for SOEs is significantly positive (0.015, and p-value of 0.016 for the χ2 test), which suggests that for SOEs, equity financing is the R&D main funding source. On the other hand, while the joint significance of the current and lagged debt financing interaction term (debt × dif) is significantly positive (0.042, the p-value of 0.014 for the χ2 test), the joint significance of the current and lagged debt financing (debt) is not significant (0.006, p-value of 0.281 for the χ2 test), suggesting that for SOEs, no evidence can be found that fintech promotes R&D financing. To ensure the robustness of the results, we further tested the marginal effect of debt. Upon testing, we find that the marginal effect of debt on rd is insignificant at low, medium, and high levels of dif (t-values of -1.31, -0.52, and 0.37, respectively). This indicates that our results are robust. The results of the tests presented at the end of columns (1) and (3) of Table 9 show no autocorrelation problem or over-identification problem, and the instrumental variables are valid.
Columns (2) and (4) show the regression results for the sample of non-state enterprises. It can be seen that the joint significance of current and lagged equity financing (stock) and debt financing (debt) of non-state enterprises are significantly positive (0.021, 0.017, the p-value of the χ2 test is 0.000, 0.000, respectively), which indicates that for non-state enterprises, external financing is the main source of R&D; the joint significance of the change in cash holdings (Δcash) are significantly negative (-0.008, the p-value of 0.041 for the χ2 test), suggesting that R&D smoothing behavior also exists for non-SOEs. On the other hand, the joint significance of the current and lagged equity financing interaction term (stock × dif) and the debt financing interaction term (debt × dif) are significantly positive (0.029, 0.026, the p-value of the χ2 test is 0.008 and 0.036, respectively), suggesting that, for non-state firms, fintech facilitates external financing of R&D. The test results presented at the end of columns (2) and (4) of Table 9 show that all the tests pass at the 5% significance level. We change the lag order of the instrumental variables to 3 to 4 periods, at which point the tests all pass (test results omitted), and the results are unchanged. It can be seen that the results of the system GMM estimator are valid.
2. Alternative Instruments and Estimation Methods
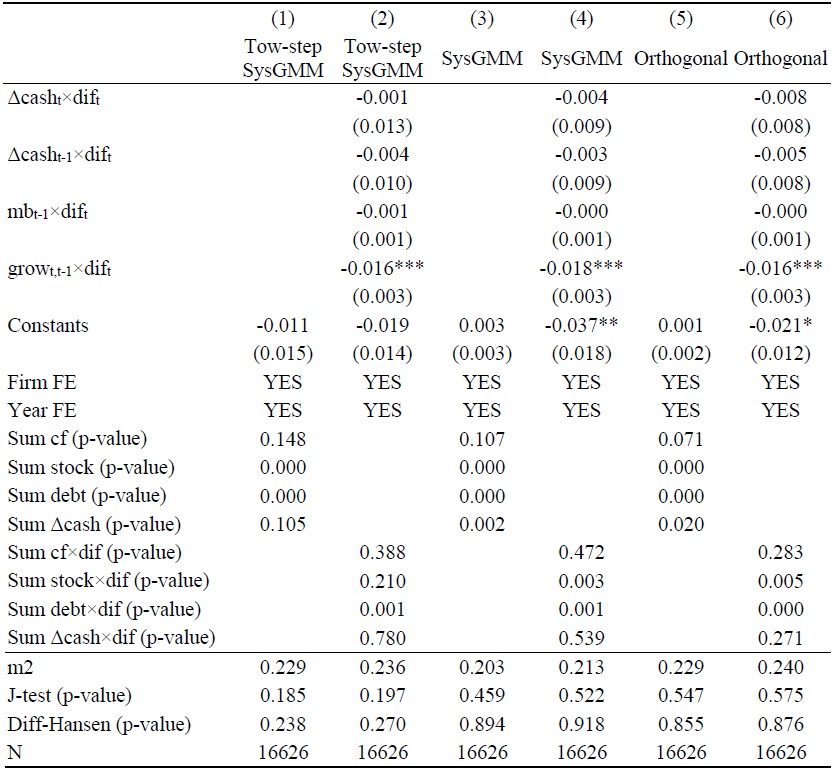
In this section, we have conducted robustness tests on the research findings previously proposed using alternative instruments and estimation methods, and we have found that the results remain robust. Firstly, we re-estimated Equations (1) and (2) using the two-step GMM approach. While the two-step GMM is more efficient than the one-step GMM, the standard errors of the two-step GMM tend to be downward biased in small samples (Arellano and Bond, 1991). The results of the two-step GMM estimation are presented in Columns (1) and (2) of Table 10, and they closely resemble the results in Tables 6.
Secondly, we adjusted the lag order of instrumental variables, using lagged levels dated t-4 or deeper as instruments in the difference equation and lagged differences dated t-3 or deeper as instruments in the level equation. The results in Columns (3) and (4) of Table 10 yield similar conclusions.
Thirdly, we employed orthogonal transformation as a substitute for first-order differencing to eliminate firm-specific effects. Unbalanced panel datasets suffer data loss during first-order differencing. Using forward orthogonal transformation, which involves subtracting the mean of all observations in preceding periods from the current value, can mitigate data loss and enhance estimation accuracy (Arellano and Bover, 1995). The results of this alternative approach are presented in Columns (5) and (6) of Table 10, and they also yield similar conclusions. Taken together, these findings demonstrate the robustness of our conclusions.
Finally, we were also concerned about the possible impact of macroeconomic factors, so based on prior research, we selected five macroeconomic level control variables: regional GDP per capita, industrial structure, education and technology expenditures, years of education per capita, and the growth rate of regional GDP, which were added to the model and shown in Table 11, with no substantial change in the findings. In addition, we were also concerned about the possible impact of industry factors, so we added industry-fixed effects. Again, we did not find substantial changes in the conclusions (the results were not reported due to space constraints).
VII. Conclusions and Policy Recommendations
The specificity of R&D leads to uncertainty regarding R&D financing, and the lack of a continuous and stable funding source cannot guarantee the normal conduct of R&D. It may even lead to R&D failure and increase the risk of bankruptcy. In this study, we try to find evidence that fintech affects R&D financing, and it is found that fintech promotes R&D external financing. Still, no evidence is found on the impact of fintech on R&D internal financing and R&D smoothing. After subgroup regressions, we find no significant heterogeneity between large firms and SMEs regarding R&D external financing. Still, the effect of fintech on R&D external financing is significant for young and non-state-owned firms, and no similar evidence is found for mature and state-owned firms.
Our research provides the following policy recommendations: first, fintech can facilitate external financing for firms, promoting business innovation and economic growth. The government should increase investment in fintech infrastructure to ensure an efficient, stable, and secure fintech service network covers the whole country, especially remote and economically relatively backward areas. In addition, it should encourage fintech enterprises to make technological innovations in areas such as payment, lending, and credit collection, and it should support the development of fintech enterprises by setting up special funds and providing tax incentives.
Second, fintechs should optimize their products and provide financial services in a targeted manner. The government should formulate special fintech support policies for young and non-state-owned enterprises, such as setting up special fintech loans and subsidies and providing relevant education and training to enhance their fintech literacy. Mature and state-owned enterprises should optimize traditional financing channels, promote the deep integration of fintech and traditional finance, and develop new financial products and services to enhance their financing efficiency.
Third, to promote the common development of fintech in East Asia, countries can learn from China’s successful experience in mobile payment, blockchain technology, big data risk control, etc. By establishing a cross-border cooperation mechanism, promoting regional fintech standardization, strengthening the exchange of technology and talents, and supporting cross-border fintech projects, we can enhance the overall level of fintech and its innovation capacity in the region and thus optimize the countries’ R&D financing environment and enhance the competitiveness of the East Asian region in the global fintech sector.
It is important to note that our study also has limitations. First, other sources include informal sources of finance (Xiao, 2011), government support (Chen et al., 2020), and venture capital (Hall and Lerner, 2010). These are not the focus of this article, so they are not mentioned, and they will also be the direction of further research in the future.
Second, although this study controls for city-level macro variables, there may still be omitted variables that are not fully captured, such as the policy environment, social capital, and other economic factors that may affect firms’ R&D investment. In addition, firms may choose to locate in fintech-developed cities based on their own needs and strategies, and this selection bias may lead to an overestimation of the impact on fintech development. To mitigate the effects of these biases, we tried to use various estimation methods, but these methods do not completely eliminate all potential biases, so the study results need to be interpreted with caution.
Third, we used the index published by the Digital Finance Research Centre of Peking University to measure urban fintech variables. Although this index has a certain degree of scientific validity and has been widely used in scientific research, it may still suffer from the inability to objectively and comprehensively measure the state of urban fintech development. In the future, we should explore better metrics to make the study results more convincing.
Future research could capture the long-term impact of FinTech development through longer periods and broader city-data. Meanwhile, combining qualitative research methods, such as interviews and case studies, to better understand firms’ R&D decision-making processes in the FinTech environment could provide richer insights. In addition, a cross-country comparative study to analyze the impact of fintech development on firms’ R&D intensity in different countries or regions can help test the generalizability of the results and extend the applicability of the findings.
Tables & Figures
Figure 1.
Distribution of FinTech Index by Province in 2020
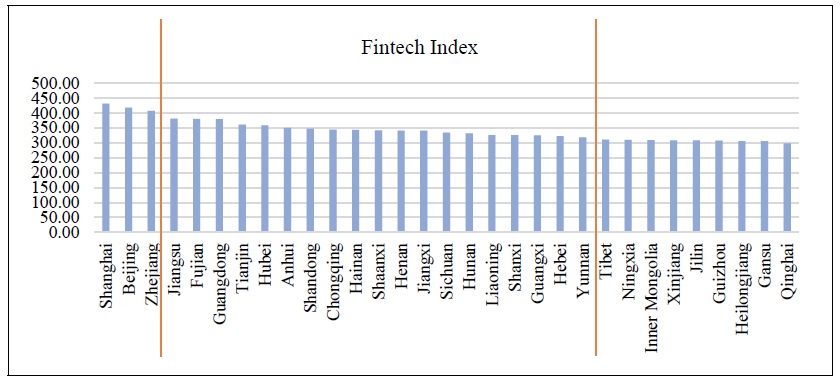
Table 1.
Variable Definitions
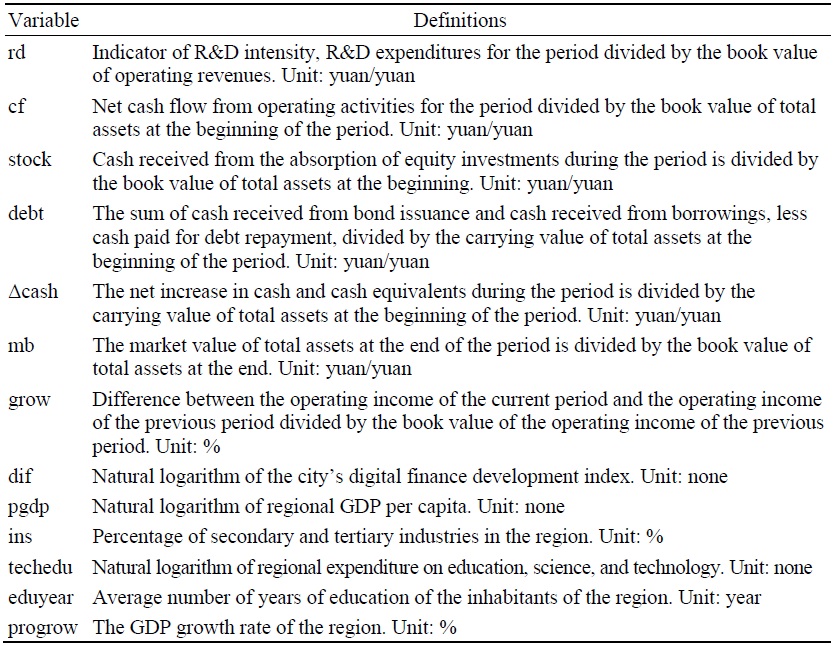
Table 2.
Distribution of Sample by Industry
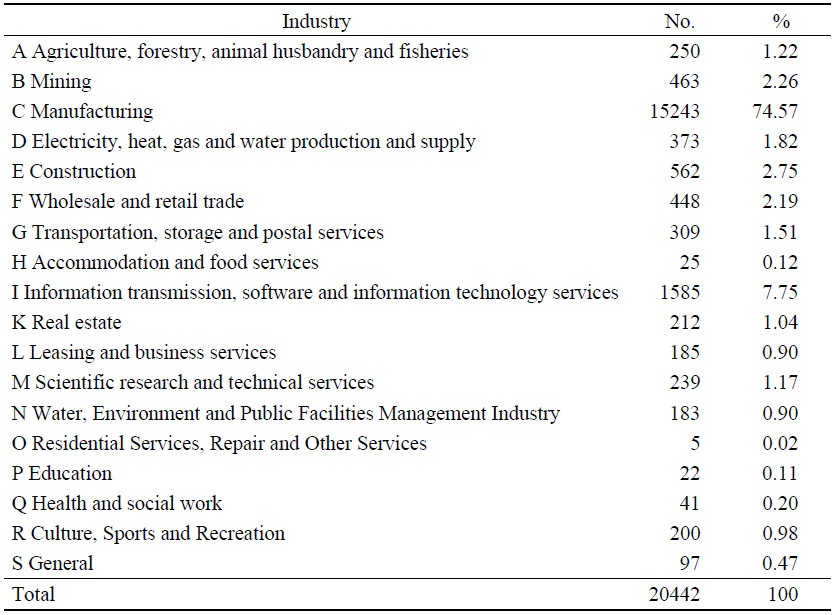
Note: The study further divides the manufacturing industry into 30 subcategories, which are no longer listed in the table.
Table 3.
Distribution of Sample by Regions
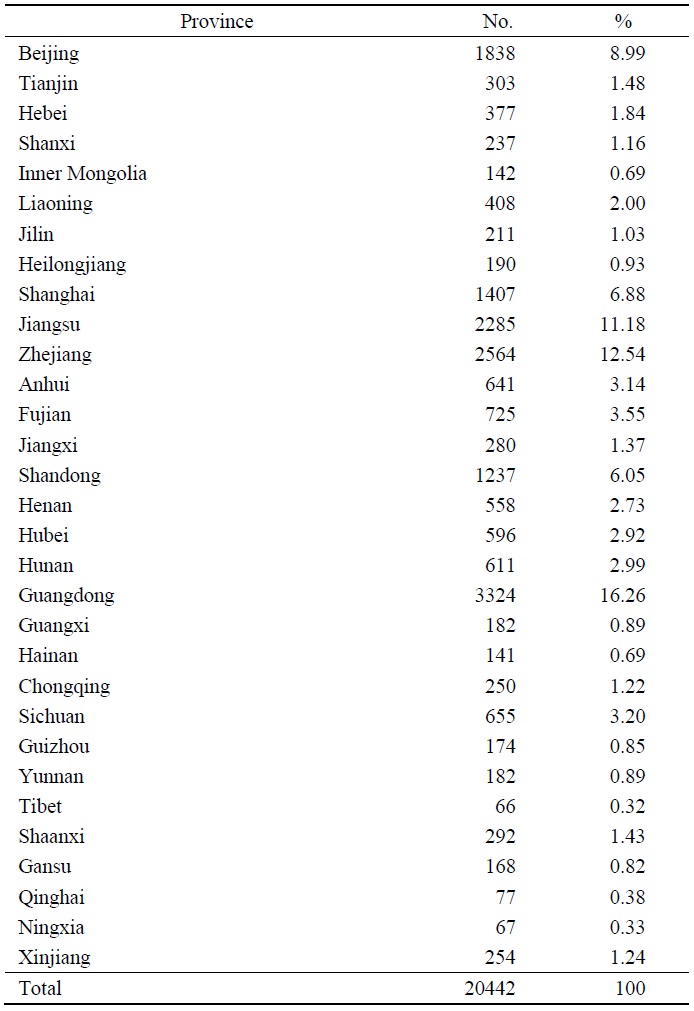
Table 4.
Summary Statistics
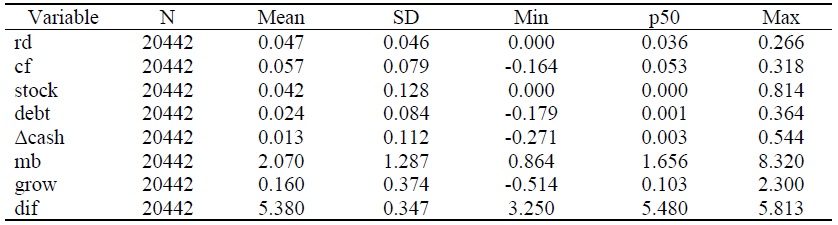
Notes: The regression sample is constructed from A-share listed companies on the main board of China’s Shenzhen Stock Exchange and Shanghai Stock Exchange covered in the China Stock Market & Accounting Research (CSMAR) database from 2011 to 2020. Fintech data comes from the “Peking University Digital Financial Inclusion Index” (2011-2020) (PKU-DFIIC). We excluded firms in the financial industry with ST for three consecutive years and with missing data on major variables before they entered the sample. All variables are winsorized at the 1% level. See
Table 5.
Correlation Matrix
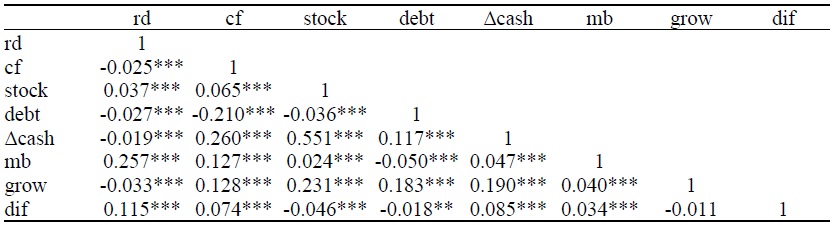
Notes: This table presents the Pearson correlation among all the variables used in multiple regressions. Coefficients marked with *, ** and *** indicate significance at the 10%, 5% and 1% levels, respectively. See
Table 6.
Baseline Regression
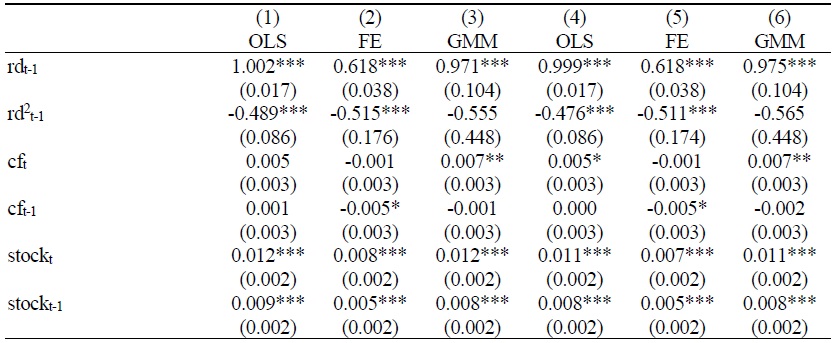
Table 6.
Continued
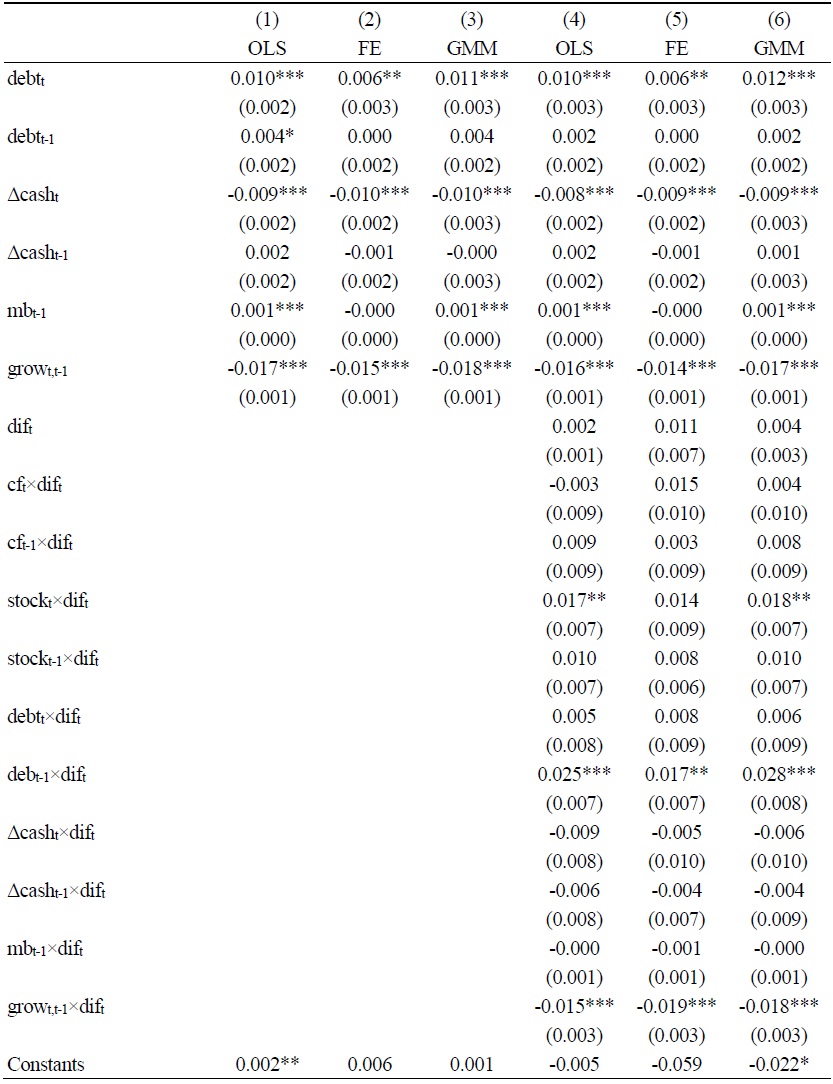
Table 6.
Continued
Notes: This table estimates R&D funding sources and the impact of Fintech on R&D financing. Estimation is by one-step systems GMM with lagged levels dated t-3 used as instruments for the equation in differences and lagged differences dated t-2 used as instruments for the equation in levels. Fixed firm and time effects are included in all regressions. Standard errors are robust to heteroskedasticity and within firm serial correlation. All variables are winsorized at the 1% level. See
Table 7.
Large Firms versus SMEs
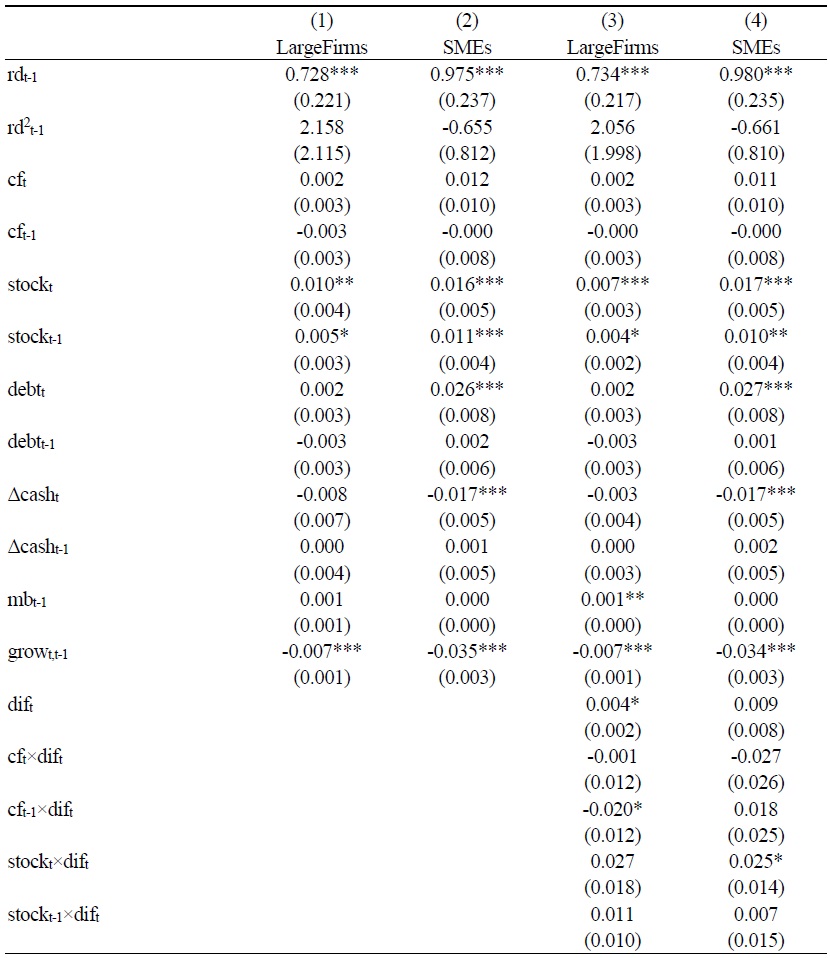
Table 7.
Continued
Notes: This table estimates dynamic R&D regressions using alternative sample splits of large firms and SMEs. Estimation is by one-step systems GMM with lagged levels dated t-3 used as instruments for the equation in differences and lagged differences dated t-2 used as instruments for the equation in levels. Fixed firm and time effects are included in all regressions. Standard errors are robust to heteroskedasticity and within firm serial correlation. All variables are winsorized at the 1% level. See
Table 8.
Young Firms versus Mature Firms
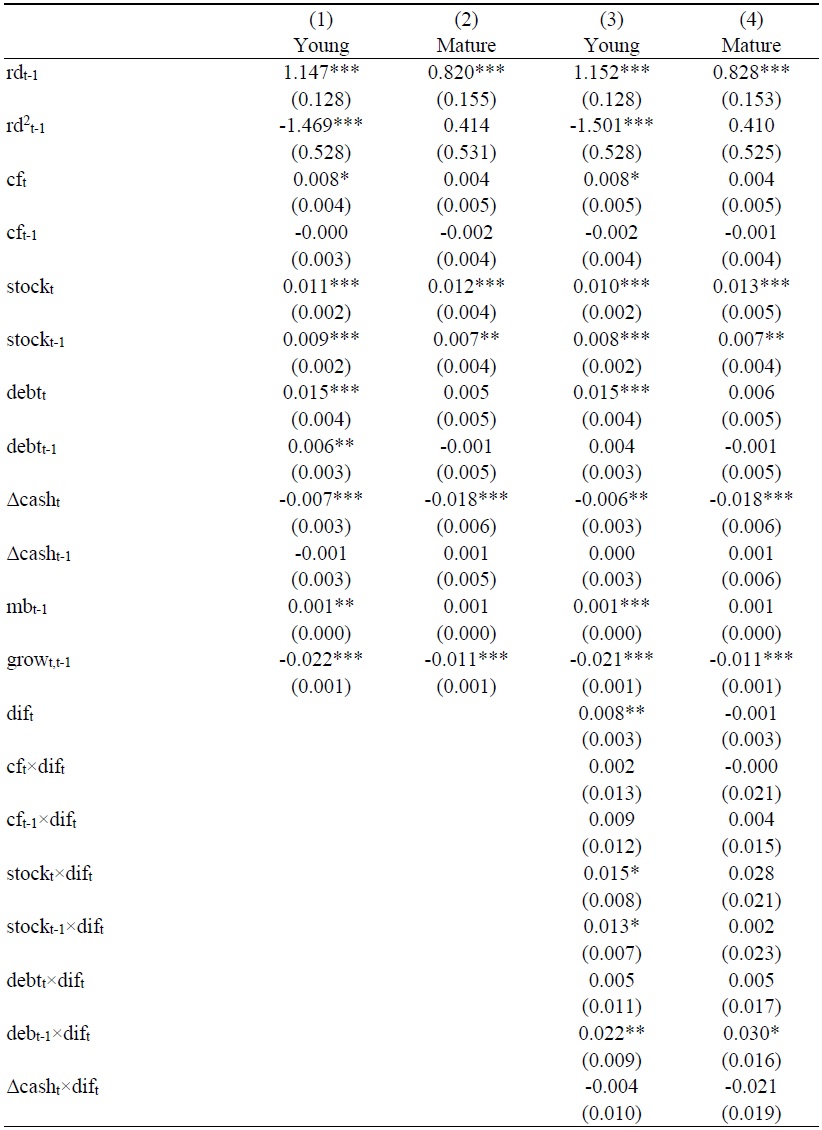
Table 8.
Continued
Notes: This table estimates dynamic R&D regressions using alternative sample splits of young and mature firms. Estimation is by one-step systems GMM with lagged levels dated t-3 used as instruments for the equation in differences and lagged differences dated t-2 used as instruments for the equation in levels. Fixed firm and time effects are included in all regressions. Standard errors are robust to heteroskedasticity and within firm serial correlation. All variables are winsorized at the 1% level. See
Table 9.
SOEs versus non-SOEs
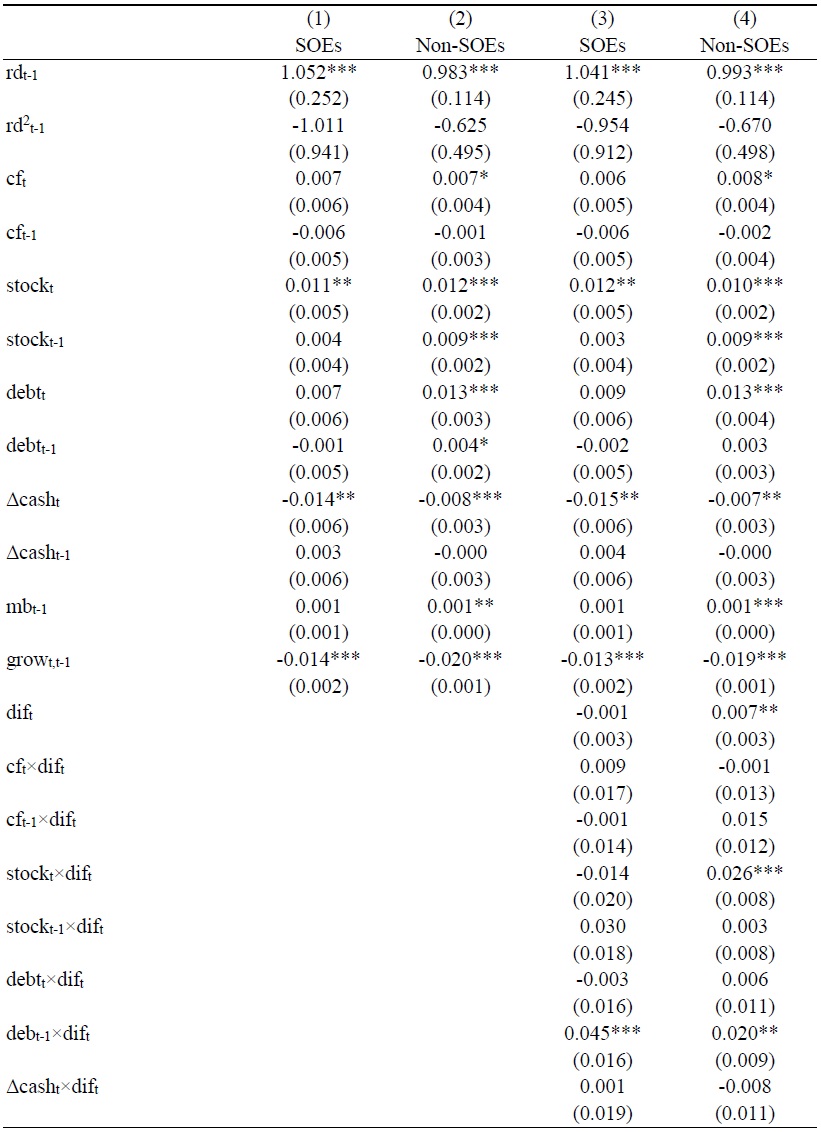
Table 9.
Continued
Notes: This table estimates dynamic R&D regressions using alternative sample splits of SOEs and non-SOEs. Estimation is by one-step systems GMM with lagged levels dated t-3 used as instruments for the equation in differences and lagged differences dated t-2 used as instruments for the equation in levels. Fixed firm and time effects are included in all regressions. Standard errors are robust to heteroskedasticity and within firm serial correlation. All variables are winsorized at the 1% level. See
Table 10.
Alternative Instruments and Estimation Methods
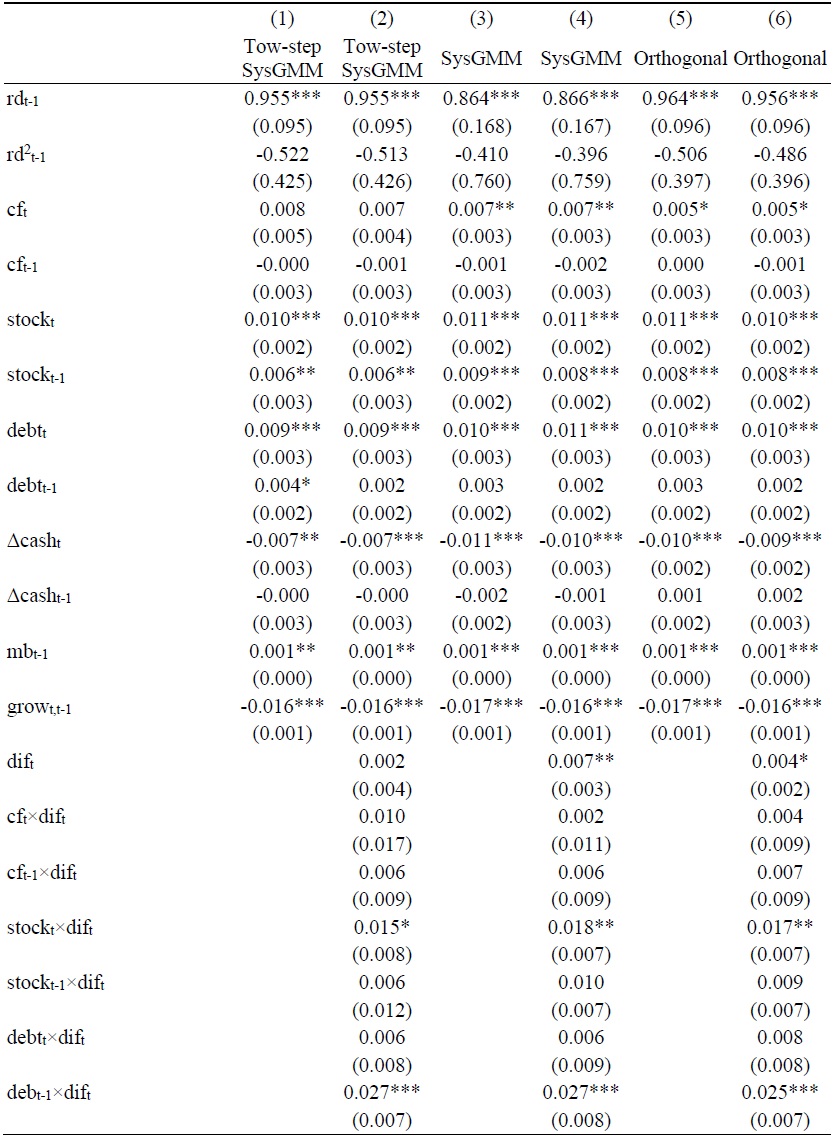
Table 10.
Continued
Notes: This table estimates the robustness of dynamic R&D regressions using a two-step system GMM (columns 1-2), increasing the lag order of instrumental variables (columns 3-4) and an orthogonal transformation (columns 5-6), respectively. Fixed firm and time effects are included in all regressions. Standard errors are robust to heteroskedasticity and within firm serial correlation. All variables are winsorized at the 1% level. See
Table 11.
Regression with Macro Control Variables
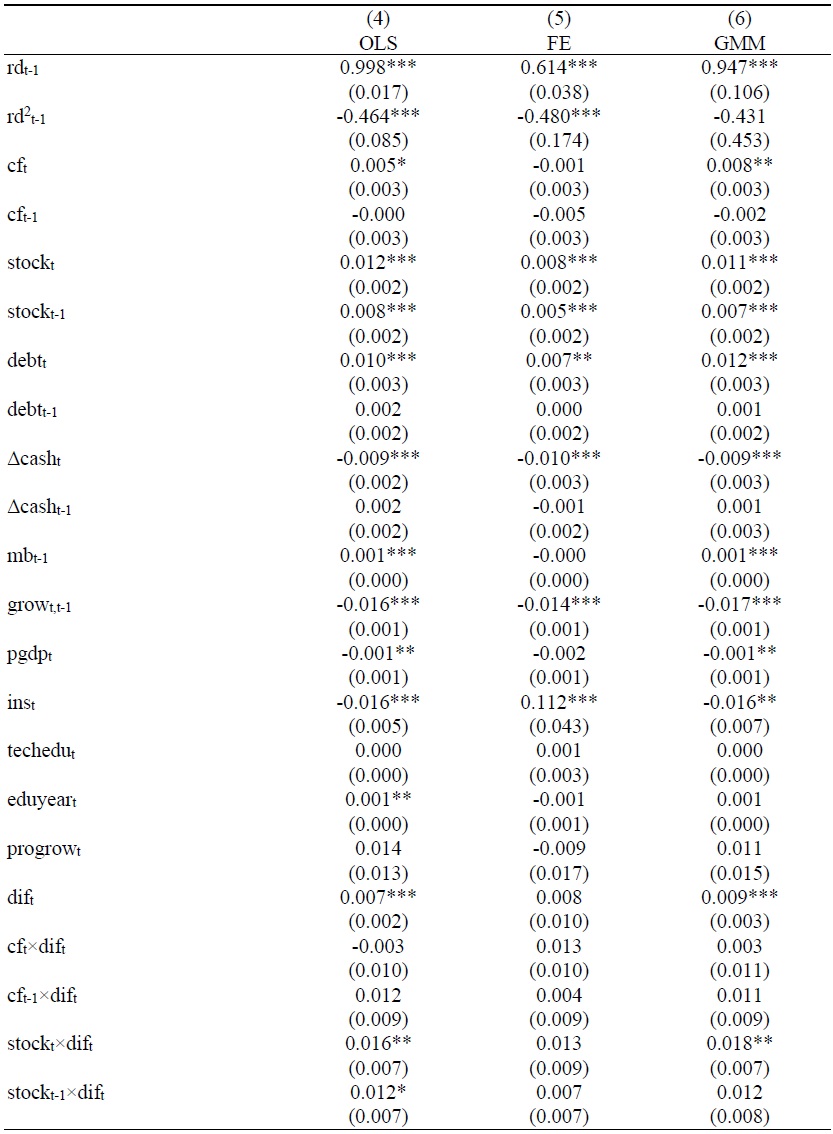
Table 11.
Continued
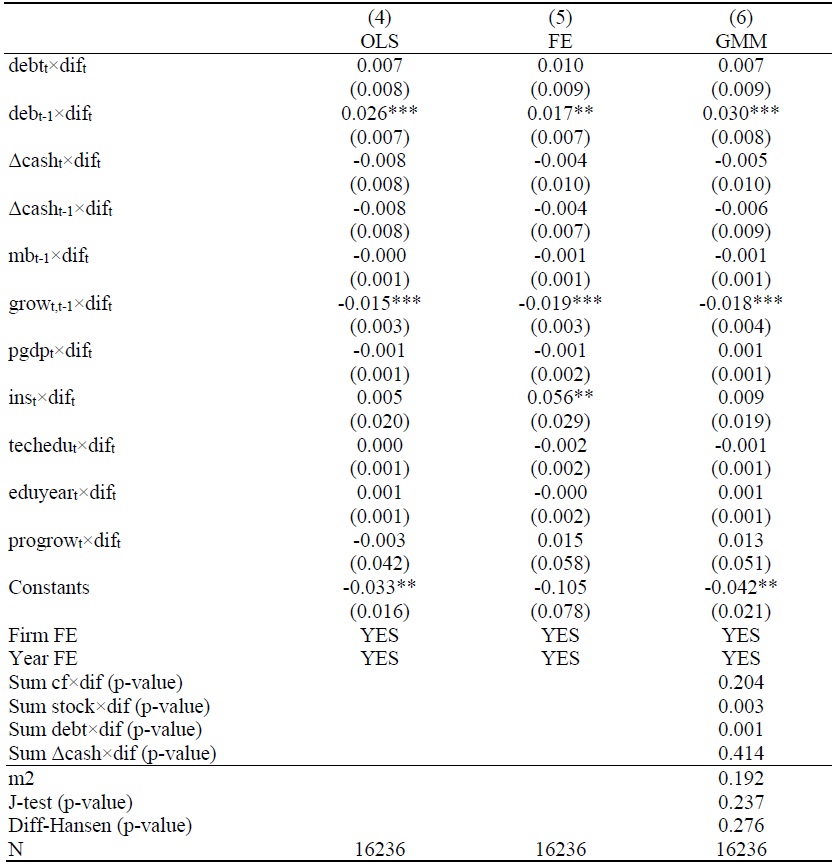
Notes: This table estimates the impact of FinTech on R&D financing after adding macro control variables. Estimation is by one-step systems GMM with lagged levels dated t-3 used as instruments for the equation in differences and lagged differences dated t-2 used as instruments for the equation in levels. For comparison, we include the results of OLS and FE estimation. Fixed firm and time effects are included in all regressions. Standard errors are robust to heteroskedasticity and within firm serial correlation. All variables are winsorized at the 1% level. See
References
-
Acharya, V. V. and K. V. Subramanian. 2009. “Bankruptcy codes and innovation.”
The Review of financial studies , vol. 22, no. 12, pp. 4949-4988.
-
Alam, A., Uddin, M., and H. Yazdifar. 2019. “Institutional determinants of R&D investment: Evidence from emerging markets.”
Technological Forecasting and Social Change , vol. 138, pp. 34-44.
-
Almeida, H., Campello, M., and M. S. Weisbach. 2004. “The cash flow sensitivity of cash.”
The journal of finance , vol. 59, no. 4, pp. 1777-1804.
-
Anokhin, S., and W. S. Schulze. 2009. “Entrepreneurship, innovation, and corruption.”
Journal of business venturing , vol. 24, no. 5. pp. 465-476.
-
Arellano, M., and S. Bond. 1991. “Some tests of specification for panel data: Monte Carlo evidence and an application to employment equations.”
The review of economic studies , vol. 58, no. 2. pp. 277-297.
-
Arellano, M., and O. Bover. 1995. “Another look at the instrumental variable estimation of error-components models.”
Journal of Econometrics , vol. 68, no. 1, pp. 29-51.
-
Arner, D. W., Barberis, J., and R. P. Buckley. 2015. “The evolution of Fintech: A new postcrisis paradigm.”
Geo. J. Int’l L. , vol. 47, pp. 1271. -
Arora, A., Ceccagnoli, M., and W. M. Cohen. 2008. “R&D and the patent premium.”
International journal of industrial organization , vol. 26, no. 5, pp. 1153-1179.
-
Arrow, K. J. 1972. “Economic Welfare and the Allocation of Resources for Invention.” In Rowley, C. K. (ed.)
Readings in Industrial Economics: Volume Two: Private Enterprise and State Intervention , London: Macmillan Education UK, pp. 219-236. -
Atanassov, J., Julio, B., and T. Leng. 2024. “The bright side of political uncertainty: The case of R&D.”
The Review of financial studies , hhae023. -
Barge-Gil, A., and A. López. 2014. “R&D determinants: Accounting for the differences between research and development.”
Research Policy , vol. 43, no. 9, pp. 1634-1648.
-
Blind, K., Petersen, S. S., and C. A. Riillo. 2017. “The impact of standards and regulation on innovation in uncertain markets.”
Research Policy , vol. 46, no. 1, pp. 249-264.
-
Blundell, R., and S. Bond. 1998. “Initial conditions and moment restrictions in dynamic panel data models.”
Journal of Econometrics , vol. 87, no. 1, pp. 115-143.
-
Blundell, R., Griffith, R., and J. V. Reenen. 1999. “Market share, market value and innovation in a panel of British manufacturing firms.”
The review of economic studies , vol. 66, no. 3, pp. 529-554.
-
Bollaert, H., Lopez-de-Silanes, F., and A. Schwienbacher. 2021. “Fintech and access to finance.”
Journal of Corporate Finance , vol. 68, no. 101941. -
Boot, A., Hoffmann, P., Laeven, L., and L. Ratnovski. 2021. “Fintech: what’s old, what’s new?”
Journal of Financial Stability , vol. 53, no. 100836. -
Brown, J. R., Fazzari, S. M., and B. C. Petersen. 2009. “Financing innovation and growth: Cash flow, external equity, and the 1990s R&D boom.”
The journal of finance , vol. 64, no. 1, pp. 151-185.
-
Brown, J. R., Martinsson, G., and B. C. Petersen. 2012. “Do financing constraints matter for R&D?”
European Economic Review , vol. 56, no. 8, pp. 1512-1529.
-
Brown, J. R., and B. C. Petersen. 2011. “Cash holdings and R&D smoothing.”
Journal of Corporate Finance , vol. 17, no. 3, pp. 694-709.
-
Buchak, G., Matvos, G., Piskorski, T., and A. Seru. 2018. “Fintech, regulatory arbitrage, and the rise of shadow banks.”
Journal of Financial Economics , vol. 130, no. 3, pp. 453-483.
-
Cyberspace Administration of China. 2023. “Digital China Development Report (2022).”
https://www.cac.gov.cn/2023-05/22/c_1686402318492248.htm (accessed on June 10, 2024) -
Carpenter, R. E., and B. C. Petersen. 2002. “Capital Market Imperfections, High-Tech Investment, and New Equity Financing.”
The economic journal , vol. 112, no. 477, pp. F54-F72.
-
Chen, M. A., Wu, Q., and B. Yang. 2019. “How Valuable Is FinTech Innovation?”
The Review of financial studies , vol. 32, no. 5, pp. 2062-2106.
-
Chen, Z., He, Z., and C. Liu. 2020. “The financing of local government in China: Stimulus loan wanes and shadow banking waxes.”
Journal of Financial Economics , vol. 137, no. 1, pp. 42-71.
-
Coad, A. and R. Rao. 2010. “Firm growth and R&D expenditure.”
Economics of Innovation and New Technology , vol. 19, no. 2, pp. 127-145.
-
Cohen, W. M. and R. C. Levin. 1989. “Empirical studies of innovation and market structure.”
Handbook of industrial organization , vol. 2, pp. 1059-1107. - Cohen, W. M., Levin, R. C., and D. C. Mowery. 1987. “Firm size and R&D intensity: A reexamination.” National Bureau of Economic Research. Cambridge, Mass., USA.
-
Crépon, B., Duguet, E., and J. Mairessec. 1998. “Research, innovation and productivi [ty: an econometric analysis at the firm level.”
Economics of Innovation and New Technology , vol. 7, no. 2, pp. 115-158.
-
Dalziel, T., Gentry, R. J., and M. Bowerman. 2011. “An integrated agency–resource dependence view of the influence of directors’ human and relational capital on firms’ R&D spending.”
Journal of Management Studies , vol. 48, no. 6, pp. 1217-1242.
-
Del Canto, J. G. and I. S. Gonzalez. 1999. “A resource-based analysis of the factors determining a firm’s R&D activities.”
Research Policy , vol. 28, no. 8, pp. 891-905.
-
Devereux, M. and F. Schiantarelli. 1990. “Investment, financial factors, and cash flow: Evidence from UK panel data.”
Asymmetric information, corporate finance, and investment . University of Chicago Press, pp. 279-306. -
Ding, N., Gu, L., and Y. Peng. 2022. “Fintech, financial constraints and innovation: Evidence from China.”
Journal of Corporate Finance , vol. 73, no. 102194. -
Fan, C., Bae, S., and Y. Liu. 2024. “Can FinTech transform corporate liquidity? Evidence from China.”
Innovation and Green Development, , vol. 3, no. 2, 100114.
-
Fazzari, S. M., Hubbard, R. G., and B. C. Petersen. 1988. “Financing Constraints and Corporate Investment.”
Brookings papers on economic activity , vol. 1, pp. 141-206.
-
Fuster, A., Plosser, M., Schnabl, P., and J. Vickery. 2019. “The role of technology in mortgage lending.”
The Review of financial studies , vol. 32, no. 5, pp. 1854-1899.
-
Geroski, P. A. 1990. “Innovation, technological opportunity, and market structure.”
Oxford economic papers , vol. 42, no. 3, pp. 586-602.
-
Gertler, M. and S. Gilchrist. 1994. “Monetary Policy, Business Cycles, and the Behavior of Small Manufacturing Firms.”
The quarterly journal of economics , vol. 109, no. 2, pp. 309-340.
-
Gomber, P., Kauffman, R. J., Parker, C., and B. W. Weber. 2018. “On the Fintech Revolution: Interpreting the Forces of Innovation, Disruption, and Transformation in Financial Services.”
Journal of Management Information Systems , vol. 35, no. 1, pp. 220-265.
-
Gomber, P., Koch, J.-A., and M. Siering. 2017. “Digital Finance and FinTech: current research and future research directions.”
Journal of Business Economics , vol. 87, no. 5, pp. 537-580.
-
Grennan, J. and R. Michaely. 2021. “Fintechs and the market for financial analysis.”
Journal of Financial and Quantitative Analysis , vol. 56, no. 6, pp. 1877-1907.
-
Griliches, Z., Hall, B. H., and A. Pakes. 1991. “R&D, patents, and market value revisited: is there a second (technological opportunity) factor?”
Economics of Innovation and New Technology , vol. 1, no. 3, pp. 183-201.
-
Guo, F., Wang, J., Wang, F., Kong, T., Zhang, X., and Z. Cheng. 2020. “Measuring China’s Digital Financial Inclusion: Index Compilation and Spatial Characteristics,”
China Economic Quarterly , vol. 19, no. 4, pp. 1401-1418. (in Chinese) -
Guo, J., Fang, H., Liu, X., Wang, C., and Y. Wang. 2023. “FinTech and financing constraints of enterprises: Evidence from China.”
Journal of International Financial Markets, Institutions and Money , vol. 82, no. 101713. -
H2Ventures, and KPMG. 2016.
“2016 Fintech100: Leading Global fintech innovators” https://kpmg.com/cz/en/home/insights/2016/10/ventures-kpmg-fintech-fs.html . (accessed on June 10, 2024) - Hall, B. H. 1992. “Investment and research and development at the firm level: does the source of financing matter?” National bureau of economic research Cambridge, Mass., USA.
-
Hall, B. H. 2002. “The Financing of Research and Development.”
Oxford Review of Economic Policy , vol. 18, no. 1, pp. 35-51.
-
Hall, B. H., Griliches, Z., and J. A. Hausman. 1986. “Patents and R and D: Is There a Lag?”
International Economic Review , vol. 27, no. 2. pp. 265-283.
-
Hall, B. H. and J. Lerner. 2010. “Chapter 14. The Financing of R&D and Innovation.” In Hall B. H., and N. Rosenberg. (eds.)
Handbook of the Economics of Innovation . North-Holland, pp. 609-639. -
Harris, M. N., Rogers, M., and A. Siouclis. 2003. “Modelling firm innovation using panel probit estimators.”
Applied Economics Letters , vol. 10, no. 11, pp. 683-686.
-
He, Z. and S. Ciccone. 2020. “Too much liquidity? Seemingly excess cash for innovative firms.”
Financial Review , vol. 55, no. 1, pp. 121-144.
-
Himmelberg, C. P. and B. C. Petersen. 1994. “R & D and Internal Finance: A Panel Study of Small Firms in High-Tech Industries.”
The review of economics and statistics , vol. 76, no. 1, pp. 38-51.
-
Holmstrom, B. 1989. “Agency costs and innovation.”
Journal of Economic Behavior & Organization , vol. 12, no. 3, pp. 305-327.
-
Huang, S. 2022. “Does FinTech improve the investment efficiency of enterprises? Evidence from China’s small and medium-sized enterprises.”
Economic Analysis and Policy , vol. 74, pp. 571-586.
-
Javorcik, B. S. and S.-J. Wei. 2009. “Corruption and cross-border investment in emerging markets: Firm-level evidence.”
Journal of International Money and Finance , vol. 28, no. 4, pp. 605-624.
-
Julio, B. and Y. Yook. 2012. “Political uncertainty and corporate investment cycles.”
The journal of finance , vol. 67, no. 1, pp. 45-83.
-
Juniper Research. 2022. “QR Code Payments: Key Opportunities, Competitor Leaderboard & Marketing Forecasts 2022-2026.”
https://www.juniperresearch.com/pressreleases/qrcode-payments-to-reach-3tn-globally (accessed on June 10, 2024) -
Kauffman, R. J., Liu, J., and D. Ma. 2015. “Innovations in financial IS and technology ecosystems: High-frequency trading in the equity market.”
Technological Forecasting and Social Change , vol. 99, pp. 339-354.
-
Kim, H., Kim, H., and P. M. Lee. 2008. “Ownership structure and the relationship between financial slack and R&D investments: Evidence from Korean firms.”
Organization Science , vol. 19, no. 3, pp. 404-418.
-
Kim, H. and S.-Y. Park. 2012. “The relation between cash holdings and R&D expenditures according to ownership structure.”
Eurasian Business Review , vol. 2, pp. 25-42.
-
Lai, X., Yue, S., Guo, C., and X. Zhang. 2023. “Does FinTech reduce corporate excess leverage? Evidence from China.”
Economic Analysis and Policy , vol. 77, pp. 281-299.
-
Lai, Y.-L., Lin, F.-J., and Y.-H. Lin. 2015. “Factors affecting firm’s R&D investment decisions.”
Journal of Business Research , vol. 68, no. 4, pp. 840-844.
-
Lee, I. and Y. J. Shin. 2018. “Fintech: Ecosystem, business models, investment decisions, and challenges.”
Business Horizons , vol. 61, no. 1, pp. 35-46.
-
Lin, A., Peng, Y., and X. Wu. 2022. “Digital finance and investment of micro and small enterprises: Evidence from China.”
China Economic Review , vol. 75, no. 101846. -
Liu, J., Wang, Z., and W. Zhu. 2021. “Does privatization reform alleviate ownership discrimination? Evidence from the Split-share structure reform in China.”
Journal of Corporate Finance , vol. 66, no. 101848. -
Luo, S., Sun, Y., Yang, F., and G. Zhou. 2022. “Does fintech innovation promote enterprise transformation? Evidence from China.”
Technology in Society , vol. 68, no. 101821. -
Lv, P. and H. Xiong. 2022. “Can FinTech improve corporate investment efficiency? Evidence from China.”
Research in International Business and Finance , vol. 60, no. 101571. -
Macchiavello, E. 2023. “Sustainable Finance and Fintech. A Focus on Capital Raising.”
https://ssrn.com/abstract=4471584 -
Mahmood, I. P. and C. Rufin. 2005. “Government’s dilemma: The role of government in imitation and innovation.”
Academy of management review , vol. 30, no. 2, pp. 338-360.
-
Manez, J. A., Rochina‐Barrachina, M. E., Sanchis, A., and J. A. Sanchis. 2009. “The role of sunk costs in the decision to invest in R&D.”
The Journal of Industrial Economics , vol. 57, no. 4, pp. 712-735.
-
Mansfield, E. 1986. “Patents and innovation: an empirical study.”
Management Science , vol. 32, no. 2, pp. 173-181.
-
Mansfield, E., Schwartz, M., and S. Wagner. 1981. “Imitation costs and patents: an empirical study.”
The economic journal , vol. 91, no. 364, pp. 907-918.
-
Martinsson, G. 2010. “Equity financing and innovation: Is Europe different from the United States?”
Journal of Banking & Finance , vol. 34, no. 6, pp. 1215-1224.
-
Masino, S. 2015. “Macroeconomic volatility, institutional instability and the incentive to innovate.”
Review of Development Economics , vol. 19, no. 1, pp. 116-131.
-
Mitton, T. 2024. “Economic Significance in Corporate Finance.”
The Review of Corporate Finance Studies , vol. 13, no. 1, pp. 38-79.
-
Myers, S. C. and N. S. Majluf. 1984. “Corporate financing and investment decisions when firms have information that investors do not have.”
Journal of Financial Economics , vol. 13, no. 2, pp. 187-221.
-
Navaretti, G. B., Calzolari, G., Mansilla-Fernandez, J. M., and A. F. Pozzolo. 2018. “Fintech and banking. Friends or foes?”
European Economy-Banks, Regulation, and the Real Sector . -
Nelson, R. R. 1959. “The simple economics of basic scientific research.”
Journal of Political Economy , vol. 67, no. 3, pp. 297-306.
-
Park, Y., Shin, J., and T. Kim. 2010. “Firm size, age, industrial networking, and growth: A case of the Korean manufacturing industry.”
Small business economics , vol. 35, pp. 153-168.
-
Rammer, C., Czarnitzki, D., and A. Spielkamp. 2009. “Innovation success of non-R&Dperformers: substituting technology by management in SMEs.”
Small business economics , vol. 33, pp. 35-58.
-
Romānova, I. and M. Kudinska. 2016. “Banking and fintech: A challenge or opportunity?”
Contemporary issues in finance: Current challenges from across Europe . Emerald Group Publishing Limited. pp. 21-35. -
Schmookler, J. 1966.
Invention and economic growth . Harvard University Press. -
Schumpeter, J. A. 1942.
Capitalism, socialism and democracy . New York (reprinted 1960): Harper and Row. -
Seitz, M. and M. Watzinger. 2017. “Contract enforcement and R&D investment.”
Research Policy , vol. 46, no. 1, pp. 182-195.
-
Shim, Y. and D.-H. Shin. 2016. “Analyzing China’s Fintech Industry from the Perspective of Actor–Network Theory.”
Telecommunications Policy , vol. 40, no. 2, pp. 168-181.
-
Stiglitz, J. E., McFadden, D., and S. Peltzman. 1987. “Technological change, sunk costs, and competition.”
Brookings papers on economic activity , 1987. no. 3, pp. 883-947.
-
Szczygielski, K., Grabowski, W., Pamukcu, M. T., and V. S. Tandogan. 2017. “Does government support for private innovation matter? Firm-level evidence from two catching-up countries.”
Research Policy , vol. 46, no. 1, pp. 219-237.
-
Szewczyk, S. H., Tsetsekos, G. P., and Z. Zantout. 1996. “The valuation of corporate R&D expenditures: Evidence from investment opportunities and free cash flow.”
Financial Management , vol. 25, no. 1, pp. 105-110.
-
Tan, Z., Wang, H., and Y. Hong. 2023. “Does bank FinTech improve corporate innovation?”
Finance Research Letters , vol. 55, part A, no. 103830. -
Tomiura, E. 2007. “Effects of R&D and networking on the export decision of Japanese firms.”
Research Policy , vol. 36, no. 5, pp. 758-767.
-
Tsai, K. H. and J. C. Wang. 2004. “The R&D performance in Taiwan’s electronics industry: a longitudinal examination.”
R&D Management , vol. 34, no. 2, pp. 179-189.
-
Weerawardena, J., O’Cass, A., and C. Julian. 2006. “Does industry matter? Examining the role of industry structure and organizational learning in innovation and brand performance.”
Journal of Business Research , vol. 59, no. 1, pp. 37-45.
-
Xiao, L. 2011. “Financing high-tech SMEs in China: A three-stage model of business development.”
Entrepreneurship & Regional Development , vol. 23, no. 3-4, pp. 217-234.
-
Zhang, L., Zhang, S., and Y. Guo. 2019. “The effects of equity financing and debt financing on technological innovation.”
Baltic Journal of Management , vol. 14, no. 4, pp. 698-715.
-
Zuhdi, U., Edo, M., and M. Ratnawati. 2015. “Determinants of firm innovation in Indonesia: the role of institutions and access to finance.”
Economics and Finance of Indonesia , vol. 61, pp. 149-179.