

- EAER>
- Journal Archive>
- Contents>
- articleView
Contents
Citation
| No | Title |
|---|---|
| 1 | Key Success Factors for Export Structure Optimization in East Asian Countries Through Global Value Chain (GVC) Reorganization / 2025 / Systems / vol.13, no.1, pp.22 / |
| 2 | Modeling the Ningbo Container Freight Index Through Deep Learning: Toward Sustainable Shipping and Regional Economic Resilience / 2025 / Sustainability / vol.17, no.10, pp.4655 / |
| 3 | China futures market and world container shipping economy: An exploratory analysis based on deep learning / 2025 / Research in International Business and Finance / vol.76, pp.102870 / |
Article View
East Asian Economic Review Vol. 28, No. 3, 2024. pp. 359-388.
DOI https://dx.doi.org/10.11644/KIEP.EAER.2024.28.3.439
Number of citation : 3View
107
Download
47
Shanghai Containerised Freight Index Forecasting Based on Deep Learning Methods: Evidence from Chinese Futures Markets
|
|
Kyonggi University |
|---|---|
|
|
Chung-Ang University |
|
|
Kyonggi University |
|
|
Kyonggi University |
|
|
Kyonggi University |

Abstract
With the escalation of global trade, the Chinese commodity futures market has ascended to a pivotal role within the international shipping landscape. The Shanghai Containerized Freight Index (SCFI), a leading indicator of the shipping industry’s health, is particularly sensitive to the vicissitudes of the Chinese commodity futures sector. Nevertheless, a significant research gap exists regarding the application of Chinese commodity futures prices as predictive tools for the SCFI. To address this gap, the present study employs a comprehensive dataset spanning daily observations from March 24, 2017, to May 27, 2022, encompassing a total of 29,308 data points. We have crafted an innovative deep learning model that synergistically combines Long Short-Term Memory (LSTM) and Convolutional Neural Network (CNN) architectures. The outcomes show that the CNN-LSTM model does a great job of finding the nonlinear dynamics in the SCFI dataset and accurately capturing its long-term temporal dependencies. The model can handle changes in random sample selection, data frequency, and structural shifts within the dataset. It achieved an impressive R² of 96.6% and did better than the LSTM and CNN models that were used alone. This research underscores the predictive prowess of the Chinese futures market in influencing the Shipping Cost Index, deepening our understanding of the intricate relationship between the shipping industry and the financial sphere. Furthermore, it broadens the scope of machine learning applications in maritime transportation management, paving the way for SCFI forecasting research. The study’s findings offer potent decision-support tools and risk management solutions for logistics enterprises, shipping corporations, and governmental entities.
JEL Classification: G12, L15, O40
Keywords
SCFI Forecast, Futures Market, Machine Learning, Convolution Neural Network, Long and Short-term Memory
I. Introduction
The container shipping industry serves as a critical axis in the global trade integration process, enabling the massive transit of international goods and significantly influencing the stability and efficiency of global supply chains (Azab and Morita, 2022). Within this sector, freight rates exhibit high volatility, which is primarily driven by the continuous shifts in the supply of shipping capacity and the demand for transportation services (Schramm and Munim, 2021). As a central element of container shipping costs, freight rates are of utmost significance to all parties involved in international maritime trade and transportation, including shippers and carriers (Tian et al., 2024). The ability to accurately predict future changes and fluctuations in containerized freight rates is essential for effective decision-making (Saeed and Omlin, 2023). The SCFI is a pivotal tariff and price indicator within the shipping industry, renowned for its capacity to mirror the dynamism of economic activity (Jiang et al., 2018). The SCFI index is extensively utilized as a tool for assessing the balance between demand and supply, the state of containerized transport, global trade dynamics, and the overall health of the shipping industry (Koyuncu and Tavacıo?lu, 2021; Jung and Hur, 2024).
Amidst the backdrop of economic globalization, the Chinese futures market has emerged as a pivotal player within the global maritime financial ecosystem (Yang et al., 2021; Kim, 2024). The influence of commodity prices within the Chinese futures market on the shipping industry is particularly profound (Gong et al., 2020). The SCFI, a crucial metric for gauging the state of the container shipping market, is intimately connected to the Chinese futures market and acutely responsive to its fluctuations (Jiang et al., 2018). Changes in the SCFI not only sway market sentiment and investor expectations but also serve as a significant driver of price volatility in the futures market (Munim and Schramm, 2021). Investors and financial analysts frequently employ shipping indices like the SCFI as economic indicators to forecast shifts in stocks, commodities, and other financial markets (Park et al., 2023). Concurrently, bulk carrier owners, charterers, and other transportation entities are increasingly turning to the SCFI as a foundational element in formulating key strategies and executing business plans. Consequently, a comprehensive understanding and command of the relationship between the SCFI and the futures market are essential for accurately predicting market trends and devising effective investment risk management strategies (Jiang et al., 2018; Kim and Tromp, 2024).
In recent years, scholarly interest in shipping price indices has surged, yet there remains a paucity of research on the use of Chinese futures commodity indices to predict such indices. Studies on shipping indices have traditionally concentrated on three primary areas: First, the Baltic Dry Index (BDI) has been widely regarded as an indirect proxy for market expectations regarding the global economy and trade. The BDI has been instrumental in predicting various economic variables, including exchange rate fluctuations, inflation, and demand for raw materials, energy, and agricultural transportation (Angelopoulos, 2017; Bildirici et al., 2015; Papailias et al., 2017; Han et al., 2020). Secondly, researchers have been captivated by the quantitative relationship between the China Containerized Freight Index (CCFI) and commodity markets (Saeed and Omlin, 2023; Tian et al., 2024; Chen and Kim, 2024). In recent years, a growing body of research has shifted its focus to the forecasting challenge of the SCFI, acknowledging that it is a non-stationary, nonlinear time series influenced by a multitude of complex variables (Jiang et al., 2018; Hirata and Matsuda, 2022). However, early attempts at freight index forecasting primarily employed econometric models based on causality, which necessitate a certain level of regularity and smoothness in the input data. Moreover, these econometric models often exhibited significant prediction errors due to the unique data characteristics of the SCFI. Studies have demonstrated that AI-based approaches can yield superior results compared to traditional econometric and statistical models (Hirata and Matsuda, 2022). Consequently, researchers have turned to AI techniques such as artificial neural networks (ANN), the long short-term memory (LSTM) method, and nonlinear regression analysis to predict the SCFI (Hirata and Matsuda, 2022). However, the limitations of single AI prediction methods, which can be prone to overfitting or underfitting, have led to concerns about their reliability. As such, the efficacy of single machine learning approaches has been called into question (Zhang et al., 2019). Consequently, the pursuit of dependable SCFI predictions through the analysis of multivariate data presents a highly promising avenue, particularly when leveraging the synergistic power of integrating various machine learning models.
Therefore, this paper poses two central research questions:
(i) Which futures indicators can effectively predict SCFI?
(ii) Which forecasting models can improve the accuracy of SCFI forecasts?
In order to address the above research questions and fill the gap in the field of SCFI forecasting research, this study employs a deep learning integrated model to assess the effectiveness of the Chinese commodity futures market in forecasting SCFI. Daily data from March 24, 2017 to May 27, 2022, totaling 29,308 observations, were utilized in this study. Based on these data, we constructed a deep learning integrated model (CNN-LSTM) consisting of a CNN and a LSTM, aiming to improve the accuracy of SCFI prediction. The results show that the CNN-LSTM model performs well in accurately identifying nonlinear properties and capturing complex fluctuations in SCFI data. The model outperforms a single LSTM and CNN model on the SCFI prediction task (R² value of 96.6%). In particular, the model outperforms several traditional models, such as ARIMA and SVR. In addition, the CNN-LSTM model demonstrated strong adaptability to random sample selection, data frequency variations, and structural discontinuities present in the sample population, reflecting the dynamics of the shipping market.
This paper makes numerous contributions. First, we approach the subject from the perspective of machine learning. This study proposes the CNN-LSTM integrated model, which comprehensively mines and utilizes the data features of the Chinese futures market. It significantly improves SCFI’s prediction accuracy and effectively captures the shipping market’s nonlinear and time-varying features. Secondly, this study expands the scope of machine learning methods in the field of shipping finance, thereby demonstrating the significant potential of the Chinese futures market to forecast global shipping indices and offering a novel perspective on the intricate relationship between the Chinese financial market and the shipping industry. Lastly, the model’s application extends beyond SCFI forecasting, as it can also track the latest advancements in the shipping finance sector. This offers pertinent stakeholders the ability to modify their portfolios and operational strategies in real time, thereby fostering sustainable business development and preserving the financial market’s overall stability.
The structure of the remainder of this study is as follows: Section 2 will delve into the methodology for forecasting the SCFI and provide an overview of the relevant literature on Chinese futures. Section 3 will detail the data utilized and the approach to integrating the deep learning models. Section 4 will present the empirical findings and conduct a comparative analysis. Finally, Section 5 will offer discussion and conclusions based on the research findings. Additionally, Section 6 will address the limitations of our study and provide suggestions for future research directions.
II. Literature Review
1. SCFI Forecasting Study
With the rising trend of containerization in sea cargo transportation, the demand for specialized tariff indices within the container shipping sector has intensified significantly (Schramm and Munim, 2021). Therefore, the Shanghai Stock Exchange established the SCFI to fill this gap in the market. Although other container tariff indices were published at the same time, such as the World Container Index (WCI), Ningbo Container Freight Index (NCFI), Baltic Global Container Freight Index (FBX), and more recently, the Xeneta Shipping Index, which is published by a freight rate benchmarking organization (Schramm and Munim, 2021). However, to date, only the CCFI and SCFI have received more academic attention (Munim and Schramm, 2017; Nielsen et al., 2014). In particular, SCFI is an important component of the CCFI system, which is regarded as a “barometer” of the shipping market (Jiang et al., 2018).
The fluctuations of SCFI can accurately reflect the dynamics of the Shanghai container freight market (Jiang et al., 2018). SCFI focuses on spot prices in the Shanghai export container transportation market, which are generally considered to be cyclical and sensitive (Koyuncu and Tavacıo?lu, 2021). The current spot rates in the Shanghai export container transportation market include a composite index, 15 routes, and tariffs. The tariff index reflects the ocean freight rates and related ocean surcharges for each route in the spot market, covering the following routes for exports from Shanghai: Europe, Mediterranean Sea, U.S. West Coast, U.S. East Coast, Persian Gulf, Australia/New Zealand, West Africa, South Africa, South America, West Japan, East Japan, Southeast Asia, and South Korea (Koyuncu and Tavacıo?lu, 2021). SCFI refers to the volume-weighted average price of a common shipper’s manifest in the spot market, which does not take into account the specificity of the shipper’s enterprise and the effect of container volume.
The SCFI has been widely used as a key indicator of the dynamism of economic activity. Used by investors and financial analysts as an indicator of containerized freight rates, predicting movements in stocks, commodities, and other financial markets. Jiang et al. (2018) selected the SCFI to conduct a study on the current state of the shipping industry and market in China. The link between maritime shipping and export trade along the Maritime Silk Road was examined. Nielsen et al. (2014) developed a containerized freight rate forecasting model that investigated the relationship between the composite market rate (i.e., SCFI) and individual liner rates. Their model focused on performance and robustness based on observational fitting and forecast ranges. However, the model has limitations in terms of explanatory power, suggesting that there may be inconsistencies in tariff management mechanisms over time (Munim and Schramm, 2021). In their 2021 study, Schramm and Munim explored the efficacy of an autoregressive integrated moving average (ARIMA) multivariate modeling framework, enhanced by the integration of sentiment and confidence data derived from soft surveys. This framework was applied to forecast the CCFI and the SCFI. The researchers specifically examined the performance of the ARIMA model when augmented with exogenous variables (ARIMAX) and vector autoregression (VAR) techniques. Their findings suggest that the ARIMAX model, when supplemented with soft data, exhibits significantly higher predictive accuracy compared to the standard ARIMA model alone, as further confirmed by Saeed and Omlin (2023). Munim and Schramm (2017) apply ARIMA and ARIMARCH (i.e., a combination of ARIMA and ARCH) models to SCFI and CCFI at the monthly and weekly levels, respectively, for the FE to NEU trade corridor and for the period 2009-2015.The ARIMARCH model, when used at the weekly level for short-term forecasting , provided better results than other ARIMA group models (Munim and Schramm, 2021). Koyuncu and Tavacıo?lu (2021) used a time series model to forecast the SCFI freight rate index, and found that the SARIMA model provided better results than existing freight rate forecasting models when making short-term forecasts of monthly freight rates. better results. Subsequently, Hirata and Matsuda (2022) compared the forecasting effectiveness of the LSTM method and the Seasonal Autoregressive Integrated Moving Average (SARIMA) method for the SCFI. The results of the study show that the LSTM deep learning model outperforms the SARIMA model on most datasets. The study also examines how the SCFI accurately reflects the supply-demand balance, container transportation, global trade dynamics, and the health of the shipping industry as a whole. Previous research has shown that SCFI is better at capturing changes in prices, shipping containers, and the dynamics of global trade. However, LSTM models still have trouble with training and optimizing hyperparameters (Hirata and Matsuda, 2022). CNNs and LSTMs are great at processing image and sequence data, but they are hard to use in real life because they are hard to understand, risk overfitting, can’t generalize well, and need a lot of labeled data (Sherstinsky, 2020; Gu et al., 2018). On the other hand, the volatility of SCFI reveals the changes in supply and demand in the Chinese shipping market and the competitiveness of Chinese shipping companies in the international shipping market. However, most of the previous studies used only a single model and a relatively homogeneous set of factors, which could not fully respond to the complex SCFI fluctuations. Therefore, linking the findings of SCFI with China’s commodity futures market and utilizing the CNN-LSTM integrated model can provide important market sentiment indicators and risk management strategies, and provide market participants with a more forward-looking basis for analysis and decision-making.
2. Futures Market Research
China’s commodity futures market stands as a cornerstone in the global economic architecture, providing participants with a multifaceted suite of functions that encompass not only the critical role of price discovery but also effective risk management and attractive investment opportunities for speculative purposes (Yang et al., 2021). The economic rationale for closely monitoring these prices lies in their ability to offer a transparent window into market dynamics, guide strategic decision-making, and facilitate efficient allocation of resources across the global commodity landscape (Mo et al., 2018). As scholarly interest in commodity futures markets intensifies, the interconnections between China’s futures financial markets and various other markets have been the subject of extensive research (Kang and Yoon, 2019). A central topic within futures market research is the analysis of price volatility. Volatility is a critical element that shapes trading decisions and risk management strategies. Previous studies have employed a variety of statistical and econometric models to investigate the determinants of price volatility in futures markets (Cox et al., 1981). These models have been applied to the study of futures and freight transportation (Prokopczuk, 2011), futures and stock markets (Huo and Ahmed, 2018), futures and energy (Charfeddine et al., 2019), futures and agricultural products (Cartwright and Riabko, 2015), as well as futures and metals (Bosch and Pradkhan, 2015), among other sectors.
Another key area of focus in futures market research pertains to the examination of market efficiency. Scholars have endeavored to probe the operational efficiency of futures markets by examining elements such as regulatory reforms, speculative activities, and the efficiency of information transmission (Bohl et al., 2021; Mohanty and Mishra, 2020). Bandyopadhyay and Rajib (2023) have delved into the asymmetric relationship between the BDI and the spot prices of commodities, offering insights into the informational content of futures prices and identifying potential avenues for opportunity. Furthermore, the influence of external factors on futures market behavior has captured the attention of researchers. Such factors include macroeconomic indicators, shifts in policy, and technological breakthroughs. Studies have investigated the repercussions of these external factors on market volatility, price discovery, and liquidity within futures markets (Kang and Yoon, 2019).
In recent years, there has been a surge in the application of machine learning algorithms within the realm of futures market research. Techniques such as neural networks and ensemble methods have been harnessed to detect patterns, forecast price movements, and formulate automated trading strategies (Bandyopadhyay and Rajib, 2023). These algorithms have demonstrated significant potential in enhancing prediction accuracy and robustness. For instance, Siami-Naminin et al. (2019) utilized ARIMA, LSTM, and BiLSTM models to forecast stock indices across six different markets, concluding that the use of BiLSTM significantly improved forecasting accuracy. Lin et al. (2022) employed a BiLSTM model aided by deep learning-based denoising and the BiLSTM-Attention-CNN model to predict crude oil futures prices, with the combined model outperforming individual models.
Despite these advancements, there is a lack of research exploring the interaction between the SCFI and futures markets. Furthermore, there is an evident gap in the literature connecting SCFI to the Chinese commodity futures market. To bridge this gap and investigate the relationship between SCFI and the Chinese commodity futures market, we propose an integrated deep learning model that combines CNN-LSTM, building upon the findings of previous studies, to predict SCFI utilizing big data from the Chinese commodity futures markets.
III. Research Methodology
1. Data Description
In this study, we develop a model that is crafted from two distinct datasets: one capturing the China Commodity Futures Market Data and the other reflecting the dynamics of the SCFI, each representing a pivotal aspect of their respective markets. The SCFI data is sourced from the Shanghai Shipping Exchange and Clarkson Shipping Company, while the China Commodity Futures dataset encompasses the prices of commodity futures traded on four prominent exchanges in China: the China Financial Futures Exchange (CFFE), Shanghai Futures Exchange (SFE), Dalian Commodity Exchange (Dalian CME), and Zhengzhou Commodity Exchange (Zhengzhou CME). This comprehensive dataset comprises daily pricing data from 2017 through 2022, amounting to a total of 29,308 observations. The richness of these sample datasets provides an ample foundation for the training, testing, and evaluation of the CNN-LSTM integrated models.
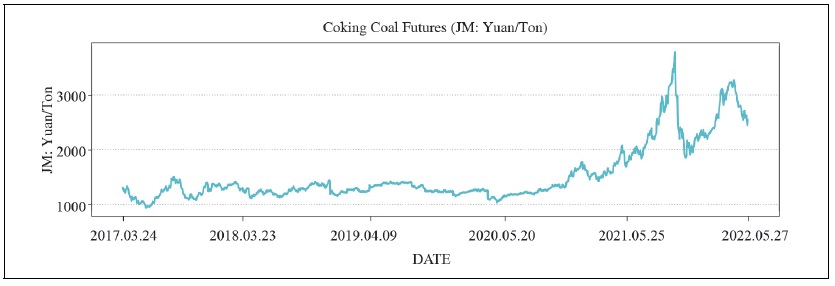
In the proposed model, SCFI is the dependent variable used for forecasting purposes and represents the main focus of the forecasting analysis, i.e., forecasting trends in the container shipping industry. The independent variables, on the other hand, include a wide range of economic indicators and futures market benchmarks. The independent variables include the CCFI, the Clarkson Container Ship Average Yield Index (CACE), which measures the average yield of container ships, and various futures market prices such as rebar futures (RB), copper cathode futures (CU), gold futures (AU), silver futures (AG), cotton futures (CF), soybean futures (YSA), corn futures (YC), thermal coal futures (ZC), and coking coal futures (JM). These futures market prices reflect the market economy’s expectations for the prices of these commodities. These financial market indicators are futures contracts based on Chinese stock market indices and reflect investor sentiment and market performance. This comprehensive set of variables was chosen to capture a variety of economic factors that may affect the SCFI, ranging from direct transportation costs and commodity prices to broader economic trends and market expectations. Tables 1 and 2 provide a detailed statistical summary of the comprehensive dataset, giving a full picture of the characteristics and relationships of the variables.
Appendix presents line graphs that track the progress of various indicators from March 24, 2017, to May 27, 2022. By examining these line graphs, we can discern the trends and cyclical patterns of each indicator more clearly, which in turn enhances our comprehension of the current state and future trajectory of the shipbuilding cost market. Additionally, these charts serve as a valuable tool for analyzing and assessing the predictive capabilities of the proposed CNN-LSTM integrated model, thereby deepening our insights into the complexities of the shipping market.
In the realm of machine learning, researchers frequently employ correlation analysis as an initial step to uncover the relationships between different variables, which can be pivotal in enhancing the accuracy of predictive models. A correlation heat map is a powerful visual tool that represents the statistical correlation between numerical variables, revealing the interconnections among a multitude of factors. The numerical value within each cell of the heat map signifies the strength of the relationship between the corresponding variables, with higher values signifying a stronger correlation and lower values indicating a weaker one. By examining the positive and negative correlations among the features’ values, we can gain insights into the influence of individual features on intuitive predictions. Typically, a high positive correlation is indicated when the Pearson correlation coefficient exceeds 0.7. Figure 1 displays the correlation matrix for the features within our dataset, offering a quantitative glimpse into the interdependencies among the variables.
2. Model
(1) Long short-term memory network (LSTM)
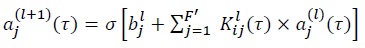
As shown in Figure 2, LSTM networks are a significant advancement over traditional RNNs. They enhance RNNs by adding three key gating units: input gates, forgetting gates, and output gates. The forgetting gate decides what information to discard or keep in the cell state, the input gate adds new information to the cell state, and the output gate passes the updated state to the next time step. This gating system allows the LSTM to store and retrieve historical sequence data more efficiently, allowing for more in-depth analysis of long-term data trends. Economically, this means that LSTMs can capture and learn long-term patterns and cycles that simple models might miss, making them particularly useful for predicting and analyzing complex economic phenomena such as stock market trends, exchange rates, or commodity prices. In this study, the LSTM can capture long-term trends and patterns that are critical for predicting future freight rates, thus effectively modeling the complex dynamics of the SCFI. The ability of the LSTM to mitigate the problems of vanishing gradients and blow-ups also contributes to the robustness and accuracy of economic forecasts. The diagram of the LSTM network structure originates from the study of Sherstinsky (2020).
The LSTM network formula is as follows


where  is the cell state at the current moment;
(2) Convolutional neural networks (CNN)
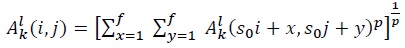
Existing research has shown that CNNs have achieved outstanding success in the field of image vision. CNNs utilize their ability to extract meaningful features from complex time-series data to enable more accurate economic forecasting, in-depth market analysis, and informed policy making. This improves the efficiency and effectiveness of the economic decision-making process, making it a transformative technology in the field of economics (Guo et al., 2023). Figure 3 depicts the structure of CNN, consisting of a convolutional layer, a pooling layer, and a fully connected layer. Existing research has shown that CNNs have achieved outstanding success in the field of image vision. CNNs utilize their ability to extract meaningful features from complex time-series data to enable more accurate economic forecasting, in-depth market analysis, and informed policy making. This improves the efficiency and effectiveness of the economic decision-making process, making it a transformative technology in the field of economics (Guo et al., 2023). Figure 4 (Gu et al., 2018) depicts the structure of CNN, consisting of a convolutional layer, a pooling layer, and a fully connected layer. We can describe the one-dimensional convolutional feature extraction formula as follows:
Among them, the one-dimensional convolutional feature extraction formula can be described as follows.
After the convolution is completed, the pooling layer is used to reduce the feature dimension of the convolution layer output, which can effectively reduce the amount of parameter computation and improve the robustness. The pooling process is described as follows.
(3) CNN-LSTM model
Faced with the complexity and multifaceted nature of the SCFI data, our CNN-LSTM model skillfully extracts valuable insights from this rich dataset by leveraging its innovative architectural design (as shown in Figure 4). The CNN component is a highly sophisticated feature extractor that pinpoints and isolates localized patterns in the data. This process not only simplifies the data by reducing dimensionality but also preserves key time-series information that is critical to understanding the dynamics of the shipping industry (Chen et al., 2023). Now, the refined data, enriched with these enhanced features and simplified in complexity, is seamlessly integrated into LSTM networks. LSTM networks are known for their superior ability to manage and predict time series data by drilling down into the SCFI time series and uncovering subtle longterm dependencies. The SCFI is a key economic indicator of the health of global trade and shipping markets, and this ability is critical to accurately predicting the trajectory of the SCFI. The synergistic fusion of CNN and LSTM models not only improves the accuracy of SCFI predictions but also deepens the model’s understanding of the intricate interconnections within the SCFI data. This advancement provides a solid technological foundation for the efficient management of the shipping economy market. It enables stakeholders to anticipate market trends, optimize shipping operations, and make informed decisions that reduce the risks associated with SCFI volatility. The final model parameters (detailed in Table 3) demonstrate the effectiveness of the model in capturing the essence of the SCFI data, providing economists, shipping companies, and policymakers with a valuable tool to help them navigate the complexities of the global shipping economy.
IV. Results
1. Data Analysis Process
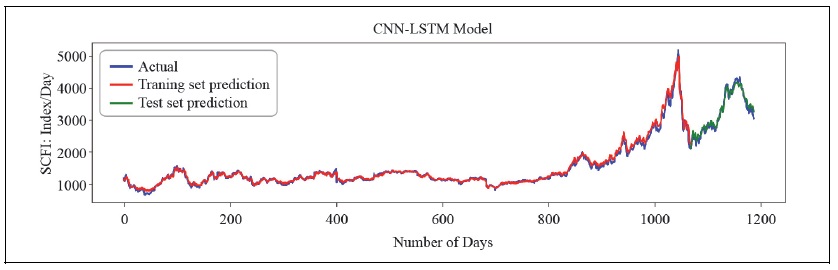
In this research endeavor, we conducted a comparative analysis of three distinct models, one of which was an integrated model, in order to assess its efficacy in predicting SCFI. A series of graphs embodying the results of the models have been produced. Figure 5 illustrates the efficacy of the loss function, quantified by the mean squared error (MSE), utilizing data derived from both the training and test sets. Figures 6, 7, 8 show the combined prediction analysis of the LSTM, CNN, and CNN-LSTM models for the training, prediction, and real datasets, respectively.
We began by analyzing the loss trajectories of each of the three models (Figure 5). The aforementioned trajectories were utilized as metrics to assess the performance of the model in three distinct scenarios: underfitting, appropriate fitting, and overfitting. When validation loss surpasses training loss, it indicates that underfitting has occurred. In contrast, overfitting is indicated by a significant disparity between the validation and training losses or by an upward trend in the validation loss. An acceptable fit is indicated when the training and validation loss curves converge. A representation of the evolution of the loss rate function is presented in Figure 5. The y-axis of the graph encompasses both training and validation losses, while the x-axis signifies the number of iterations. The testing loss is visually represented by an orange line, whereas the training loss is symbolized by a blue line. Comparing the images in the three sets of figures, we find that the CNN-LSTM integrated model performs best. In particular, both the training loss function and the test loss function in the loss function decrease and eventually converge as the data training process proceeds. Next, we tracked the predicted values on the training and test sets and compared them with the true values (Figures 6, 7, and 8). We found that the loss function of the CNN-LSTM model showed rapid decrease and convergence on both the training and test sets. Its predicted values on the training set match very well with the true values, and its predicted values on the test set match very well with the true values. Thus, the overall short-term prediction performance of the model is very good.
2. Model Assessment
As evaluation metrics, we utilize the mean squared error (MSE) and the coefficient of determination (R²). The following are the mathematical expressions that represent these metrics:
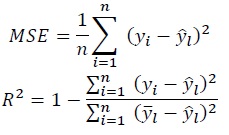
Notes:  is the predicted value;
  is the average value.
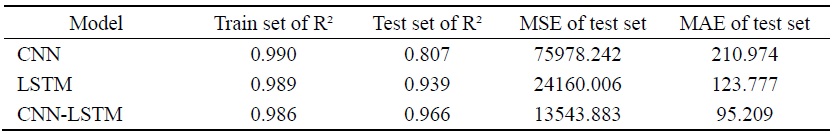
After 100 simulation iterations were completed, the mean R² scores for the three models across the training and test datasets were computed. The comparative analysis presented in Table 4 illustrates that the CNN-LSTM integrated model exhibits superior performance, as supported by its R² value of 96.6%.
In addition, we compare the efficacy of CNN-LSTM deep learning models with some traditional models. The results show that the CNN-LSTM model performs better (Table 5). Thus, the utilization of the CNN-LSTM model for predicting the SCFI yields the most promising outcome in this study.
V. Discussion and Conclusions
The SCFI stands as a pivotal indicator for the shipping industry, international trade, and the broader global economy. Crafting a precise forecasting model for the SCFI is of paramount importance, serving as an indispensable tool for shipping management, investment decisions, and production planning across various sectors (Han et al., 2020). This research endeavors to enhance the accuracy of SCFI forecasts through the development of an innovative forecasting model.
The findings of this research are multifaceted: we have devised a method that integrates deep learning techniques to effectively capture the unique characteristics of the SCFI. By combining the CNN and LSTM architectures into a cohesive deep learning framework, we have augmented the precision of SCFI predictions. Utilizing a comprehensive dataset of 29,308 observations, spanning from March 24, 2017, to May 27, 2022, the proposed model’s predictive performance was meticulously evaluated. The outcomes indicate that the integrated, target-optimized CNN-LSTM model exhibits notable superiority. Firstly, the model’s structure is objectively determined through a data-driven approach, based on the validation set’s performance. This enables the model to capture the hidden nonlinear features inherent in SCFI predictions. Furthermore, the model judiciously considers various candidate hyperparameters, memory lengths, input variables, and training set sizes, rendering it adept at accommodating random sample selection, data frequency variations, and structural breaks within the sample data. Notably, the CNN-LSTM model surpasses the conventional ARIMA-SVR model, as well as the individual CNN and LSTM models, by achieving an impressive R² value of 96.6%.
1. Theoretical Contributions
The contributions of this paper are significant and diverse. Firstly, it expands the application of machine learning in the domains of shipping and finance. The integration of CNN-LSTM models not only enhances the accuracy of shipping market forecasts but also provides an analytical framework to examine the interactions between the shipping and financial sectors. Despite the scholarly focus on SCFI forecasting (Lin et al., 2019; Zhang et al., 2019), there is a void in the literature that bridges SCFI with China’s commodity futures market. Given China’s substantial demand and increasing influence on commodities, the Chinese futures market’s impact on shipping-related indices, such as the SCFI, has grown significantly. This necessitates an urgent exploration of the role and significance of the Chinese futures market in SCFI forecasting.
In the context of economic globalization, this study particularly focuses on the performance of China’s commodity futures market in the context of shipping market forecasting. For financial investors, a deeper understanding and ability to forecast SCFI trends can lead to more accurate investment opportunities and more effective decision-making. For participants in the maritime transportation market, such as shipping companies and shipowners, insight into the potential influence of the financial market on their operations can enhance risk management and capital allocation strategies. Our research further validates Nielsen et al.’s (2014) hypothesis that the SCFI is closely linked to the Chinese commodity market, thus extending the research on cross-fertilization between financial markets and maritime business markets. This not only offers new insights into the complex dynamics of the global shipping market but also provides deep insights into the interactions between financial markets and the real economy.
Secondly, we have developed a deep learning integration model that combines CNN and LSTM. The results indicate that the combined CNN-LSTM model exhibits higher predictive ability than a single machine learning model. The CNN component effectively captures and extracts local features in serial data, while the LSTM component captures long-term dependencies. The integration of the self-attention mechanism allows the model to focus on more important features, thereby improving the processing and analysis of multi-feature time-series data. This is crucial for the prediction of complex time-series data such as SCFI, which is influenced by multiple factors. This extends the study of Munim and Schramm (2017) by incorporating the Chinese commodity futures financial market into SCFI predictions. Finally, this study enhances the prediction accuracy and robustness of SCFI and provides new perspectives for understanding the relationship between SCFI and multiple complex futures prices.
2. Management Contribution
First, for logistics companies, accurate shipping price information is crucial for cost budgeting and transportation planning. By analyzing SCFI data, logistics companies are able to predict shipping price trends, optimize transportation routes and cargo loading strategies, effectively reduce costs and improve service quality. At the same time, these companies can use SCFI insights to avoid transportation cost risks and reduce potential losses by locking in costs through financial instruments such as futures contracts. Second, the shipping market is known for its volatility and unpredictability of market risks. This study provides shipping companies and investors with tools to effectively identify and manage these risks. Shipping companies can utilize SCFI forecasts to strategically plan container leasing, maintenance, and management to mitigate the effects of market volatility. Investors, on the other hand, can monitor SCFI trends to adjust their portfolios for risk diversification and timely adjustment.
For government agencies, this study provides key insights into the financial health of the shipping market. By monitoring SCFI forecasts, governments are able to assess market economic trends in a timely manner, explore strategic pricing methods for containerized cargo, and formulate policies that promote strong growth in the shipping industry. In addition, the research can help enhance the industry’s competitive advantage, promote the integration of the shipping and financial markets, and support the stable and sustainable development of both industries. Finally, incorporating the predictive capabilities of CNN-LSTM models into the regulatory framework provides a strategic recommendation for policymakers. It enables them to proactively predict market volatility and implement measures to safeguard market stability. Regulators should utilize the model’s predictive analytics capabilities to identify and correct potential supply chain bottlenecks and ensure that infrastructure investments are aligned with future demand trends. This approach will not only improve operational efficiency, but also enhance the economic resilience and stability of the shipping market.
VI. Limitations and Future Research
Our investigation is subject to certain constraints. First, we train our integrated CNN-LSTM model using a specific dataset and parameters, potentially restricting its predictive efficacy to situations that align with the dataset’s representativeness. Second, the inherent non-interpretability of machine learning models poses the risk of overfitting and data-specific bias. Therefore, it is particularly crucial to automatically optimize hyperparameters based on performance metrics, which will be a core direction for future research improvements. Furthermore, although we have integrated multiple machine learning models, we may not have fully explored the potential additional benefits of introducing more models. In light of this, we suggest that future studies should consider a more comprehensive set of market influencing factors and conduct a more in-depth review of limitations and potential biases in data selection and model assumptions in order to enhance the accuracy and reliability of the findings.
Tables & Figures
Table 1.
Variables for the Research
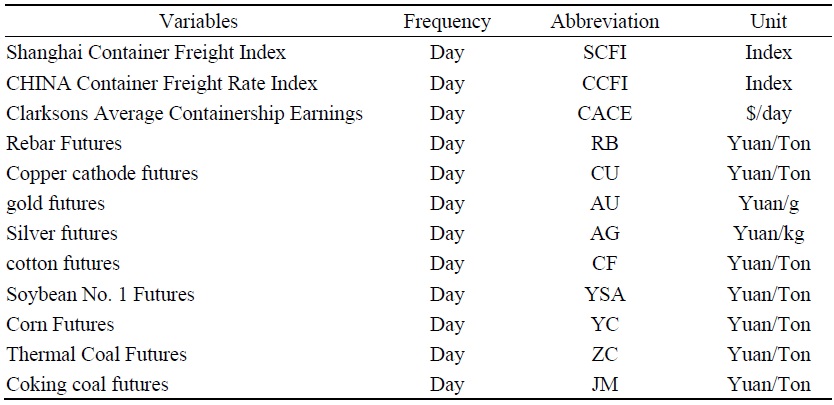
Table 2.
Descriptive Statistics for SCFI Forecast Data
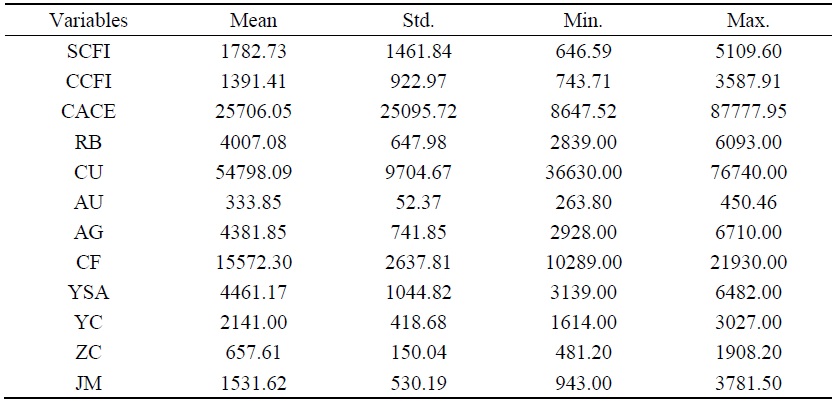
Figure 1.
Correlation Analysis Diagram
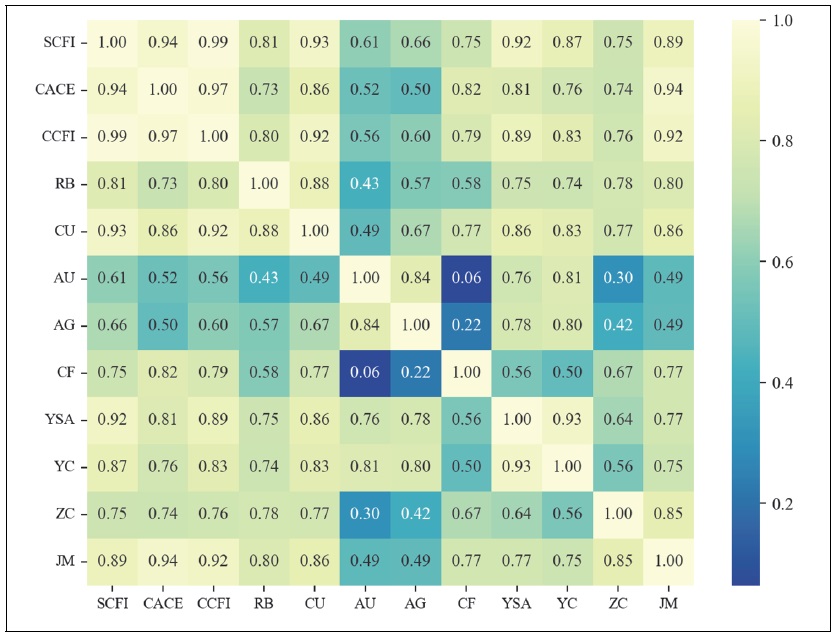
Figure 2.
LSTM Network Structure Diagram
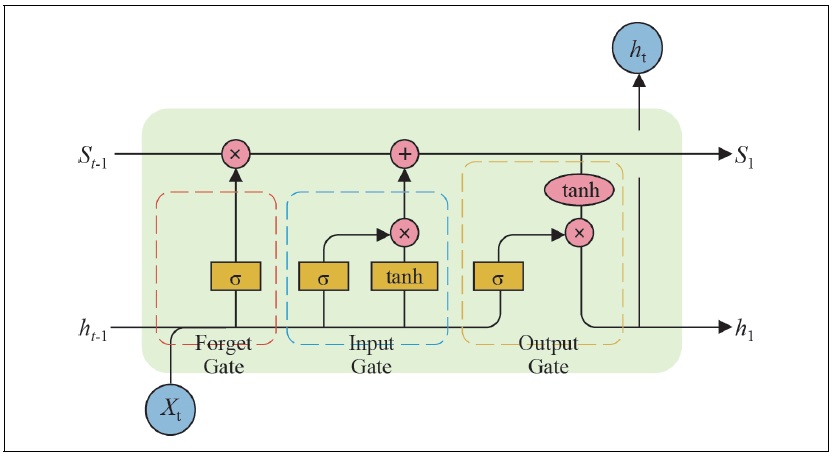
Figure 3.
Convolutional Neural Network Structure Diagram
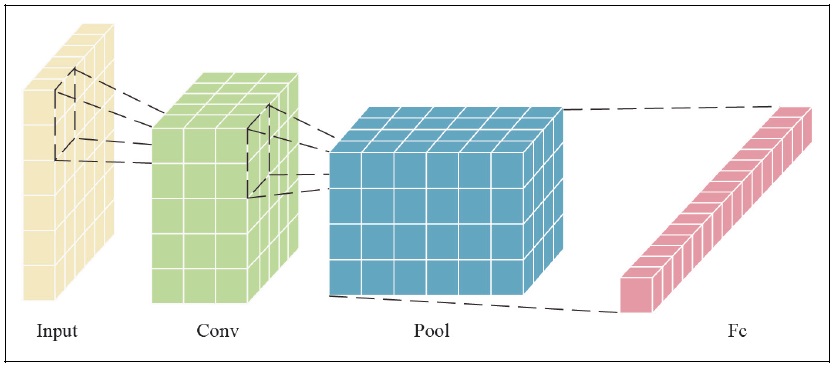
Figure 4.
CNN-LSTM model
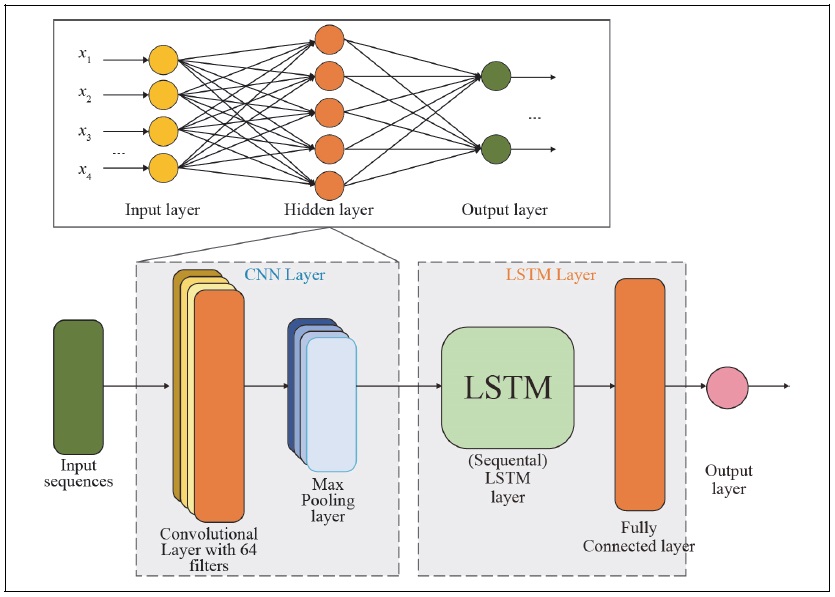
Table 3.
Final Model Parameters
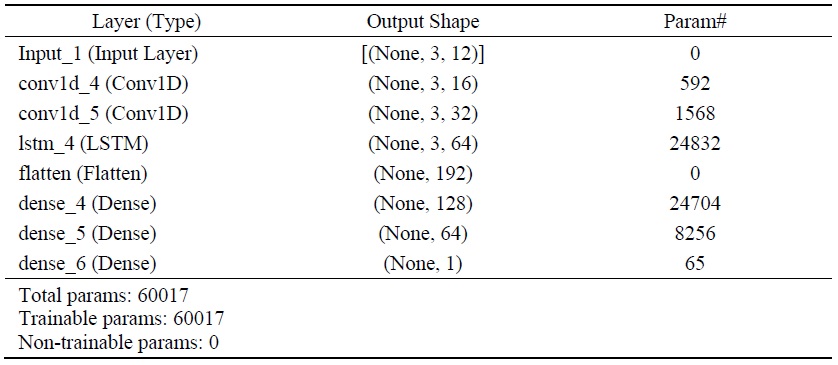
Figure 5.
Loss Curves
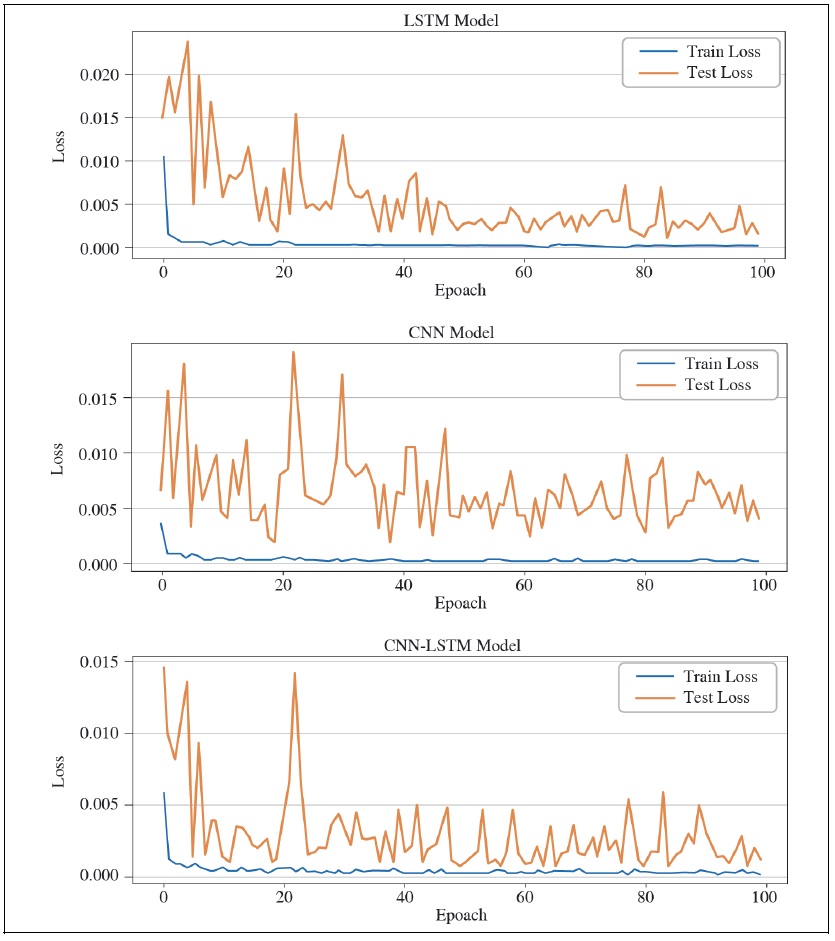
Figure 6.
LSTM Comparison of raw data, training process and testing process
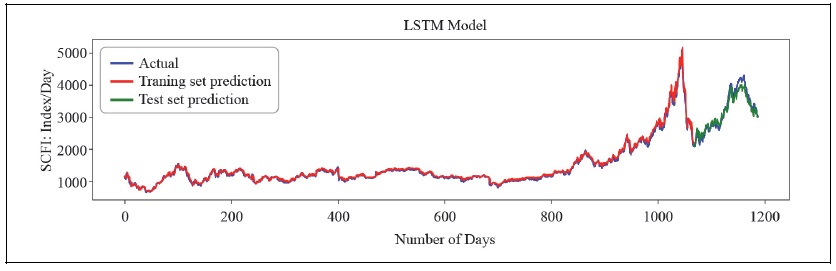
Figure 7.
CNN Comparison of raw data, training process and testing process
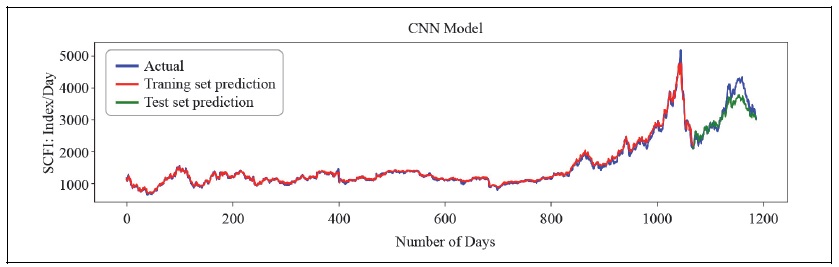
Figure 8.
CNN-LSTM Comparison of raw data, training process and testing process
Tables 4.
Model Performance Comparison
Tables 5.
Comparison with Some Conventional Models
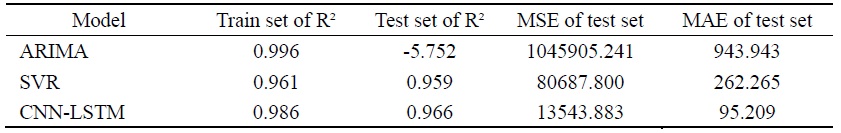
Figure A.
SCFI Raw Data Line Graphs
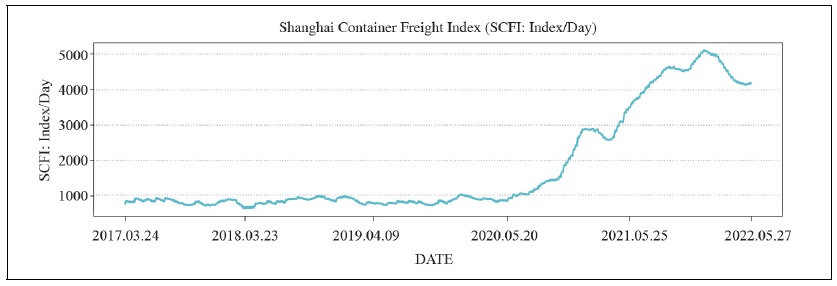
Figure B.
CACE Raw Data Line Graphs
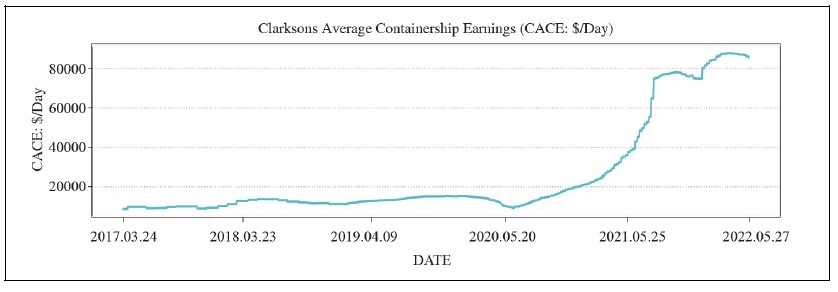
Figure C.
CCFI Raw Data Line Graphs
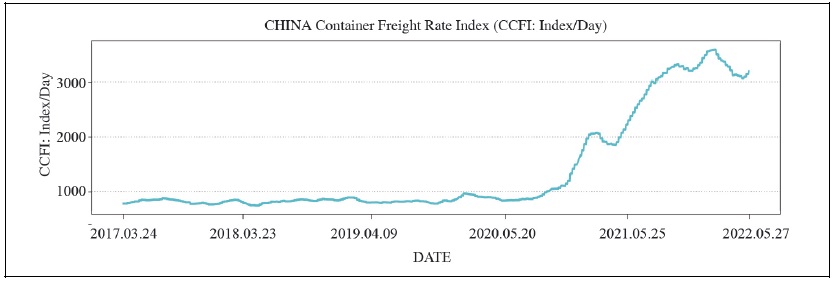
Figure D.
RB Raw Data Line Graphs
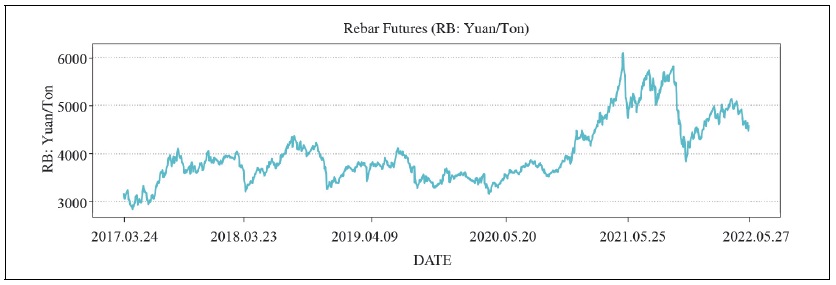
Figure E.
CU Raw Data Line Graphs
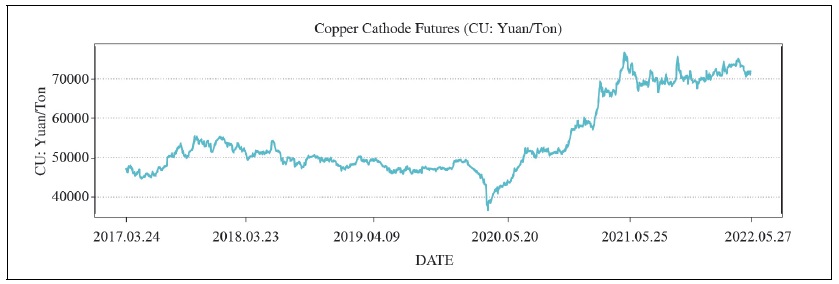
Figure F.
AU Raw Data Line Graphs
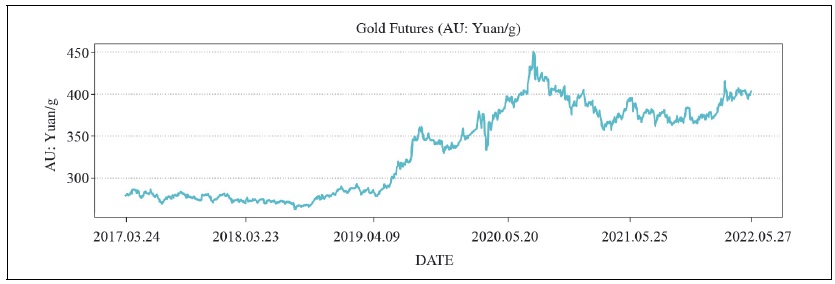
Figure G.
AG Raw Data Line Graphs
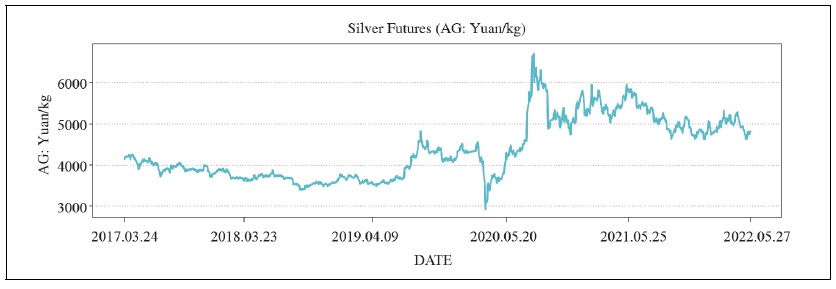
Figure H.
CF Raw Data Line Graphs
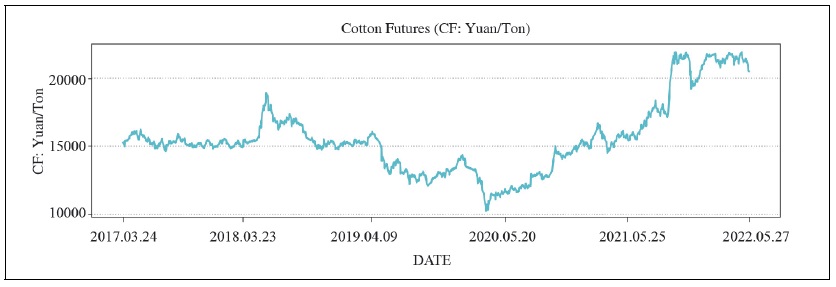
Figure I.
YSA Raw Data Line Graphs
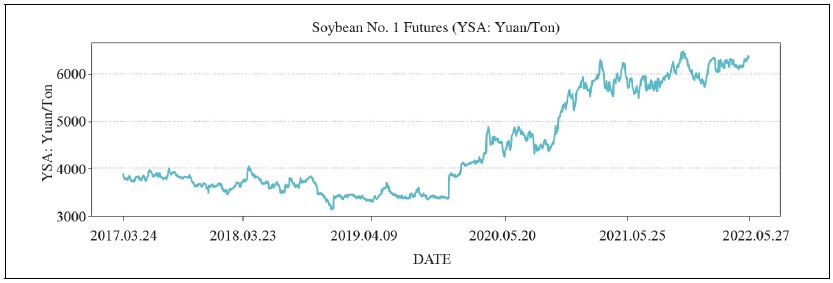
Figure J.
YC Raw Data Line Graphs
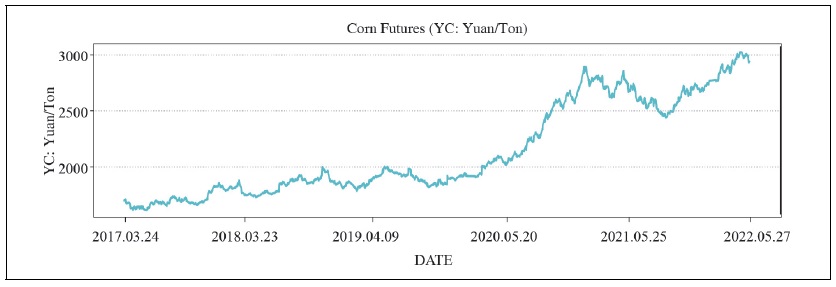
Figure K.
ZC Raw Data Line Graphs
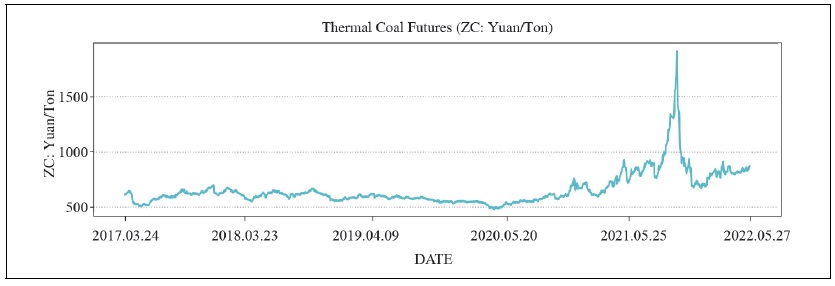
Figure L.
JM Raw Data Line Graphs
References
-
Angelopoulos, J. 2017. “Time–frequency analysis of the Baltic Dry Index.”
Maritime Economics & Logistics , vol. 19, no. 2, pp. 211-233.
-
Azab, A. and H. Morita. 2022. “Coordinating truck appointments with container relocations and retrievals in container terminals under partial appointments information.”
Transportation Research Part E: Logistics and Transportation Review , vol. 160, no. 102673. -
Bandyopadhyay, A. and P. Rajib. 2023. “The asymmetric relationship between Baltic Dry Index and commodity spot prices: evidence from nonparametric causality-in-quantiles test.”
Mineral Economics , vol. 36, no. 2, pp. 217-237.
-
Bildirici, M. E., Kayıkçı, F., and I. Ş. Onat. 2015. “Baltic Dry Index as a major economic policy indicator: the relationship with economic growth.”
Procedia-Social and Behavioral Sciences , vol. 210, pp. 416-424.
-
Bohl, M. T., Pütz, A., and C. Sulewski. 2021. “Speculation and the informational efficiency of commodity futures markets.”
Journal of Commodity Markets , vol. 23, no. 100159. -
Bosch, D. and E. Pradkhan. 2015. “The impact of speculation on precious metals futures markets.”
Resources Policy , vol. 44, pp. 118-134.
-
Cartwright, P. A. and N. Riabko. 2015. “Measuring the effect of oil prices on wheat futures prices.”
Research in International Business and Finance , vol. 33, pp. 355-369.
-
Charfeddine, L., Khediri, K. B., and Z. Mrabet. 2019. “The forward premium anomaly in the energy futures markets: a time-varying approach.”
Research in International Business and Finance , vol. 47, pp. 600-615.
-
Chen, J., Zhang, Y., Wu, J., Cheng, W., and Q. Zhu. 2023. “SOC estimation for lithium-ion battery using the LSTM-RNN with extended input and constrained output.”
Energy , vol. 262, no. 125375. -
Chen, K. and J. Kim. 2024. “Two-Sided Mirror: An Analysis of Inflation’s Dual Impact on China’s Economic Growth.”
East Asian Economic Review , vol. 28, no. 2, pp. 175-219.
-
Cox, J. C., Ingersoll Jr, J. E., and S. A. Ross. 1981. “The relation between forward prices and futures prices.”
Journal of Financial Economics , vol. 9, no. 4, pp. 321-346.
-
De Roon, F. A., Nijman, T. E., and C. Veld. 2000. “Hedging pressure effects in futures markets.”
The Journal of Finance , vol. 55, no. 3, pp. 1437-1456.
-
Duru, O., Bulut, E., and S. Yoshida. 2012. “A fuzzy extended DELPHI method for adjustment of statistical time series prediction: An empirical study on dry bulk freight market case.”
Expert Systems with Applications , vol. 39, no.1, pp. 840-848.
-
Gong, Y., Li, K. X., Chen, S. L., and W. Shi. 2020. “Contagion risk between the shipping freight and stock markets: Evidence from the recent US-China trade war.”
Transportation Research Part E: Logistics and Transportation Review , vol. 136, no. 101900. -
Gu, J., Wang, Z., Kuen, J., Ma, L., Shahroudy, A., Shuai, B., Liu, T., Wang, X., Wang, G., Cai, J., and T. Chen. 2018. “Recent advances in convolutional neural networks.”
Pattern recognition , vol. 77, pp. 354-377.
-
Guo, Z., Yang, C., Wang, D., and H. Liu. 2023. “A novel deep learning model integrating CNN and GRU to predict particulate matter concentrations.”
Process Safety and Environmental Protection , vol. 173, pp. 604-613.
-
Han, L., Wan, L., and Y. Xu. 2020. “Can the Baltic Dry Index predict foreign exchange rates?”
Finance Research Letters , vol. 32, no. 101157. -
Han, Q., Yan, B., Ning, G., and B. Yu. 2014. “Forecasting dry bulk freight index with improved SVM.”
Mathematical Problems in Engineering, 2014 .https://doi.org/10.1155/2014/460684 -
Hirata, E. and T. Matsuda. 2022. “Forecasting Shanghai Container Freight Index: A Deep-Learning-Based Model Experiment.”
Journal of Marine Science and Engineering , vol. 10, no. 5, 593.
-
Huo, R. and A. D. Ahmed. 2018. “Relationships between Chinese stock market and its index futures market: Evaluating the impact of QFII scheme.”
Research in International Business and Finance , vol. 44, pp. 135-152.
-
Jiang, B., Li, J., and C. Gong. 2018. “Maritime shipping and export trade on ‘Maritime Silk Road’.”
The Asian Journal of Shipping and Logistics , vol. 34, no. 2, pp. 83-90.
-
Jung, Y. and J. Hur. 2024. “Investing Abroad, Transforming at Home: An Empirical Study of Outward Foreign Direct Investment and Korean Manufacturing’s Servicification.”
East Asian Economic Review , vol. 28, no. 2, pp. 143-174.
-
Kang, S. H. and S. M. Yoon. 2019. “Financial crises and dynamic spillovers among Chinese stock and commodity futures markets.”
Physica A: Statistical Mechanics and its Applications , vol. 531, no. 121776. -
Kim, T. J. and N. Tromp. 2024. “The Environmental and Economic Impact of Trade between South Korea and the United States.”
East Asian Economic Review , vol. 28, no. 1, pp. 37-67.
-
Kim, W. 2024. “International Transmission of Macroeconomic Uncertainty in China: A Timevarying Bayesian Global SVAR Approach.”
East Asian Economic Review , vol. 28, no. 1, pp. 95-140.
-
Koyuncu, K. and L. Tavacıoğlu. 2021. “Forecasting Shanghai containerized freight index by using time series models.”
Marine Science and Technology Bulletin , vol. 10, no. 4, pp. 426-434.
-
Lin, A. J., Chang, H. Y., and J. L. Hsiao. 2019. “Does the Baltic Dry Index drive volatility spillovers in the commodities, currency, or stock markets?”
Transportation Research Part E: Logistics and Transportation Review , vol. 127, pp. 265-283.
-
Lin, Y., Chen, K., Zhang, X., Tan, B., and Q. Lu. 2022. “Forecasting crude oil futures prices using BiLSTM-Attention-CNN model with Wavelet transform.”
Applied Soft Computing , vol. 130, no. 109723. -
Mo, D., Gupta, R., Li, B., and T. Singh. 2018. “The macroeconomic determinants of commodity futures volatility: Evidence from Chinese and Indian markets.”
Economic Modelling , vol. 70, pp. 543-560.
-
Mohanty, S. K. and S. Mishra. 2020. “Regulatory reform and market efficiency: The case of Indian agricultural commodity futures markets.”
Research in International Business and Finance , vol. 52, no. 101145. -
Munim, Z. H. and H. J. Schramm. 2017. “Forecasting container shipping freight rates for the Far East–Northern Europe trade lane.”
Maritime Economics & Logistics , vol. 19, pp. 106-125.
-
Munim, Z. H. and H. J. Schramm. 2021. “Forecasting container freight rates for major trade routes: a comparison of artificial neural networks and conventional models.”
Maritime Economics & Logistics , vol. 23, pp. 310-327.
-
Nielsen, P., Jiang, L., Rytter, N. G. M., and G. Chen. 2014. “An investigation of forecast horizon and observation fit’s influence on an econometric rate forecast model in the liner shipping industry.”
Maritime Policy & Management , vol. 41, no. 7, pp. 667-682.
-
Papailias, F., Thomakos, D. D., and J. Liu. 2017. “The Baltic Dry Index: cyclicalities, forecasting and hedging strategies.”
Empirical Economics , vol. 52, pp. 255-282.
-
Park, S., Kim, H., and J. Kwon. 2023. “The impacts of demand and supply shocks in the dry bulk shipping market.”
The Asian Journal of shipping and logistics , vol. 39, no. 1, pp. 13-22.
-
Prokopczuk, M. 2011. “Pricing and hedging in the freight futures market.”
Journal of Futures Markets , vol. 31, no. 5, pp. 440-464.
-
Saeed, W. and C. Omlin. 2023. “Explainable AI (XAI): A systematic meta-survey of current challenges and future opportunities.”
Knowledge-Based Systems , vol. 263, no. 110273. -
Schramm, H. J. and Z. H. Munim. 2021. “Container freight rate forecasting with improved accuracy by integrating soft facts from practitioners.”
Research in Transportation Business & Management , vol. 41, no. 100662. -
Sherstinsky, A. 2020. “Fundamentals of recurrent neural network (RNN) and long short-term memory (LSTM) network.”
Physica D: Nonlinear Phenomena , vol. 404, no. 132306. - Siami-Namini, S., Tavakoli, N., and A. S. Namin. 2019. “The performance of LSTM and BiLSTM in forecasting time series.” Paper presented in 2019 IEEE International conference on big data (Big Data). pp. 3285-3292. December 2019. IEEE.
-
Tian, J., Wu, Q., Sun, C., and Z. Liu. 2024. “The Structure and Evolution of Renewable Energy Trade Networks in the RCEP Region: Application of SNA Method.”
East Asian Economic Review , vol. 28, no. 1, pp. 3-35.
-
Yang, J., Li, Z., and T. Wang. 2021. “Price discovery in Chinese agricultural futures markets: A comprehensive look.”
Journal of Futures Markets , vol. 41, no. 4, pp. 536-555.
-
Zhang, X., Chen, M. Y., Wang, M. G., Ge, Y. E., and H. E. Stanley. 2019. “A novel hybrid approach to Baltic Dry Index forecasting based on a combined dynamic fluctuation network and artificial intelligence method.”
Applied Mathematics and Computation , vol. 361, pp. 499-516.