

- EAER>
- Journal Archive>
- Contents>
- articleView
Contents
Citation
| No | Title |
|---|
Article View
East Asian Economic Review Vol. 28, No. 4, 2024. pp. 459-489.
DOI https://dx.doi.org/10.11644/KIEP.EAER.2024.28.4.442
Number of citation : 0View
41
Download
26
A Study on the Role of Economic and Institutional Environment on the Corporate Responsibility Performance and its Synchronization
|
|
Jeonbuk National University |
|---|

Abstract
This paper analyzed how the country’s institutional and political environment affect ESG performance of the companies in the country. An empirical analysis of this study results are as follows. First, the clear difference in financial variables such as the growth rate of foreign direct investment, pension fund assets to GDP ratio, and stock market return rate was found to the significance between advanced economies and emerging markets. Second, in two groups, the institutional indexes, which refer to government policy and the country’s institutional environment such as the rule of law, the government effectiveness, corruption control, and citizens’ voice and accountability showed a positive relationship with ESG performance of the companies. They had a particularly large positive effect on the companies in emerging markets. And third, companies’ synchronization with other companies’ high ESG performance had a positive effect on their ESG performance, and such a tendency was much stronger in the companies of emerging markets. Additionally, institutional dimension had a positive effect on the companies’ synchronization, and such a tendency was much stronger in emerging markets.
JEL Classification: G30, G38, O10
Keywords
Corporate Social Responsibility, ESG Performance, Institutional Environment, ESG Synchronization
I. Background
Since the mid-to late 2000, among developed countries’ financial and stock markets, Corporate Social Responsibility (CSR) is the term that is being brought up more frequently. In the past, the financial success of a corporation was regarded as an important aspect when considering whether to invest in a company. However, in the present-day, non-financial success is also becoming an important element to consider when choosing a company in which to invest.
CSR takes into account a company’s management activities, and considers not only its economic growth, but also how it must balance its economic growth with social and environmental responsibility. It stipulates that a company must act responsibly regarding its employees and customers, and that the stockholder is held responsible to all parties involved, such as cooperative and competitive companies, as well as the larger community. In the case that an issue is not handled responsibly by the company, its competitiveness and possibility for growth weakens. According to CSR, corporate sustainability management is positioned as a necessary goal for the company’s management. Also, the investor’s continued interest in the company is influenced by the success of its corporate sustainability management.
As an alternative way to measure CSR, ESG has recently sparked worldwide. ESG signifies environmental responsibility, social responsibility, and governance, and has come to be an investment guide as it signals a new paradigm for business management strategy. Essentially, ESG can be interpreted as a value system that attempts to realize continued prosperity for humankind.
The scale of investing in companies based on their ESG has been consistently increasing. In 2020, the global scale of investment in ESG was 35.0 trillion dollars. This has increased 15% from 30 trillion 700 billion dollars in 2018. In 2022, the scale was 30.3 trillion dollars,1 but it was due to the strengthened standard to prevent the green washing2 from sustainable investment. Additionally, 35.9% of the investment scale is made up of investments from the U.S., Europe, Australia, Japan, Canada, etc. The importance of ESG has grown in emerging markets, but awareness of the scale of investment is weak compared to other highly developed nations.
In comparison to the case of advanced economies, the countries in emerging markets have shown insufficient awareness and success in their companies’ ESG. In advanced economies, companies are highly involved in activities relating to non-financial success, such as corporate social responsibility activities and responsible investing. In comparison, the companies in emerging markets are just recently beginning to show an interest in ESG. While emerging markets countries’ economy and technological development have met that of highly developed countries, it has not yet achieved the same standard in areas related to the environment or energy usage. As such, it is necessary for the countries to find ways to cope with the rapid institutional changes related to ESG.
Although there is existing study regarding different companies’ success in ESG based on companies’ financial success and value, there is only limited study on how this relates to the countries the companies belong to, and how their economic, political and institutional qualities affect the success of ESG. In other words, there is insufficient research on how exogenous variables affects companies’ ESG. There are many factors that affect a company’s ESG, but above all else, it is difficult to organize panel data based on the ESG performance of companies in multiple countries. In other words, it is difficult to compose source material that commonly contains a country’s individual companies’ ESG data.
Taking this difficulty into account, this study uses data from 16 countries that contains information regarding each country’s companies’ ESG. And it also attempts to examine how each country’s respective economic, political, and institutional differences influence the success of the companies’ ESG. Specifically it investigates the clear difference of the relationship between ESG performance and country’s exogenous aspects by classifying 16 countries into 8 advanced economies (Australia, France, Germany, Japan, Sweden, Switzerland, United Kingdom, United States) and 8 emerging markets (China, Hong Kong, India, Indonesia, Malaysia, Singapore, South Korea, Thailand).
While ESG, GDP, and GNI already separate highly developed countries from other countries, the normalization and institutionalization of ESG as it establishes itself in the global economy has the possibility to harm companies in emerging markets. This is because ESG has become a standard for comparison for companies when they are evaluated as possible investment opportunities by global funds, as companies can be excluded as candidates if they do not meet the standard. As a result, analyzing how the exogenous aspects in various countries affect companies’ ESG’s performance, such as the country’s policies, economy, and institutional differences, can be a good guideline for how firms can improve their ESG performance. Shedding light on this guideline is the objective of this study.
1)‘Global Sustainable Investment Review’, 2023.
2)It is the act of making false or misleading statements about the environmental benefits of a product or practice.
II. Literature Review
Firstly, in the topic of the companies’ social responsibility proxy as a variable affecting ESG, diverse study was completed. Gjølberg (2009) and Skouloudis (2014) used well-regarded indexes from reputable institutions, like the Dow Jones Sustainability Index (DJSI), Global 100, and the UN Global Compact. These indexes focus on corporate social responsibility and sustainability and publish ranked reports of applicable companies each year.
In comparison, Balatbat (2012), Lin et al. (2017) used grades given for ESG, but in the specific categories evaluated there were differences between countries. As a result, there was difficulty in comparing the success between the companies evaluated. According to Yamaguchi (2008) and Nelling and Webb (2009), it is difficult to prove a relationship of direct causation between two variables because of the untrustworthy numeral rating scale measuring the corporate social responsibility when using companies as the unit of measure.
Secondly, in the case of the relationship between ESG and companies’ value, the contradictory study results are mixed up. According to Lin et al (2009), and Hatch and Mirvis (2010), there is a significant, positive relationship between the success of a company’s corporate social responsibility and financial success. This is because they found that, in the long term, a given company’s social responsibility increases its production and effective management and decreases its expenses.
This also connects financial success with the stockholders’ value which, as a result, allows the company to acquire more trustworthy stockholders. According to Gregory et al. (2016) strengthening a company’s CSR improves the relationship between stockholders, NGOs, and consumers. As a result of this, brand equity also saw an increase. Godfrey, Merrill, and Hansen (2009), Edams (2011), and Gregory et al. (2016) found that, from a long-term perspective, actively participating in corporate social responsibility activities gave a competitive advantage when making investment decisions.
On the other hand, researchers such as Palmer, Oates and Portey (1995), and Barnea and Rubin (2005) regard CSR as an unnecessary expense that can negatively influence the value of corporations. They also assert that CSR can create other problems related to the capital structure and ownership of the company, which has the possibility to devalue the company.
And third, in the attempt to ascertain if there is any meaningful impact by countries’ economy and political policies on ESG, there is relatively limited research covering how a country’s economic state, institutions, and policies affect companies’ ESG performance. Campbell (2007) shows, from an institutional perspective, that the primary variables affecting different countries’ companies’ social responsibility are the various economic environments and institutions existing within that country. Chih et al. (2010) shows that as the concentration of market competitiveness increases the two variables establish a positive correlation. Orlitzky et al. (2003), and Beurden and Gossling (2008) shows that in countries with stricter laws and restrictions, companies tend to be more active in CSR.
The research also shows that each country’s economic situation and political policies affects its CSR, and that each company’s ESG performance depends on which industry the company belongs to. Balatbat (2012) shows that while the relationship between the two variables depends on the industry, the industries with the most positive correlation are the construction industry, the electric and gas industry, and the energy field.
Finally, the main variables of this paper are closely related to the ESG performance.
The institutional investors can play an important role of in the social responsibility investment. Hence, there is positive relationship between pension fund assets and ESG performance. Chung et al. (2002) and Gugler et al. (2008) found that the higher share ratio of institutional investors can be led to the higher performance of social responsibility of the firm from the better market monitoring function.
And in the case of result of relationship between ESG performance and stock market return rate, when considering a company’s growth stage, no significance was found between ESG performance and corporate values. However, as the company grew and reached a stable state, the two variables developed a positive relationship. Similar results can be seen in studies such as Borgers et al. (2013) and Nollet et al. (2016).
Additionally, ESG performance can be improved depending on the state of the institutional and political environment of the country. Campbell (2007) revealed that the economic institutional environment of each country are major variables as factors affecting the social responsibility of individual companies from an institutional point of view.
In relation to this, the majority of the existing research on ESG is focused on companies’ financial structure, how the success of ESG can improve the company’s financial structure and, ultimately, increase the company’s overall value. There is relatively less research about how countries’ institutions and policies can effect a certain company’s ESG. However, depending on what country the company belongs to, that country’s economic, institutional, and political situation can influence the relationship between the company’s CSR and financial performance. As such, there is a need for research that compares each country’s common ESG performance with its CSR performance, which in turn can reflect how companies’ ESG performance is affected by that country’s unique traits.
III. Model and Data
The general classification for the Environment (E), Social (S) and Governance (G) pillars are the same for each country, but specific criteria between countries differ. And to compare the ESG performance across multiple countries, common criteria are required. There are specific criteria within the ESG pillars that differ between countries, there are also fields that the countries have in common. In the case of the Environment (E) pillar, the common criteria are resource use, emissions, and environmental innovation. The common fields in the Social (S) pillar are workforce, human rights, community, and product responsibility. As for the Corporate Governance (G) pillar, there is management, shareholders, and CSR strategy. Each category was given a raw score out of 100 points.
To normalize each companies’ raw ESG score, one can consider a weighted average from a simple weighted value method. However, this way can be aroused some biases such as the concentration of large firms, regional variation, and exclusion of specific industry. A large firm eases to take high score of ESG performance using the high level of capital and human source. And regional variation can be existed from data disclosure. More specifically, a specific industry, which is in the relative risk field can be excluded.
To solve this problem, this study use PCA (Principal Component Analysis) method. PCA method is a dimensionality reduction method that is often used to reduce the dimensionality large data sets, by transforming a large set of variables into a smaller one that still contains most of the information in the large set. The formula for PCA of this study is as follows.


Here,
The dimensions (
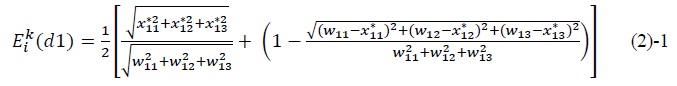
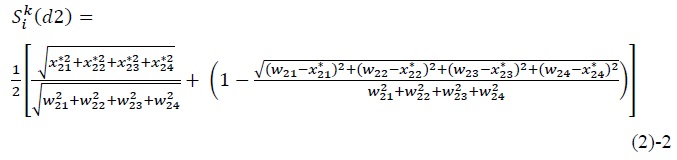
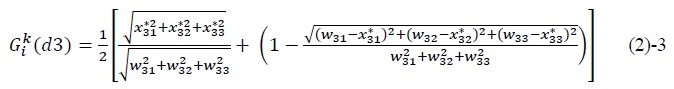
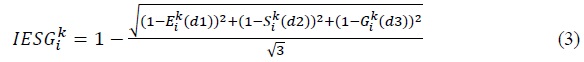
Using the above formula, it is possible to calculate IESG for companies in each country, with values ranging from 0 to 1. It implies that as the company’s ESG performance increases, the values become closer to 1. This index format is suitable to this research because it reflects the weight of the specific factors that comprise ESG, and also allows for easy comparison of ESG performance between countries.
Now that the companies’ ESG performance has been calculated, the factors that affect ESG performance are able to be investigated from the next formula.
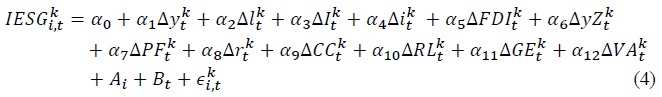
The variables that are considered are the country’s economy and policies. In this formula,
The first four variables are considered economic situation of the country, Δ
Secondly, in addition to the analysis of the ESG performance of companies according to the individual characteristics of each country, this study applies the following equations to analyze how the countries’ national economy and policies affect the degree of change in the companies’ ESG performance.
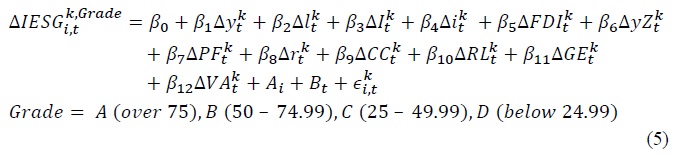
In other words, based on the average level of fluctuations in ESG performance over the 2011 to 2022 period, each company is classified in to four grades from A to D according to the degree of real ESG score, A (over 75 point), B (50 – 74.99 point), C (25 – 49.99), and D (below 24.99) respectively. Using this method, the degree to which ESG performance was affected by exogenous variables is examined between the companies that have shown an above average increase in ESG performance and the companies with a volatile above decrease in ESG .performance.
The final step is for the robustness. Using the above formula, if one can find the significant relationship between company’s ESG performance and its country’s economic and institutional environment, the next step is to investigate to identify the factor of significance between them. There are some factors that affect this significance relationship, but above all this, this paper focuses on the synchronization of the companies. It is called as peer effect, or herd effect that a company’s values is changed by the behavioral pattern from peer group (Banerjee, 1992). Specifically, the companies which have a high social responsibility can have a significant effect on other companies in the country (Benlemlih, 2014).
This paper takes the IESG and calculates them for analysis based on the synchronization index. It is necessary for the equation being used to consider each company’s unique synchronization with other companies in the country. Therefore, this study uses the way of contagion effect proposed by Adrian and Brunnermeier (2009) and Chan and Lau (2010).

Here,  stands for the synchronization index of company
Now that the companies’ level of synchronization with other companies’ high ESG performance has been calculated, the impact of the synchronization on the relationship between company’s ESG performance and its country’s economic and institutional environment is able to be investigated.
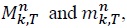
In order to measure this, it is necessary to normalize 12 variables which refer to country’s economic and institutional environment from the next formula.
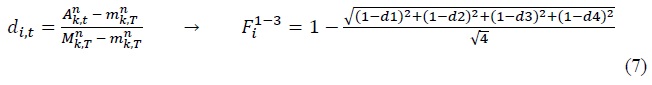
Here, 
 such as F1 (economic), F2 (financial), and F3 (institutional) are able to be comprised.
Using the above formula, it is possible to calculate 3-main Factors companies in each country, with values ranging from 0 to 1. As the company’s economic and institutional performance increases, the values become closer to 1.
Now that the corporations’ ESG performance has been calculated, the next formula will examine the channel that affect the companies’ ESG performance by their countries’ economic and institutional background. That is to say, to what extent the company’s synchronization with other companies’ high ESG performance affected by its country’s economic and institutional background, can be improved the company’s ESG performance? The following three-step test is used to examine which the improvements of ESG performance are possible when the level of synchronization grows


These steps are to examine how the company’s synchronization resulted from strong economic and institutional background of country affect the ESG performance in the company.
The synchronization of this paper implies that a company is easily to be affected by the high ESG performance of other company in the same country. Hence, strong synchronization of social responsibility leads to the high ESG performance of the firm. The Benchmark OLS, equation (8) investigates this relationship. If the company’s synchronization with other companies which have high performance improves the company’s ESG performance,
The improved institutional environments of the country in which the firms are belongs to, it is ease to improve their ESG performance to review and take the feedback from other firms in the same country. In that case, these firms show the high synchronization of social responsibility. In order to examine the impact of country’s economic and institutional background on the synchronization, it estimates the relationship between synchronization index and 3-Factors indexes respectively using the OLS method in equation (9). If the country’s economic and institutional background accelerates the company’s synchronization,
After checking the significancy of this relationship, this paper uses these Factors indexes as instrumental variables by TSLS (Two Stage Least Squares), rather than OLS method, in equation (10) to examine how the company’s synchronization resulted from strong economic and institutional background of country affect the ESG performance in the company. Equation (10) expresses the relationship between the company’s synchronization and ESG performance from equation (8), and the country’s economic and institutional background is added. This TSLS equation is used to estimate the impact of strong economic and institutional background on ESG performance from synchronization.
In this equation, 3-Factors (economic, financial, and institutional) indexes are instrumented variables that estimates the effect of synchronization from strong background has on ESG performance. It estimates the effect of synchronization on the ESG performance when it is affected by economic and institutional background, thus exerting positive influence on ESG performance, so the sign of  will be positive and its significance will be greater as well.
Using the equations above as an analysis model, this paper conducts an empirical analysis on companies in 16 countries from 2011 to 2022. At this time, the actual scores of ESG and its specific fields of information relating to individual firms in each country are from the Refinitiv Eikon database. It is very easy and useful to compare the performance of ESG between countries using the Refinitive Eikon database, because the detailed items of each pillar, the Environment, Social, and Corporate Governance aspects which constitute ESG, are nearly identical to international standards.
In this paper, ESG performance data from a total of 3,094 companies of 16 countries were extracted from 2011 to 2022. And they are classified into two groups. One thing is 2,566 companies in advanced economies including 280 companies in Australia, 86 companies in France, 85 companies in Germany, 407 companies in Japan, 59 companies in Sweden, 65 companies in Switzerland, 297 companies in United Kingdom, and 1,287 companies in United States, the other thing is 528 companies in emerging markets including 97 companies in China, 58 companies in Hong Kong, 97 companies in India, 38 companies in Indonesia, 51 companies in Malaysia, 37 companies in Singapore, 116 companies in South Korea, and 34 companies in Thailand.
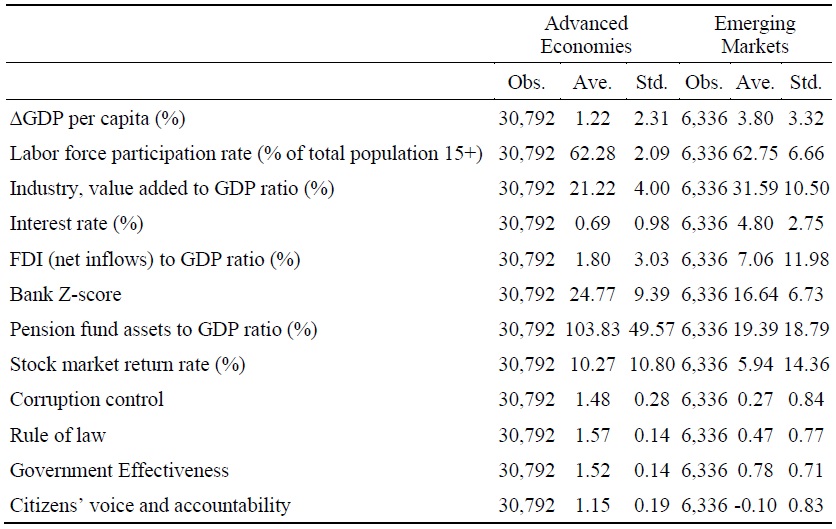
This study referred to the World Bank’s World Development Indicators, Global Financial Development, and Worldwide Governance Indicators in regard to the other economic, financial and institutional variables analyzed for each country. In the case of the variables from the OECD, this paper referred to OECD.Statextracts. The following table describes the basic data of the configured variables.
In the case of economic variables, the average growth rate of GDP per capita in advanced economies is 1.22%, while it is 3.80% in emerging markets. The labor force participation rate is similar in two groups, but industry, value added to GDP ratio and interest rate is higher in emerging markets. In the case of financial variables, all values of them are higher in advanced economies. Specifically, pension fund assets to GDP ratio which is related to the value of social responsibility investment is much higher in advanced economies. In the case of policy and institutional variable, all indexes are higher in advanced economies.
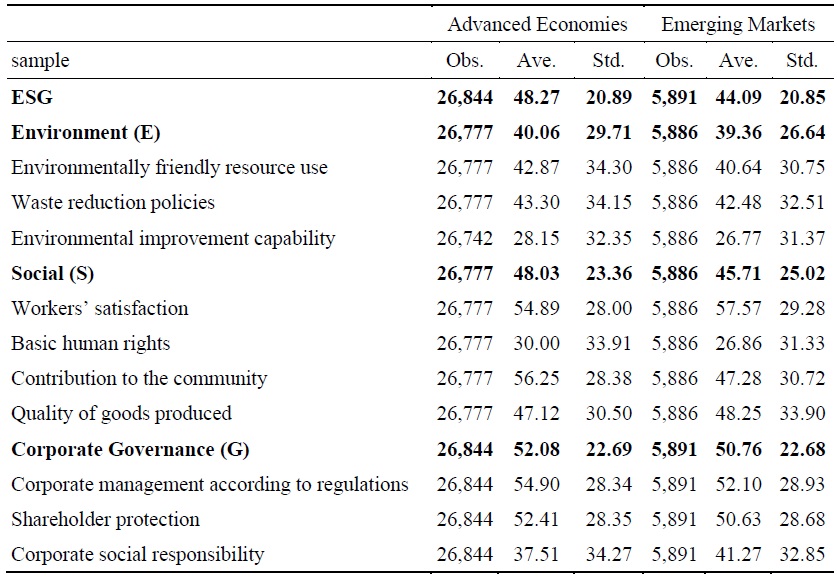
The following table shows the average values for companies’ ESG scores in two groups.
Over the past 12-years, the average ESG performance of the companies in the advanced economies is 48.27 which is close to 50.00, while the average of the companies in emerging markets is 44.09. The ESG performance of the companies in the advanced economies composes by three pillars, 40.06 of the Environment (E) pillar, 48.03 of the Social (S) pillar, and 52.08 of the Corporate Governance (G) pillar. In the case of the companies in emerging markets, it composes by three pillars, 39.36 of the Environment (E) pillar, 45.71 of the Social (S) pillar, and 50.76 of the Corporate Governance (G) pillar.
The values of the items in three pillars shows a similar pattern in both group. Among the items of the Environment (E) pillar, the item of waste reduction policies is the highest, while the item of workers’ satisfaction is the highest in case of the Social (S) pillar. And in the case of Corporate Governance (G) pillar, corporate management according to regulations shows the highest value. The lowest items in each three pillars are environmental improvement capability of the Environment (E) pillar, basic human rights of the Social (S) pillar, and corporate social responsibility of the Corporate Governance (G) pillar respectively.
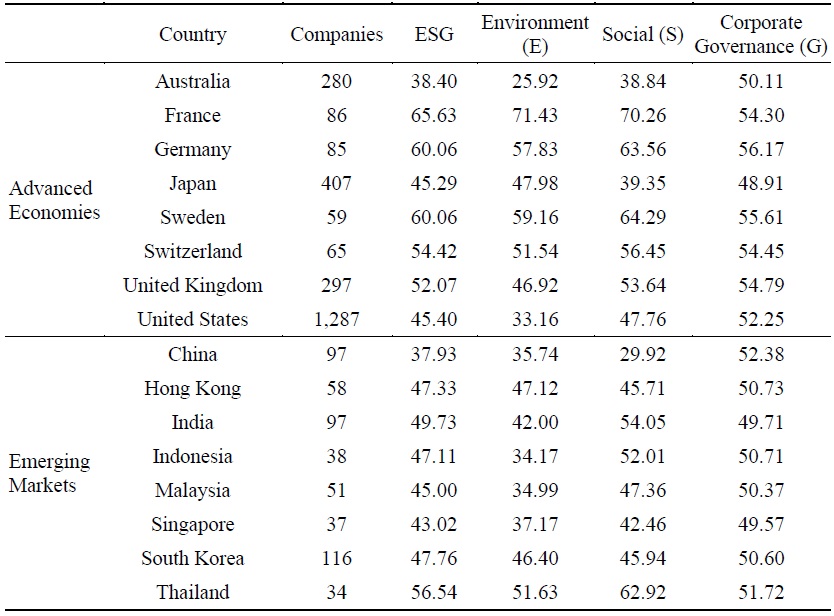
The following table shows the average values for companies’ ESG scores in individual countries.
Among the countries in advanced economies, the average ESG performance of 86 companies in France is 65.63 which is the highest value, while 38.40 point of 280 companies in Australia is the lowest. The average ESG performance of 86 companies in France shows the highest value in the items of the Environment (E) pillar and Social (S) pillar, while Australia’s 280 companies shows the lowest. However, the items of Corporate Governance (G) pillar shows different pattern. The value of 85 companies in Germany is the highest, while it shows the lowest in 407 companies of Japan.
In the case of emerging markets, the average ESG performance of 34 companies in Thailand is 56.54 which is the highest value, while 37.93 point of 97 companies in China is the lowest. In the case of Chinese companies, the values of Environment (E) pillar and Social (S) pillar are the lowest, while the value of Corporate Governance (G) pillar is the highest. In the case of 34 companies in Thailand, they have the highest value in two pillars, Environment (E) and Social (S) pillar. And 97 companies in India shows the lowest value of Corporate Governance (G) pillar.
Ⅳ. Empirical Results
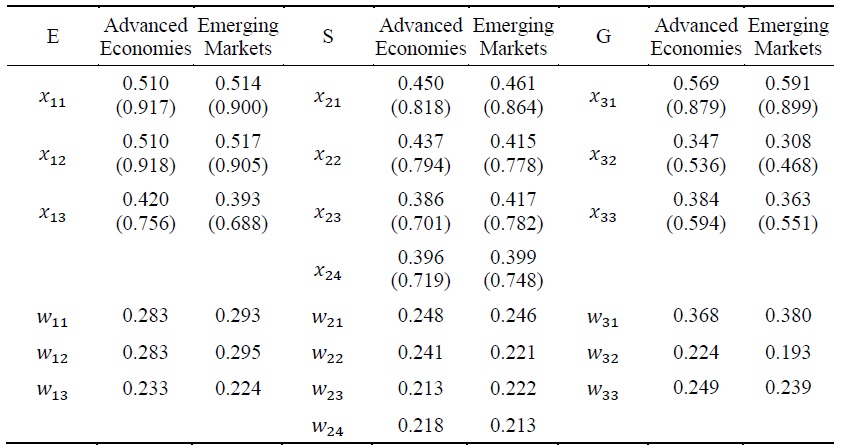
The first step to analyze the determinants of ESG performance of companies in 43 countries is the estimation of integrated ESG index (IESG). Hence, based on the value regarding companies ESG, this study calculates all parameters for the equations 2 and 3 to estimate IESG. Table below reports the results of the parameters estimation.
In general, every component of two pillars, the Environment (E) and Social (S) is fairly distributed. There is no big difference of coefficients of two pillars between advance economies and emerging markets, thus, the weighted values are fairly distributed. However, there is a significant difference in the case of the other pillar, Corporate Governance (G) whose weighted value of
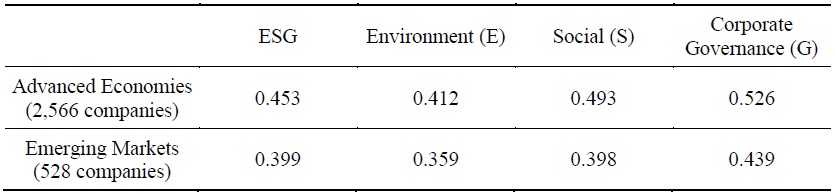
Based on the investigated data regarding companies’ ESG score, this paper estimates the integrated ESG index (IESG) of companies in two groups from 16 countries using equation 1 and 2, the following table shows the results of this calculation.
The result of calculating 2,566 companies in advanced economies shows that the average integrated ESG index over 12 years is 0.453, a value that does not exceed 0.5. Among all pillars of the of Environment (E), Social (S), and Corporate Governance (G), performance in Environment (E) pillar is relatively low. However the performance in Corporate Governance (G) pillar is more than 0.5. In the case of 528 companies in emerging markets, the performance of IESG is 0.399, a value that less than the emerging markets’ companies are less than 0.5 in all three areas, and the calculated values show results in the order of Corporate Governance (G) > Social (S) > Environment (E).
The following figure shows the trend of actual ESG score and the estimated Index (IESG) over the past decade.
Companies in advanced economies have been maintaining a gradually increasing growth pattern, while the companies in emerging markets have been rapidly increasing their performance. In the case of companies in advanced economies, the ESG performance is not significantly changed by 2015, then it grows gradually beginning in 2016. The companies’ ESG performance in emerging markets originally shows a figure that is significantly low compared to the companies’ performance in advanced economies. However, it grows rapidly beginning in 2016, and by 2022 shows similar performance to that of the companies in advanced economies. It is interesting to note that the ESG performance in both has improved since 2016, which has been similar value between both groups.
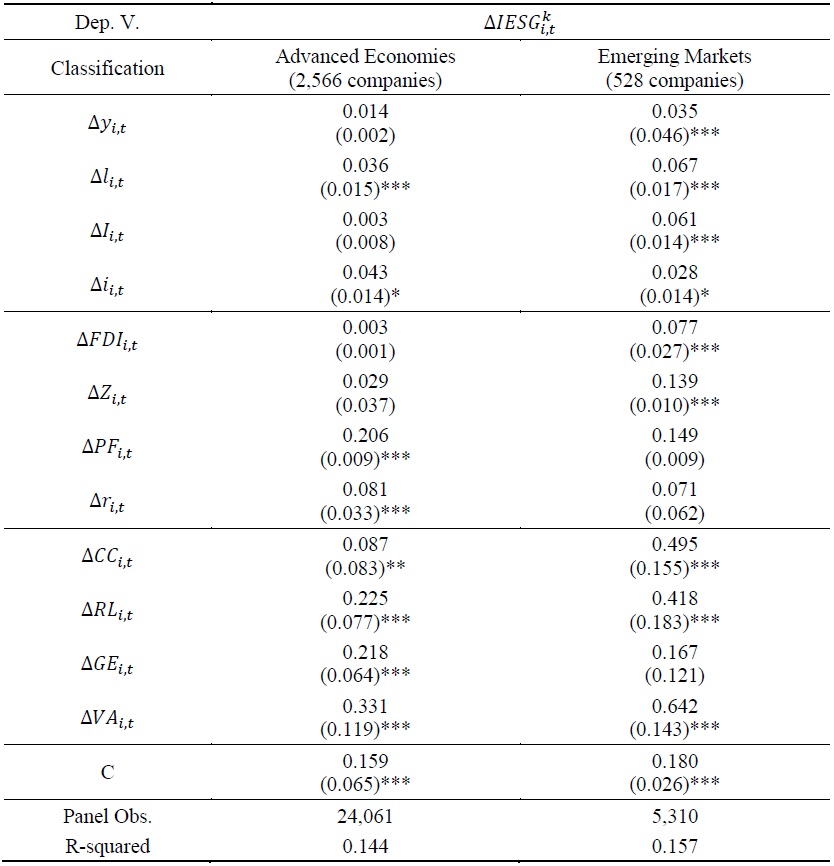
As described above, using the integrated ESG index, which is calculated from the actual score of ESG, this paper estimates the relationship between ESG performance of individual companies and the economic, financial, and institutional variables of the country. The following table shows the results of this estimation by using the equation 4.
First, the growth rate of GDP per capita (Δ
In the case of financial variables, the size of foreign direct investment (Δ
The positive relationship between ESG and foreign direct investment in companies of emerging markets can also be interpreted in connection with the increase in foreign share ownership of the company. For example, if the share ownership by foreigners in a particular company increases, the governance structure of the company, that is, the transparency of the board of directors and the protection of shareholder rights, can be strengthened.
And the strong positive impact of the growth rate of pension fund assets to GDP ratio on the ESG performance of companies in advanced economies, which contains advanced companies for social responsibility implies that institutional investors can play an important role of in the social responsibility investment.
In comparison to this, the government institutional indexes show a clear significance in both groups. All four variables such as the growth rate of corruption control (Δ
A point of interest is the companies’ ESG performance and its relationship with the institutional variables which contain information about the government’s policies and institutions. They have a particularly large positive effect on the companies in emerging markets.
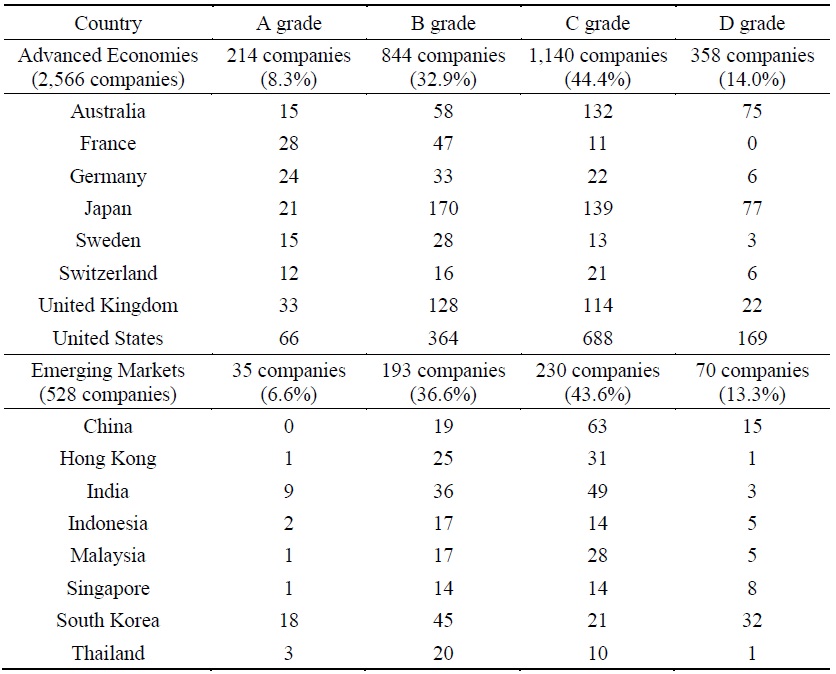
The next step is for the analysis of classifying grades of ESG. As it mentioned earlier in part of model explanation, in this paper, a total of 3,094 companies ESG performance is compared over the period of 12 years, from 2011 to 2022. Each company is classified according to the degree of the increase in ESG performance, and the characteristics of ESG performance were then compared with this. The following table shows the characteristics of the companies classified in this way.
In the case of 2,566 companies in advanced economies, 214 companies show an average A grade over the period of over the period of 12 years, from 2011 to 2022, and its ratio is about 8.3%. And 358 companies have an average D grade (14.0%) over the same period, so that the ratio of an average C or D grades is about 58.4%. The similar result is found in the 528 companies in emerging markets. 35 companies (6.6%) records an average A grade over the period of 12 years, from 2011 to 2022, while about 13.3% (70 companies) of the entire companies records D grade over the same period. As a result, 300 companies show an average C or D grade, which is 56.8% of whole companies in emerging markets.
The following figure shows the trends of the companies’ average ESG grade in both groups.
The trend in each grade shows different pattern between two groups. In the case of the companies in grade A, the companies’ ESG performance in advanced economies originally shows a figure that is relatively low compared to the companies’ performance in emerging markets. However it grows gradually, and by 2022 shows a higher performance than that of the companies in emerging markets. This trend also appears in the performances of the companies in grade B. The companies’ performance in advanced economies have been maintaining a gradually increasing growth pattern, and by 2022 shows a similar performance to that of the companies in emerging markets.
In the case of the companies in grade D, the trend shows a particularly opposite pattern to the previous trends in grade A and B. The companies’ performance in emerging markets shows a figure that is relatively low compared to the companies’ performance in advanced economies. However, it has improved significantly since 2016, which has recently been higher than that of the companies in advanced economies. In the case of the companies in grade C, the companies in emerging markets have been rapidly increasing their ESG performance since the beginning in 2011, and by 2022 shows a particular higher than that of the companies in advanced economies.
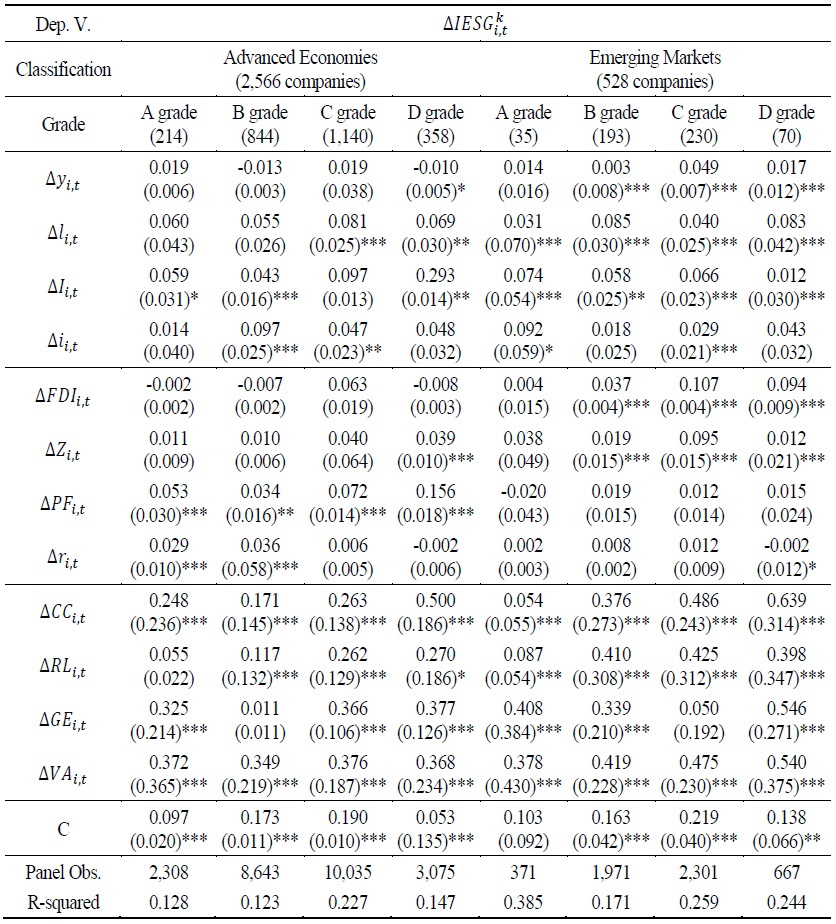
Using the above method of classification, the relationship between companies’ ESG performance and its determinants is then estimated. The results of these estimations are displayed in the following table.
The significance of companies’ ESG performance and its relationship with the country’s economy and institutional environment can be seen primarily in two groups of companies. There are companies that have shown a grade A in their ESG performance, including those companies that have shown a grade B in their values.
In the case of the companies in emerging markets, the positive relationship between GDP per capita (Δ
As predicted, the clear difference between two groups is found in financial variables, foreign direct investment (Δ
The institutional Indexes, which refer to government policy and the country’s institutional environment, show a positive relationship with all grades of companies’ ESG performance in both group. However no significance is found in the rule of law (Δ
This result can be interpreted in various ways, but in connection with the previous results, it can be said that companies whose ESG performance has declined significantly over the past decade can improve ESG performance if the environment of the country’s policies and institutions is improved.
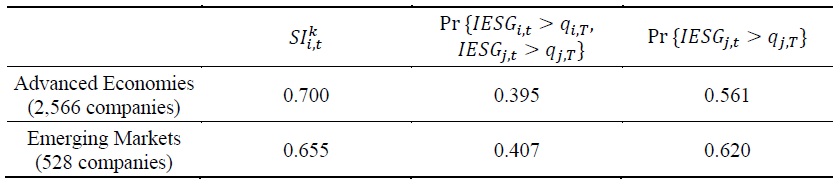
The final step is for the robustness. In order to measure how the country’s institutional background affects the ESG performance in the company, this study estimates the synchronization with other companies in the same country. Table below reports the results of calculated synchronization index.
The average values of synchronization index (SI) of two groups are over 0.500 which means the companies have an easy and fast synchronization with other companies whose ESG performance are relative high in the same country.
The average value of synchronization index (SI) for 2,566 companies in advanced economies is 0.700, and Pr {
It can be showed that the increase in ESG synchronization is very large in companies of advanced economies. Compared to 2011 (0.683), the index rose to 0.727 by 2022, an increase of 0.44 points. Companies in emerging markets shows only a small increase in values from 2011 (0.663) to 2022 (0.687). Among the countries in advanced economies and emerging markets, the companies in Australia have the highest synchronization of 0.745, while the companies in China have the lowest value of 0.476.
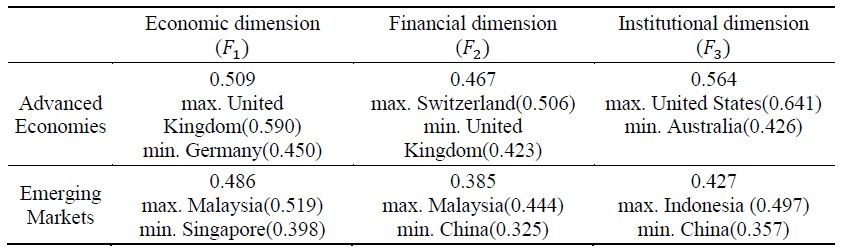
As it mentioned earlier, in order to measure the impact of the synchronization on the relationship between company’s ESG performance and its country’s economic and institutional environment, firstly this study normalizes 12-main variables which refer to country’s economic and institutional environment into three dimensions. The following table shows the results of this normalization.
The average value of economic dimension (
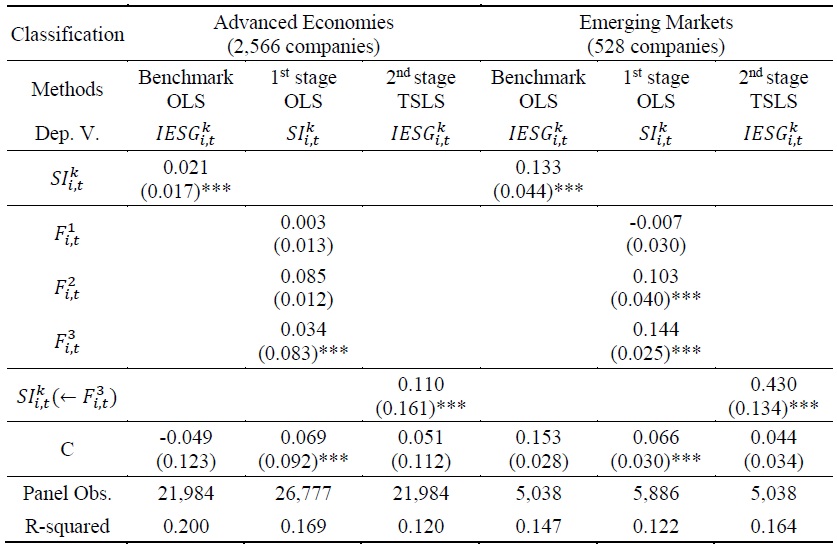
The following table shows the results of the estimations of the channel that affect the companies’ ESG performance by their countries’ economic and institutional background.
In the case of the estimation results of Benchmark OLS, companies’ synchronization with other companies’ high ESG performance has a positive effect on their ESG performance, and such a tendency is much stronger in the companies of emerging markets. In the case of 1st stage OLS, institutional dimension (
The 2nd stage TSLS is the relation between synchronization and ESG performance, but in this case, the company’s synchronization is significantly affected by institutional dimension (
An even more meaningful interpretation can be found by comparing the results of these estimates with the case of results of Benchmark OLS. The positive relationship between synchronization and ESG performance grows stronger, and though such trend is strong in both groups, it is especially notable in the companies in emerging markets. Such a tendency is found in the companies of advanced economies, but they show a lower level of significance than the companies in emerging markets.
This finding suggests that strong and stable institutional environment of a country makes the company’s social responsibility level improve, and it is possible that such an institutionalization makes the company’s synchronization with other companies whose have a high level of social responsibility strong, especially in the companies of emerging markets.
V. Concluding Remarks
This paper analyzed the ESG performance data of a total of 3,094 companies in 16 countries, over the 2011 to 2022 12-year period. Specifically, classifying a total of 3,094 companies into 2,566 companies in 8 advanced economies and 528 companies in 8 emerging markets, it investigated how the country’s exogenous variables affect ESG performance of the companies in the country. An empirical analysis of this study results are as follows.
First, the variables which had a clear difference effect on the ESG performance between advanced economies and emerging markets were the growth rate of GDP per capita in economic variable. The growth rate of GDP per capita had a positive effect on the ESG performance of 528 companies in emerging markets, while it had no significance in 2,566 companies in advanced economies.
Second, the clear difference in financial variables such as the growth rate of foreign direct investment, pension fund assets to GDP ratio, and stock market return rate was found to the significance between advanced economies and emerging markets. Strong positive significance was found to the case of foreign direct investment in the companies of emerging markets, while there was no significance in the companies in advanced economies. On the contrary, in the case of pension fund assets to GDP ratio and stock market return rate, they had a positive effect on ESG performance of the companies in advanced economies, while they had no significance in the companies in emerging markets. The positive relationship between ESG and foreign direct investment in companies of emerging markets can be interpreted in connection with the increase in foreign share ownership of the company.
Third, in two groups, the institutional indexes, which refer to government policy and the country’s institutional environment such as the rule of law, the government effectiveness, corruption control, and citizens’ voice and accountability showed a positive relationship with ESG performance of the companies. They had a particularly large positive effect on the companies in emerging markets. In the case of the companies in emerging markets, the degree of positive relationship with the detailed factors of ESG performance was relatively stronger than that of companies in advanced economies. And it was found that the degree of significance of citizens’ voice and accountability with the ESG performance is the strongest. Such a tendency is much stronger in the companies whose ESG performance has declined significantly over the past decade.
Finally, companies’ synchronization with other companies’ high ESG performance had a positive effect on their ESG performance, and such a tendency was much stronger in the companies of emerging markets. Additionally, institutional dimension had a positive effect on the companies’ synchronization, and such a tendency was much stronger in emerging markets. Hence, the positive relationship between synchronization and ESG performance grew stronger when the synchronization was affected by the institutional dimension which was composed by the government effectiveness, corruption control, and citizens’ voice and accountability, it is especially notable in the companies in emerging markets.
To summarize the results of the analysis above, for companies in countries that are in the developing stages of policy and institutional environment, the improvement of the policy and institutional environment had a greater effect on the companies’ ESG performance. For companies in emerging markets, it can be determined that an improvement in the country’s policy-related and institutional environment can significantly improve the ESG performance of a given company, and it is possible that such an institutionalization makes the company’s synchronization with other companies whose have a high level of social responsibility strong, especially in the companies of emerging markets.
Tables & Figures
Table 1.
Descriptive Statistics of the Variables
Note: Average values from 2011-2022. Ave. stands for average, Std. stands for standard deviation.
Table 2.
Descriptive Statistics of the Variables: ESG
Note: Average values from 2011-2022. Ave. stands for average, Std. stands for standard deviation.
Table 3.
Descriptive Statistics of the Variables: ESG by Country Classification
Note: Average values from 2011-2022.
Table 4.
Results of Parameters Estimations
Note:
Table 5.
Estimation Results of IESG
Note: Average values from 2011-2022.
Figure1.
ESG Index (IESG) Trend
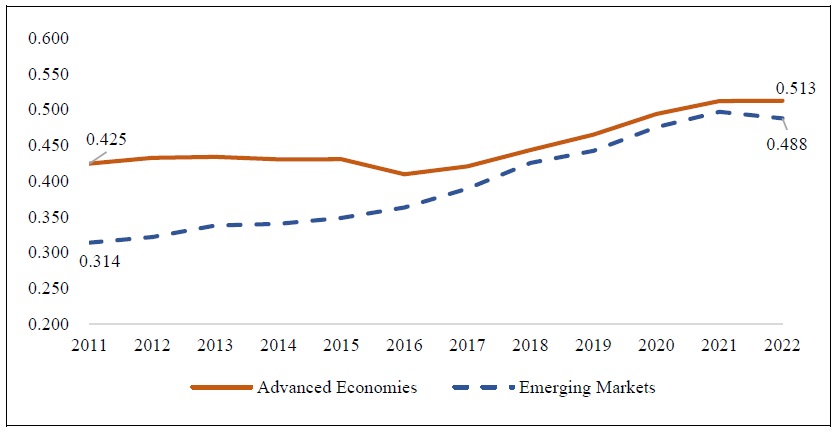
Table 6.
Estimation Results according to Companies of Factors Determining ESG
Notes: Panel OLS (fixed effect). Standard errors are given in parentheses. + significant at 10 percent, * significant at 5 percent, ** significant at 1 percent.
Table 7.
Classifying Results according to the Companies’ Average ESG Grade
Note: Average values from 2011-2022.
Figure 2.
ESG Index (IESG) Trend by Classifying Companies’ average ESG Grades
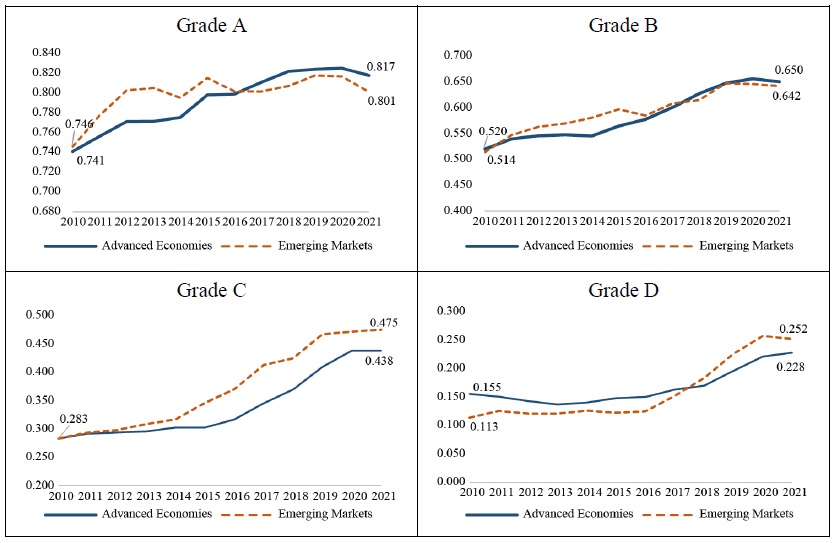
Table 8.
Estimation Results for Deciding Factors of ESG by Classifying Companies’ Average ESG Grade
Notes: Panel OLS (fixed effect). Standard errors are given in parentheses. + significant at 10 percent, * significant at 5 percent, ** significant at 1 percent.
Table 9.
Classifying Results Companies’ Synchronization Index
Note: Average values from 2011-2022.
Figure 3.
Synchronization Index (SI) Trend
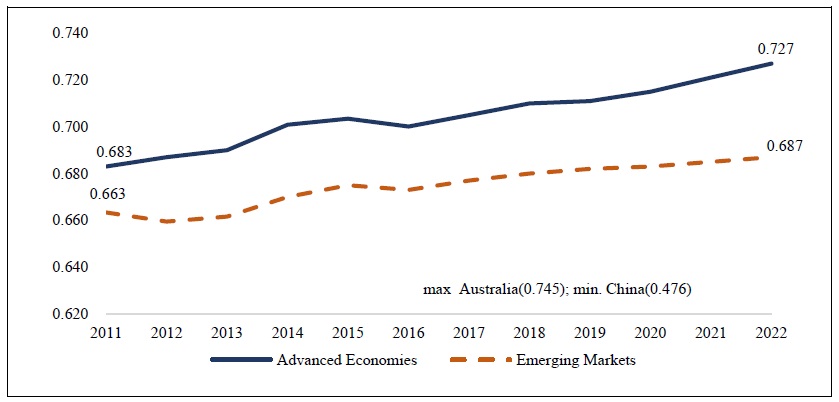
Table 10.
Classifying Results Companies’ Synchronization Index
Note: Average values from 2011-2022.
Table 11.
The Pathway of Strengthening ESG Performance by Improving Synchronization through Institutional Environment
Notes: Panel OLS (fixed effect). Standard errors are given in parentheses. + significant at 10 percent, * significant at 5 percent, ** significant at 1 percent.
References
-
Adrian, T. and M. K. Brunnermeier. 2009. “CoVaR.”
New York Federal Reserve Bank Staff Report no. 348. - Balatbat, M. 2012. “ESG Scores and its Influence on firm performance: Australian Evidence.” School of Accounting Seminar Series, Semester 2, 2012. The University of New South Wales Working Paper.
-
Banerjee, A. 1992. “A Simple Model of Herd Behavior.” th
e Quarterly Journal of Economics , vol. 107, no. 3, pp. 797-817.
-
Benlemlih, M. 2014. “Why do socially responsible firms pay more dividends?”
PWC Luxemburg . Available at SSRN 256876. - Barnea, A. and A. Rubin. 2005. “Corporate Social Responsibility as a Conflict Between Owners.” Center for Responsible Business Working Paper. UC Berkeley.
-
Beurden P. and T. Gossling. 2008. “The Worth of Value - A Literature Review on the Relation Between Corporate Social and Financial Performance.”
Journal of Business Ethics , vol. 82, pp. 407-424.
-
Borgers, A., Derwall, J., Koedijk, K., and J. T. Horst. 2013. “Stakeholder relations and stock returns: On errors in investors’ expectations and learning.”
Journal of Empirical Finance . vol. 22, pp. 159-175.
-
Campbell, J. L. 2007. “Why Would Corporations Behave in Social Responsible Ways? An Institutional Theory of Corporate Social Responsibility.”
Academy of Management Review , vol. 32, pp. 946-967.
-
Chan-Lau, J. A. 2010. “The Global Financial Crisis and its Impact on the Chilean Banking System.”
IMF working paper , no. 2010/108. -
Chih, H-L., H-H. Chih, and T-Y. Chen. 2010. “On the Determinants of Corporate Social Responsibility: International Evidence on the Financial Industry.”
Journal of Business Ethics , vol. 93, pp. 115-135.
-
Chung, R., Firth, M., and J.B. Kim. 2002. “Institutional monitoring and opportunistic earnings management.”
Journal of Corporate Finance , vol. 8, pp. 29-48.
-
Edams, A. 2011. “Does the stock market fully value intangibles? Employee satisfaction and equity prices.”
Journal of Financial Economics , vol. 101, pp. 621-640.
-
Gjølberg, M. 2009. “Measuring The Immeasurable?”
Scandinavian Journal of Management , vol. 25, no. 1, pp. 10-22.
-
Godfrey, P.C., Merrill, C.B., and J.M. Hansen. 2009. “The relationship between corporate social responsibility and shareholder value: An empirical test of the risk management hypothesis.”
Strategic Management Journal , vol. 30, pp. 425-445.
-
Gregory, A., Whittaker, J., and X. Yan. 2016. “Corporate Social Performance, Competitive Advantage, Earnings Persistence and Firm Value.”
Journal of Business Finance & Accounting , vol. 43, no. 1, pp. 3-30.
-
Gugler, K., Mueller, D. C., and B. B. Yurtoglu. 2008. “Insider ownership, ownership concentration and investment performance: An international comparison.”
Journal of Corporate Finance , vol. 14, pp. 688-705.
-
Hatch, M. J. and P. H. Mirvis. 2009. “Designing a positive image: corporate branding and Social responsibility.”
Advances in Appreciative Inquiry , vol. 3, pp. 35-55. -
Lin, C. H., Yang, H. L., and D. Y. Liou. 2009. “The Impact of corporate Social Responsibility on Financial Performance: Evidence From Business in Taiwan.”
Technology in Society , vol. 31, pp. 56-63.
-
Nelling, E. and E. Webb. 2009. “Corporate social responsibility and financial performance: the ‘vicious cycle’ revisited.”
Review of Quantitative Finance and Accounting , vol. 32, no. 2, pp. 197-209.
-
Nollet, J., Filis, G., and E. Mitrokostas. 2016. “Corporate Social Responsibility and Financial Performance: A Non-linear and Disaggregated Approach.”
Economic Modelling , vol. 52(B), pp. 400-407.
-
Orlitzky, M., Schmidt, F. L., and S. L. Rynes. 2003. “Corporate Social and Financial Performance: A Meta-Analysis.”
Organization Studies , vol. 24, pp. 403-441.
-
Palmer, K., Oates, W.E., P.R. Portey. 1995. “Tightening environmental standards: the benefit-cost or the no-cost paradigm?”
Journal of Economic Perspectives , vol. 9, no. 1, pp. 119-132.
- Sarma, M. 2008. “Index of Financial Inclusion.” ICRIER Working Paper, no. 215.
- Skouloudis, A. 2014. “Revisiting the National Corporate Social Responsibility Index.” MPRA working paper, pp. 1-23.
-
Yamaguchi, K. 2008. “Static and Dynamic Return On Corporate Environmental Investment Activity: Empirical Evidence From Japan.”
CSR Paper , vol. 36, pp. 1-12.