

- EAER>
- Journal Archive>
- Contents>
- articleView
Contents
Citation
| No | Title |
|---|
Article View
East Asian Economic Review Vol. 29, No. 1, 2025. pp. 3-40.
DOI https://dx.doi.org/10.11644/KIEP.EAER.2025.29.1.443
Number of citation : 0View
68
Download
60
Analysis of Artificial Intelligence Exposure Across Industries in South Korea and the United States
|
|
Sogang University |
|---|---|
|
|
Korea Institute for International Economic Policy |

Abstract
This study examines the impact of AI exposure on industries in South Korea and the United States from 2019 to 2022, using the AI Industry Exposure (AIIE) index developed by Felten et al. (2021). In South Korea, AI exposure is positively associated with employment but negatively associated with real labor income per capita, with labor productivity potentially driving the employment gains. Additionally, an analysis of occupational employment in South Korea confirms a positive correlation with AI exposure. For the U.S., AI exposure shows more pronounced labor market influence than in South Korea.
JEL Classification: O33, J24, J23
Keywords
Artificial Intelligence, Industries, Labor Market
I. Introduction
ChatGPT gained significant global attention after attracting over 1 million users within 5 days of its initial release in November 2022. The global artificial intelligence market is expected to grow from $515.31 billion in 2023 to $621.19 billion in 2024, reaching $2.74 trillion in 2032, with a projected compound annual growth rate of 20.4% over the forecast period (Kim, 2024). While the impact of generative AI on the global economy can be examined from various perspectives, its implications for the labor market stand out.
Recent studies have increasingly focused on the effects of AI on labor markets, industrial structures, and economic growth. According to research by Cazzaniga et al. (2024), 40% of global employment is exposed to AI. AI could lead to a restructuring of labor markets by replacing high-skilled and high-wage workers, thereby enhancing productivity, creating new jobs, and driving economic growth. Hatzius et al. (2023) suggests that while most jobs and industries are partially exposed to AI, they are more likely to be augmented rather than replaced. Historically, jobs displaced by automation have been offset by the creation of new roles, with the emergence of new occupations due to technological innovation accounting for most long-term employment growth. They predict that widespread adoption of generative AI could increase the annual U.S. labor productivity growth rate by 1.5 percentage points over the next decade and ultimately boost global GDP by 7% annually. This reflects both concerns about labor displacement and optimism for future economic growth driven by AI.
The development and adoption of generative AI is progressing rapidly, leading to significant economic impact, but there is insufficient data to prove its effects. Recent research has utilized case studies and text mining to indirectly explore the impact of generative AI. Chui et al. (2023) finds that generative AI is expected to generate between $2.6 trillion and $4.4 trillion in annual economic value. Generative AI will impact all industries, with banking, high-tech, and life sciences expected to be most impacted as a percentage of revenue. Additionally, they suggested that while generative AI can significantly improve labor productivity across the economy, investments in worker reskilling or redeployment will be necessary.
However, South Korea’s investment in and utilization of AI is relatively low compared to other countries, raising concerns about its future economic growth. According to the 2024 AI Index Report (Maslej et al., 2024), private investment in AI in the United States in 2023 was $67.2 billion, approximately 48.4 times the investment amount of Korea, which ranked ninth ($1.4 billion). Since 2013, the U.S. has consistently ranked first in private AI investment, and the gap between the U.S. and other countries has widened over time. This disparity is particularly evident in investments related to generative AI, such as ChatGPT. In 2022, the U.S. exceeded the combined generative AI investment of the EU and the UK by approximately $1.9 billion, and this figure expanded to $21.1 billion in 2023. According to PwC (2024), South Korea’s industries have been slow to adopt and utilize AI. This is attributed to a shortage of skilled personnel, shared data, and platform infrastructure, as well as insufficient policy support and investment for AI development. The gap is particularly evident in sectors such as finance, logistics, media, manufacturing, and law, compared to global standards.
The launch of generative AI and its rapid adoption by businesses across various industries suggest that the technology’s impact varies by industry. While prior research has primarily focused on the effects of AI at the occupational or firm level, this study examines key indicators of industry-level exposure to AI in South Korea and compares these findings with U.S. industries leading in private AI investment. Using the AI Industrial Exposure (AIIE) index developed by Felten et al. (2021), we examine the effect of AI on productivity, employment, and wages in industries in South Korea and the U.S. since 2019. We estimate the relationship between the AIIE and industry indicators using OLS with two-way fixed effects.
Our findings indicate that South Korean industries with greater exposure to AI experienced increases in employment and sales, but a decline in real labor income per capita. The results further suggest that the positive association between AI exposure and employment is driven by increases in labor productivity. In the U.S., industries with higher AI exposure experienced not only employment growth but also increases in both hourly compensation and total labor compensation. Additionally, we investigate the relationship between AI exposure and employment in South Korea at the occupational level, finding that higher occupational exposure to AI is linked to increases in short-term employment shares.
The rest of the paper proceeds as follows. Section 2 reviews the literature related to our study. Section 3 discusses the data and the construction of the AIIE index. Section 4 presents empirical analysis results on the relationship between industry-specific indicators and the AIIE index of South Korea and the United States, and Section 5 concludes.
II. Literature Review
Studies on the adoption of AI and robotics are grounded in the literature on innovation and technological development. Frey and Osborne (2017) predicted that computerization would impact jobs involving non-routine tasks, estimating that 47% of U.S. jobs were at high risk of computerization. Studies such as Brynjolfsson et al. (2018) and Felten et al. (2018) have examined the impact of AI and automation on the U.S. economy. Brynjolfsson et al. (2018) measured the suitability of tasks for machine learning and argued that the reshaping of jobs due to machine learning would affect the labor market differently from past automation driven by robots.
There have also been studies that identify “winners” and “losers” due to AI adoption and analyze the distributional effects of new technologies. Acemoglu et al. (2022) demonstrated that there was a significant increase in AI-related employment between 2010 and 2018, primarily attributable to firms with a high degree of AI exposure. These firms decreased hiring for non-AI related roles as they adopted AI. However, the overall impact of labor displacement due to AI on employment and wage growth in occupations and industries was found to be minimal at present. Autor (2022) reviews the evolution of economic thinking on the relationship between digital technology and inequality across four decades, and presents four paradigms (educational race, task polarization, automation-reinstatement race, and the era of AI uncertainty). While technological change creates winners and losers, the author concludes that complementary institutional investments are necessary to generate shared benefits.
Webb (2019) and Felten et al. (2021) constructs a measure of an occupation’s exposure to AI. Webb (2019) shows that high-skilled jobs are relatively more exposed to AI technology, compared to robotics and software. In a similar study, Tolan et al. (2021) linked various tasks and cognitive abilities to a list of AI benchmarks used to evaluate progress in AI techniques. An application to occupational databases provides results that some jobs that were previously thought to be immune to automation could be more exposed to AI. Han and Oh (2023) employed the Webb (2019) occupational AI exposure index, adjusted to the Korean Standard Classification of Occupations, to identify Korean occupations susceptible to AI and examine the consequent effects on employment and wages. Their findings indicate that occupations with higher AI exposure were more prone to job losses and slower wage growth. Georgieff and Hyee (2022) adapt the measure developed by Felten et al. (2021) to analyze the link between AI and employment in a cross-country context. Zarifhonarvar (2024) uses text mining on the International Standard Classification of Occupations (ISCO) database and finds that 32.8% of all occupations will be significantly impacted by generative AI, and 36.5% will be partially affected. Bonfiglioli et al. (2023) classify AI-related occupations as those whose job postings most frequently require specialized software used for machine learning and data analysis. The authors use a shift-share instrument that combines industry-level AI adoption with local industry employment, and find negative effects of AI exposure on employment across commuting zones and time.
Song et al. (2021) empirically analyzed the relationship between AI adoption and productivity in domestic firms. While their study found no statistically significant correlation between AI adoption and productivity in the domestic manufacturing sector overall, they discovered a positive impact of AI on productivity when firms were categorized by their ownership structure, specifically those with multiple business units. Czarnitzki et al. (2023) conducted an empirical analysis of the impact of AI adoption on productivity in German firms, using revenue as a proxy for productivity. Their findings suggest that there is a statistically significant positive relationship between AI adoption and productivity.
III. Data
We constructed the AI Industrial Exposure (AIIE) for the United States and South Korea by calculating a weighted average of the AI Occupational Exposure (AIOE) of each occupation within an industry, using the employment share of each occupation as the weight. The AIOE values were obtained from Felten et al. (2021). For South Korea, the AIOE values were mapped to the Korean Standard Classification of Occupations (KSCO, 7th edition) through the International Standard Classification of Occupations (ISCO-08). Similarly, Han and Oh (2023) calculated South Korean occupational and industrial AI exposure index based on the measure by Webb (2019). Felten et al. (2021) constructed the AIOE using data from the 2019 O*NET database. They selected ten categories from the Electronic Frontier Foundation (EFF)’s AI application definitions and linked these categories to workplace abilities. By developing a dataset based on survey responses collected from Amazon Mechanical Turk (mTurk) gig workers, they established the connections between AI applications and workplace abilities, enabling the calculation of ability-level exposure. For details on the calculation process, see Felten et al. (2021). They derived the AIOE by weighting the ability-level exposure scores and the prevalence and importance indicators of each ability. The total occupational exposure to AI was calculated by summing all the weighted ability-level AI exposures. They then constructed an AIIE by calculating a weighted average of the AIOE scores, where weights are determined by industry employment figures based on the four-digit NAICS classification system.
In this study, we constructed an updated AIIE for the U.S. using employment data from 2020 to 2022. Similarly, we constructed the AIIE for South Korea using employment data from 2019 to 2022, with details provided in the Appendix A.3. Structurally, a high AIIE for a given industry indicates that a significant proportion of workers in that industry are employed in occupations with high AI exposure. Since industries that actively utilize AI technologies may not necessarily align with industries that employ a large number of occupations with high AI exposure, we cross-validated whether the AIIE represents AI exposure in Korean industries using data from the Ministry of Science and ICT’s “Survey on Corporate Informationization Statistics.”1 By calculating the proportion of companies using AI technologies and services in the 1-digit industry classifications in South Korea and conducting a sign test with AIIE, we could not conclude that the AIIE rankings derived from each index were different.2
For the U.S., we calculated AIIE at the NAICS 2-digit (18 categories), NAICS 3-digit (59 categories), and NAICS 4-digit (195 categories) industry levels, following the North American Industry Classification System (NAICS). For the regression analysis, we use U.S. industry data at the NAICS 3-digit level (38 categories) and NAICS 4-digit level (96 categories) for the year 2022. For South Korea, we calculated AIIE at the KSIC 1-digit (21 categories), KSIC 2-digit (75 categories), and KSIC 3-digit (213 categories) industry levels, using the Korean Standard Industrial Classification (KSIC). To compare AIIE in both countries, we used the International Standard Industrial Classification of All Economic Activities (ISIC Rev.4). For further details on the data and the ranking of AI exposure of industries, see Appendix A.3.
1)The Survey on Corporate Informationization Statistics investigated whether private sector companies utilize artificial intelligence (AI) technologies and services. For the 19 1-digit industry classifications in South Korea (KSIC 10th revision), we calculated the proportion of companies using AI by using the number of companies that use or do not use AI.
2)The sign test, a statistical methodology for comparing two populations of ordinal data, was employed. When comparing the AIIE-derived rankings with those based on the proportion of companies using AI technologies, the p-value for the null hypothesis that the two rankings are identical was 0.607, failing to reject the null hypothesis.
IV. Empirical Analysis
This section presents the regression specification and results. In section 4.1, we provide the results on the relationship between AI exposure and industry-level measures. All industry- level regressions are performed separately for South Korea and the United States. In section 4.2, we further analyze the impact of AI on the labor market in South Korea with results on the occupation-level AI exposure and employment.
1. Main Regression Results
Using the data from 2019 to 2023 described in section 3 and Appendix 5 we estimate the following regression model:

where

where
In addition, we consider the usage of robotics technologies in industries. Both AI and robotics are capable of automation but the effects may differ across the two technologies. It is likely that technologies that incorporate AI will be able to automate far more tasks than purely robot-based technologies (Raj and Seamans, 2019). We include the lagged percentage of firms within an industry that use robotics,
We first examine the results for industries in South Korea. Table 3 presents estimates for KSIC 1-digit industries’ value added creation & distribution indicators, and growth & profitability indicators. Based on the results in column (1), indicators that show statistically significant positive relationship with the AIIE are value added growth per capita, sales growth per capita, and sales growth rate. Indicators that have a statistically significant negative relationship with the AIIE are sales per capita, capital intensity, labor share, real labor income per capita, total capital growth rate, equity capital growth rate, and net profit as a share of total capital. Industries that are heavily exposed to AI technology experience a reduction in real labor income per capita. This result is similar to Han and Oh (2023) which finds that in South Korea, occupations exposed to AI experience a decline in wages. Additionally, AI-exposed industries face a reduction in labor share, which is the proportion of labor income relative to the total of operating income and labor income. This suggests that workers in AI-exposed industries are being negatively impacted, with a decline in labor shares and real labor income.
The results in column (2), which incorporate robotic usage, are very similar to the estimates in column (1). The percentage of firms that use robotics technologies and the AIIE index has correlation of 0.32. The industries with high AI exposure are financial service, insurance, and information whereas industries with high usage of robotics are manufacturing.
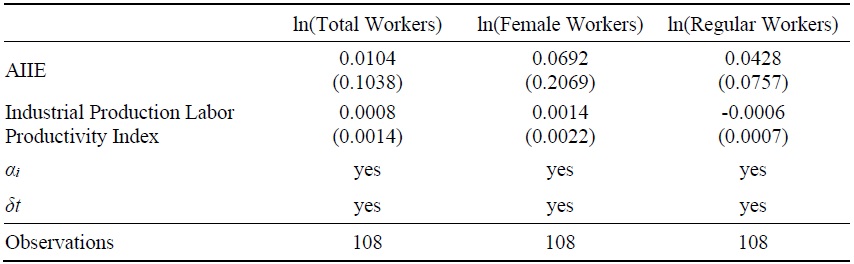
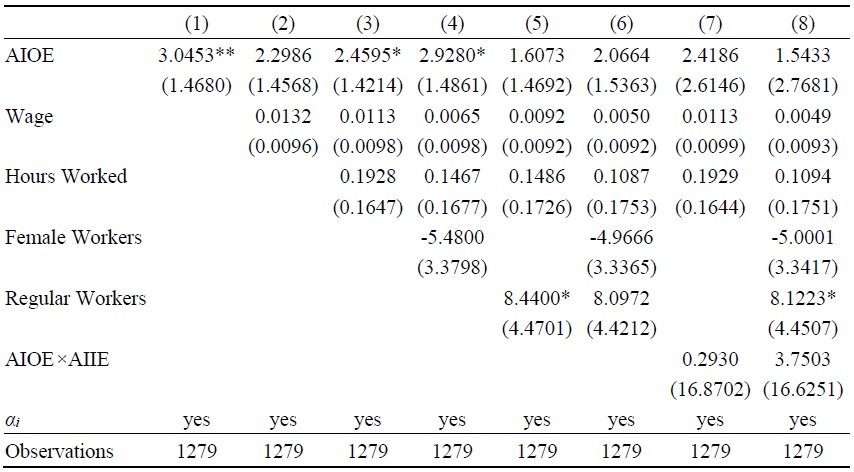
Table 4 presents estimation results for KSIC 2-digit industries. From column (1), indicators that show statistically significant positive relationship with the AIIE are the number of workers, female workers, regular workers, and sales. Higher AI exposure is associated with an increase in employment in the industry, and in particular, female workers and regular workers. These results differ from the occupation-level employment analysis in Han and Oh (2023), which shows that occupations with higher AI exposure experienced a decline in employment shares. Taking their findings and ours together, we can speculate that the relationship between AI exposure and occupational employment varies by industry. For example, the role of a bookkeeper is highly susceptible to AI, potentially leading to a decline in overall employment across industries. However, as AI-intensive industries expand, the demand for bookkeeping within these industries may temporarily increase in the short run. Occupations with high AI exposure are likely to be less labor-intensive and have a higher proportion of female workers. In section 4.2, we analyze occupation-level employment and AI exposure and assess whether this relationship varies across industries.
Our results indicate a gender-specific relationship between AI exposure and employment. Lane (2024) reports that employment growth between 2012 and 2022 was more rapid in those occupations most exposed to AI. Notably, women’s employment growth in these occupations outpaced that of men, reflecting increased female entry into traditionally male-dominated fields. One possible explanation for the gender-specific effect is that labor-intensive industries, which tend to have lower AI exposure, also employ fewer women. KSIC 2-digit industries with less than 10% female employment have an average AIIE of -0.44, which falls below the 25th percentile of AIIEs across 75 industries. This suggests that industries with low female employment are, on average, less exposed to AI. These industries include labor- intensive sectors such as forestry, coal mining, crude petroleum and natural gas extraction, as well as land transport and transport via pipelines.
Another interesting finding is that sales and sales growth per capita exhibit a statistically significant positive relationship with AIIE, whereas the sales growth rate per capita has a statistically significant negative relationship with AIIE. Given that the number of workers is also positively associated with AIIE, industries highly exposed to AI experience growth in both employment and sales. However, the relatively larger increase in employment leads to a decline in sales per capita. The positive correlation between sales growth per capita and AIIE suggests that, in the long term, AI-exposed industries may experience higher sales per capita compared to other industries. According to Babina et al. (2024), firms that invest more in AI experienced higher growth in sales and employment from 2010 to 2018. Although the AI exposure index used in our study differs from the measure of AI adoption in Babina et al. (2024), their findings indicate that AI investments are consistently associated with increased employment and sales at the industry level.
To further examine AI-exposed industries’ employment in South Korea, we estimate the following regression:

where
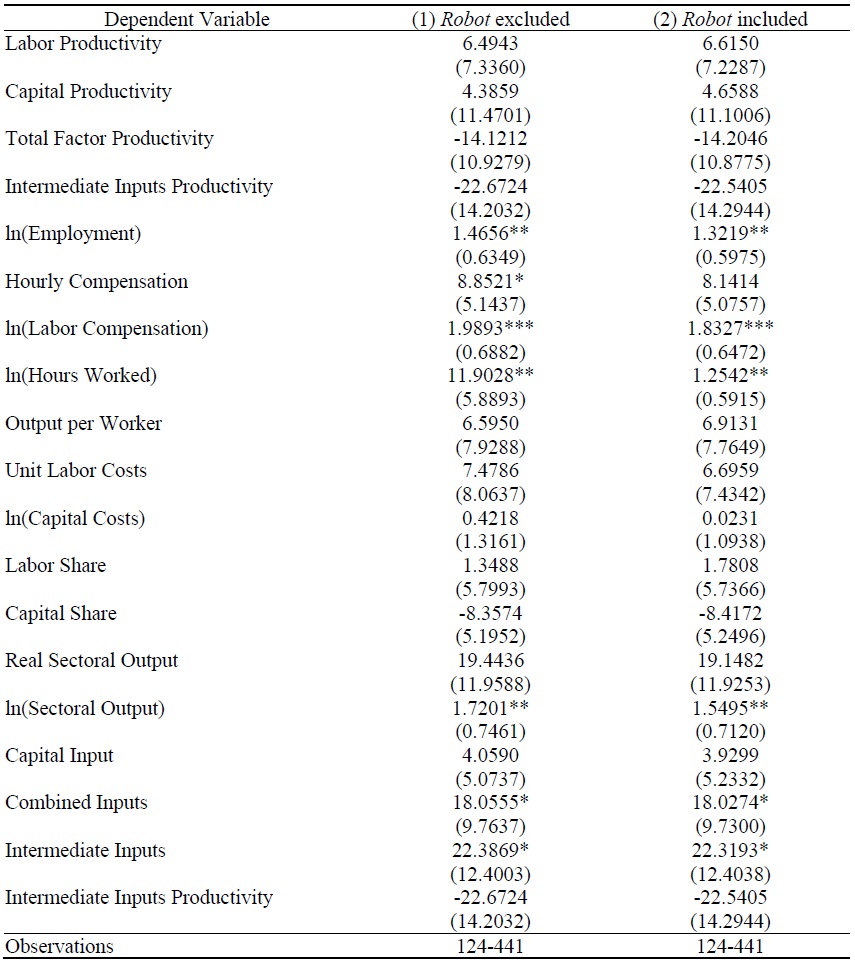
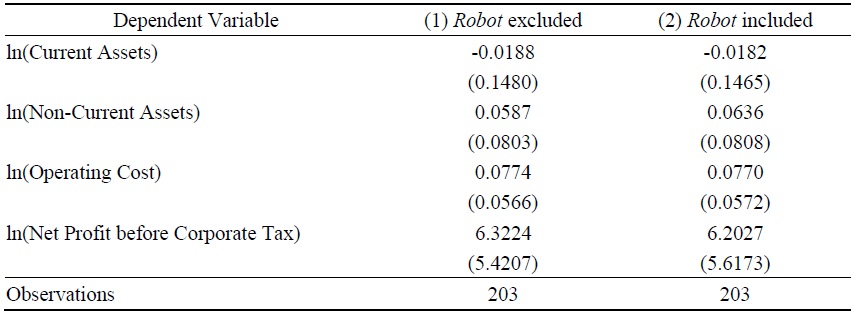
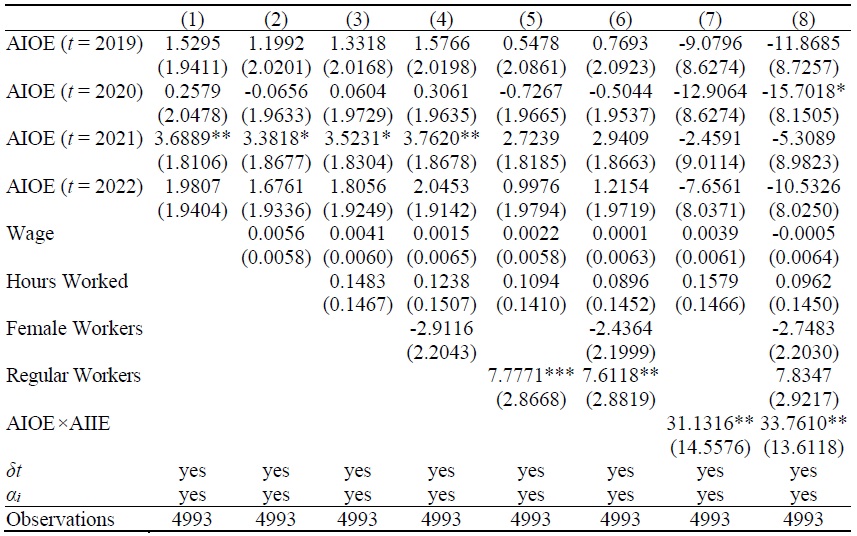
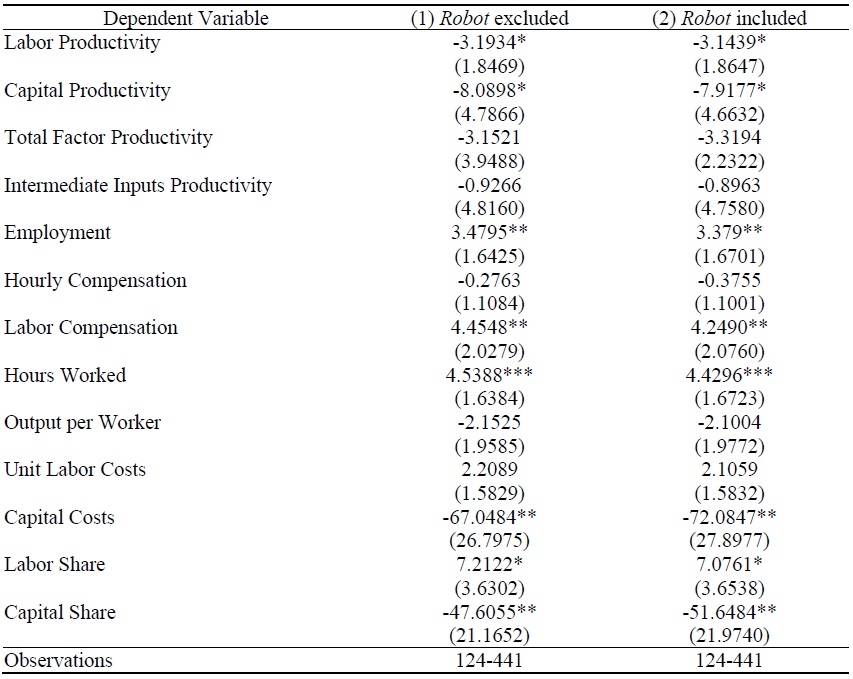
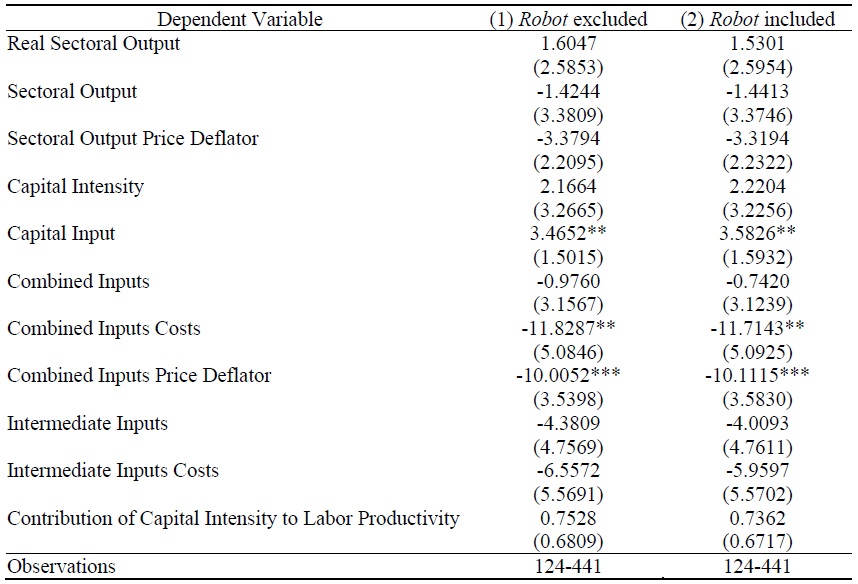
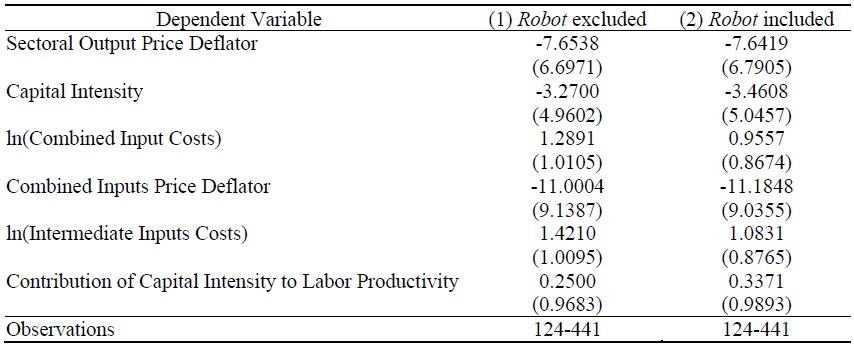
Table 7 presents estimation results of the relationship between the AIIE and U.S. NACIS 4-digit industry indicators. Column (2) shows the estimation results that control for robotic usage, which are similar to the estimates in column (1). Industries with high usage of robotics are primarily manufacturing, and most of them have low AI exposure, so the correlation between the AIIE and robot variable is close to zero in the U.S.6 Based on column (1), industry indicators that show a statistically significant positive relationship with the AIIE are employment, hourly compensation, labor compensation, hour worked, sectoral output, combined inputs, and intermediate inputs.
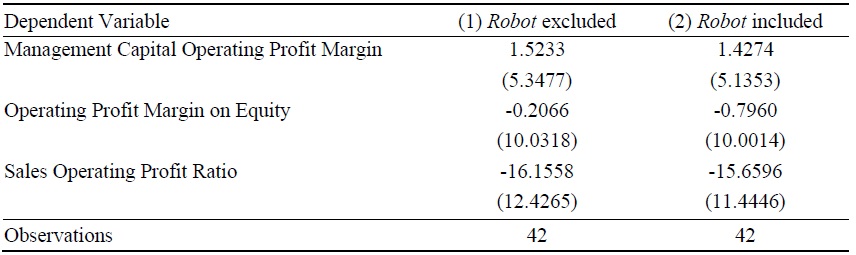
As in the case of South Korea, employment in U.S. industries is positively correlated with AI exposure. The difference is that industry indicators related to wages, specifically hourly compensation and labor compensation are positively correlated with the AIIE, whereas real labor income per capita in South Korea is negatively correlated. Table 8 reports estimates of regression (3) when the labor productivity is included as an explanatory variable. Employment, hourly compensation, and labor compensation remains statistically significant and positively correlated with the AIIE. This suggests that AI has a direct relationship with employment and wages, even after controlling for labor productivity.
According to Acemoglu et al. (2022), human-complementary AI can increase labor demand by enhancing human productivity in tasks where AI is adopted. If labor and AI algorithms are highly substitutable in a firm’s production process, improvements in AI task performance initially lead to labor substitution, particularly affecting the hiring of AI-specialized workers. However, firms that lower production costs through AI adoption can maximize profits by reducing product prices, which subsequently increases demand. This process creates a labor demand expansion effect (production effect). If the productivity gains are substantial, firm-level employment will rise alongside sales growth (Han, 2023).
Our finding that AI exposure is positively correlated with labor compensation can be explained by the study of Cazzaniga et al. (2024). If AI significantly enhances human labor in specific occupations and generates substantial productivity gains, the resulting economic growth and increased labor demand could outweigh the partial replacement of labor tasks, leading to labor income growth across much of the income distribution. Cazzaniga et al. (2024) highlights three channels through which AI affects the economy: labor displacement, complementarity, and productivity gains. When AI strongly complements labor, the positive complementarity effect outweighs the displacement effect, resulting in a smaller proportion of high-income workers being adversely affected compared to the lower-complementarity case. Additionally, when AI-driven productivity gains are accounted for, labor income increases for all workers, as higher productivity boosts demand for all factors of production in the economy.
In addition, we take the first differences of the U.S. industry indicators and estimate regression (2). Table A11 and Table A12 in the Appendix present the estimates based on the indicators that are converted to year-over-year percentage change. Growth rates with a statistically significant negative relationship with the AIIE are labor productivity, capital productivity, capital costs, capital share, combined input csts, and combined inputs price deflator. Growth rates with a statistically significant positive relationship with the AIIE are employment, labor compensation, hours worked, labor share, and capital input. Hence, higher AI exposure is associated with an increase in industry employment and labor compensation, in levels and growth rate. This suggests that U.S. industries are more influenced by AI technology compared to industries in South Korea.7
However, it should be noted that the analysis used data from 2019 to 2023, and the impact of COVID-19 on the U.S. labor market must be taken into account. In particular, industries with high exposure to AI, such as finance and insurance, information and communications, and professional, scientific, and technical services, experienced higher wage growth rates and telework adoption rates compared to other industries. All three industries transitioned to remote work easily, and workers in the information and communications and technical services sectors experienced longer working hours due to the flexibility of remote work.8
From 2020 to 2021, average weekly wages in the information industry increased by 12.3% and 9.8% in finance and insurance.9 Therefore, it is challenging to analyze the impact of AI on industries using data from the overheated U.S. labor market caused by COVID-19.
2. Regression Results for Occupations in Korea
This section examines occupation-level employment and exposure to AI in South Korea during the period from 2018 to 2022. We estimate the following regression model:

where Δ
As Table 9 shows, AI exposure has a positive impact on the change in employment. The relationship is statistically significant in columns (3) and (4), which includes average wage, average hours worked, and the share of female workers. For example, moving from the 25th to the 75th percentile of exposure to AI is associated with an increase in within-industry employment shares of 5.2%p, based on estimates in column (4).12 The statistical significance disappears when the share of full-time workers or the interaction term is included. Therefore, the impact of AI exposure on occupational employment changes does not depend on whether the industry as a whole is more or less exposed to AI.13
Higher exposure to AI is associated with an increase in within-industry occupational employment shares. This is consistent with the South Korea’s industry-level results in section 4.1; industries with high exposure to AI are associated with an increase in employment. Note that we measure the occupational employment change from 2018 to 2022, which is a short-term change compared to the analysis in Han and Oh (2023) and Webb (2019).14 Our estimates of the relationship between AI exposure and occupational employment differ from theirs mainly because we are examining short-term changes.
The short-term increase in occupational employment with high AI exposure can be attributed to three key factors. First, the extent of computer usage is a significant determinant. Occupations with high AI exposure, such as those in the finance and insurance sectors, have been found to experience higher employment growth. According to Georgieff and Hyee (2022), studies have shown that jobs involving extensive computer use exhibit a stronger positive correlation between AI exposure and employment growth. This is because partial automation driven by AI not only directly enhances productivity but also shifts the job task composition towards higher-value activities, further boosting productivity. Such increases in labor productivity and output offset the direct displacement effects of automation for workers with strong digital skills. Workers find it easier to effectively utilize AI and transition to higher-value tasks within their jobs that cannot be automated.
Secondly, AI has the potential to both displace certain jobs and generate new demand for labor (Guliyev, 2023). AI can generate new jobs and expand existing ones. Even in occupations with significant AI exposure, human oversight and review can contribute to employment growth. Instead of replacing jobs, AI can enhance human productivity, driving job creation and improving efficiency. Due to the current limitations of AI technology, human judgment remains indispensable in the short term. Consequently, in highly AI-exposed occupations, human cognition and expertise are crucial for boosting productivity.
Finally, the issue of cost warrants consideration. As technologies capable of replicating task comprehension and professional expertise in highly AI-exposed occupations continue to evolve, it remains uncertain whether the associated costs can be fully offset. Given the incomplete state of technological advancements, it cannot be conclusively asserted that occupations with high AI exposure will be rapidly replaced by AI in a short period. Moreover, the time required to secure adequate funding for AI technology and its implementation suggests that employment in highly AI-exposed occupations is unlikely to decline rapidly in the short term. Consequently, employment in these occupations may experience growth in the near term.
3)The rate of firms that use robotics within an industry is available for KSIC 1-digit industries. The estimation results in
4)The National Center for Science and Engineering Statistics (NSF) data in the Annual Business Survey varies slightly from year to year, making it difficult to construct the variable by year.
5)
6)The correlation between the U.S.
7)Hourly compensation and labor compensation are nominal variables. For South Korea industry indicators in
8)Bureau of Labor Statistics (https://www.bls.gov/spotlight/2021/impact-of-the-coronavirus-pandemic- onbusinesses-and-employees-by-industry, accessed on July 9, 2024), World Economic Forum (
9)Pew Research Center, “How has the Covid-19 pandemic reshaped how US get paid?” Jan 6, 2022 (
10)The DHS difference is calculated as 2 × (
11)The interaction term
12)The 25th percentile of AIOE is -0.8537, the 75th percentile is 0.9342, hence 2.9280∙(0.9342−(−0.8537)) ≈ 5.2. The minimum AIOE is -1.6079 (KSCO 910, construction and mining labor) and the maximum AIOE is 1.4045 (KSCO 271, human resources and management professionals).
13)Following a referee’s suggestion, we also estimate the time variation in
14)
V. Conclusion
This study empirically analyzes the impact of AI exposure on employment and productivity in the industries of South Korea and the United States. In South Korea, key indicators that showed a statistically significant positive correlation with the AI exposure index were the number of employees, the number of female employees, the number of regular workers, and sales. Conversely, indicators showing a negative correlation included sales per capita, the labor share, and real labor income per capita. However, regression analysis controlling for labor productivity in industries revealed that the AI exposure index did not exhibit a statistically significant positive correlation with the number of employees, female employees, or regular workers. This result may align with prior studies suggesting that the adoption of AI enhances labor productivity, thereby increasing employment. Nonetheless, our analysis is based on data from 2019 to 2022, prior to the widespread adoption of generative AI. Given the potential time lag in realizing the effects of new technology adoption and productivity gains, the results cannot definitively confirm the labor productivity-enhancing effects of AI.
Unlike previous literature on occupational employment and AI exposure, our findings show that industry-level employment is positively correlated with AI exposure. We further examine occupational employment in South Korea and find that it is also positively correlated with AI exposure. The short-term increase in employment for occupations with high AI exposure may be driven by enhanced productivity through partial automation, the creation of new labor demand requiring human oversight, and the current limitations and costs of AI technology that delay full automation.
In the United States, industries with higher AI exposure exhibit a statistically significant positive relationship with employment, labor compensation, and hourly compensation. This suggests that AI-exposed industries in both South Korea and the U.S. experience employment growth. However, a key difference between the two countries is that, while labor compensation and hourly compensation are positively correlated with AI exposure in the U.S., real labor income per capita in South Korea show a negative correlation with the AI exposure index. Moreover, the AI exposure index demonstrated a statistically significant positive correlation with industrial employment even after controlling for labor productivity for the United States. In particular, the growth rate of employment and labor compensation are also significantly positively correlated with the AI exposure. This finding suggests that AI exposure directly impacts employment and wages, and U.S. industries are more influenced by AI compared to South Korea. However, our analysis relies on data from 2019 onward and we must consider the profound effects of COVID-19 on the U.S. labor market.
In summary, our findings indicate a short-term increase in employment within industries highly exposed to AI. In South Korea, we also observed growth in occupational employment. Labor market adjustments to AI will be shaped by various factors, including labor displacement, AI complementarity, and productivity gains (Cazzaniga et al., 2024). While AI has the potential to replace a substantial share of human labor, this displacement is likely to occur gradually. This slower transition provides policymakers with an opportunity to implement strategies that mitigate job losses through workforce retraining, social support systems, and incentives for businesses to adopt AI in ways that enhance rather than replace human labor (Svanberg et al., 2024).
Meanwhile, although there is growing interest in the economic effects of generative AI, sufficient data to specifically verify the effects beyond 2022 are not yet available. Therefore, it is important to note that the results of our study reflect the short-term impacts of AI and do not fully account for the implications of generative AI. The empirical investigation of the impact of generative AI across industries is left for future research.
Tables & Figures
Table 1.
South Korea 1-digit Industrial Indicators Summary Statistics
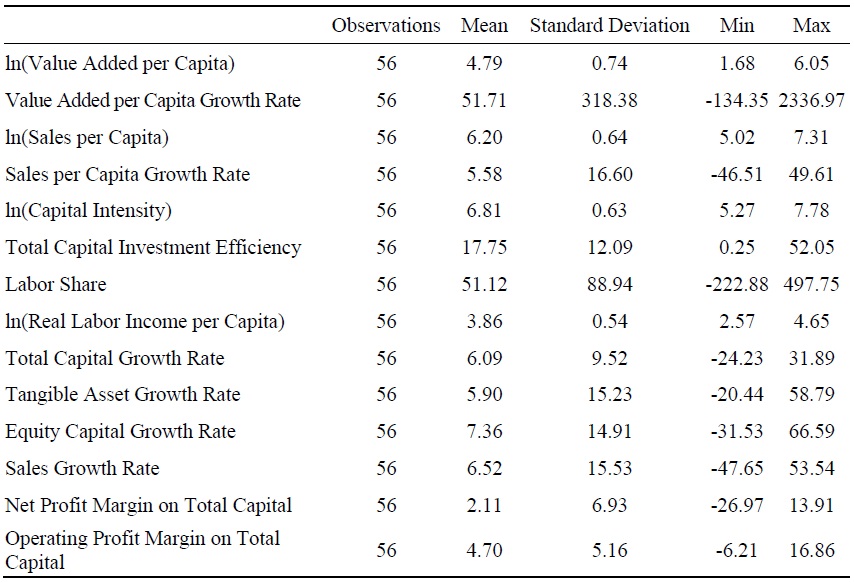
Notes: KSIC 1-digit 2019-2022 indicators. Data source is Korea Productivity Center “Analysis of added value of listed companies (value added creation & distribution indicators and growth & profitability indicators by 1-digit industries)” (
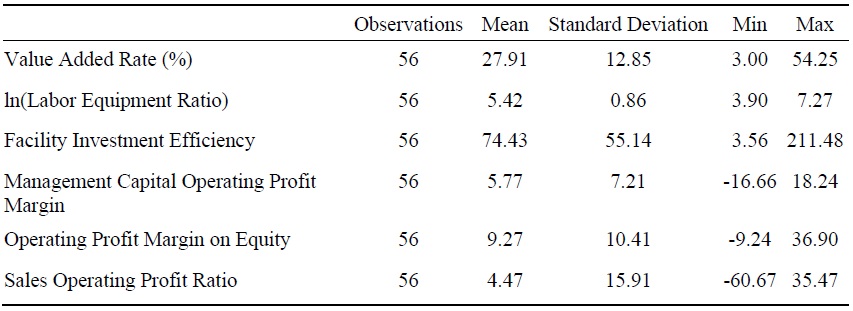
Table 2.
South Korea 2-digit Industrial Indicators Summary Statistics
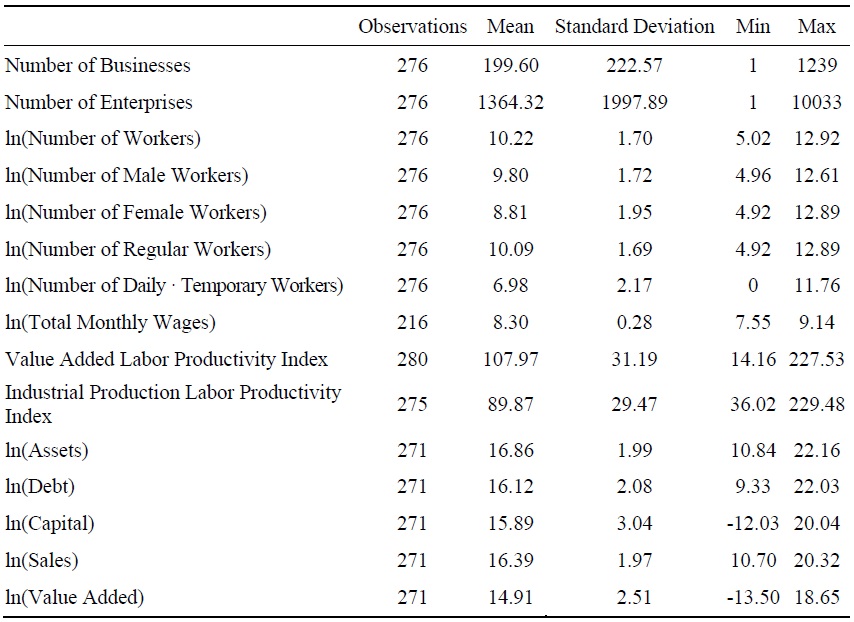
Notes: KSIC 2-digit 2019-2022 indicators. Logarithmic variables use signed log transformation. Total monthly wages, value- added labor productivity index, and industrial production labor productivity index are data from 2019-2023. Data source is Statistics Korea “Business Activity Survey” (
Table 3.
Relationship between Major Indicators by 1-digit Industries in South Korea and AI Exposure Index
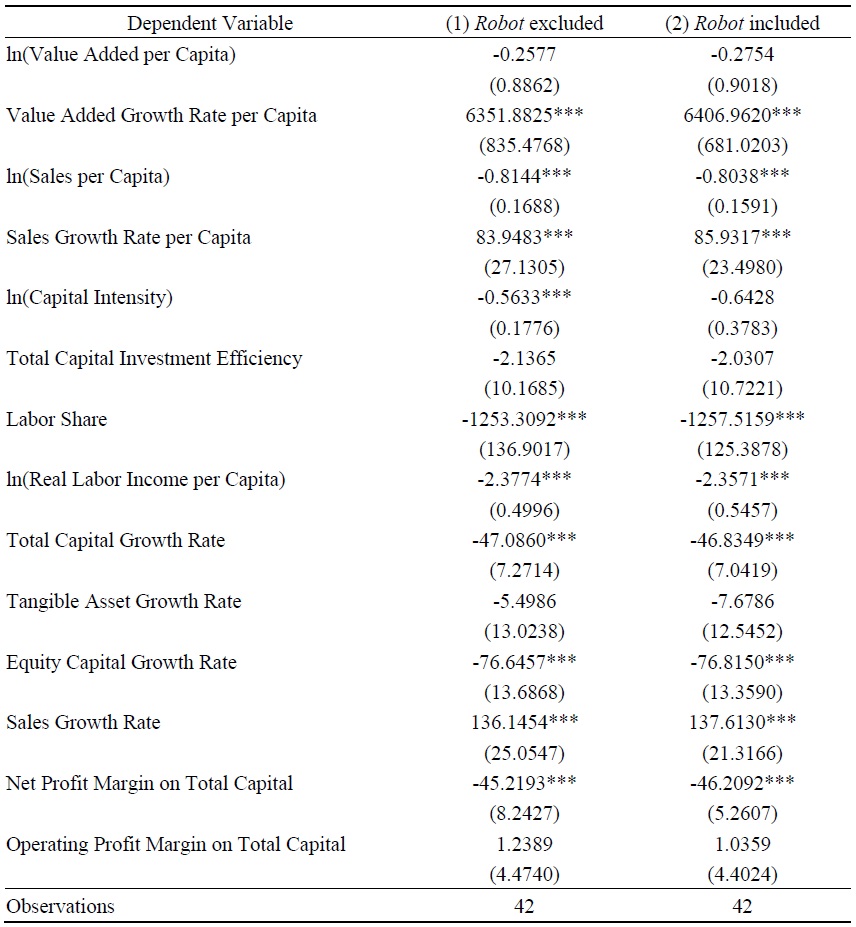
Notes: Robust standard errors in parentheses are clustered at the 1-digit industry level. *, **, and *** indicate significance at the 10%, 5%, and 1% significance levels, respectively.
Table 4.
Relationship between Major Indicators by 2-digit Industries in South Korea and AI Exposure Index
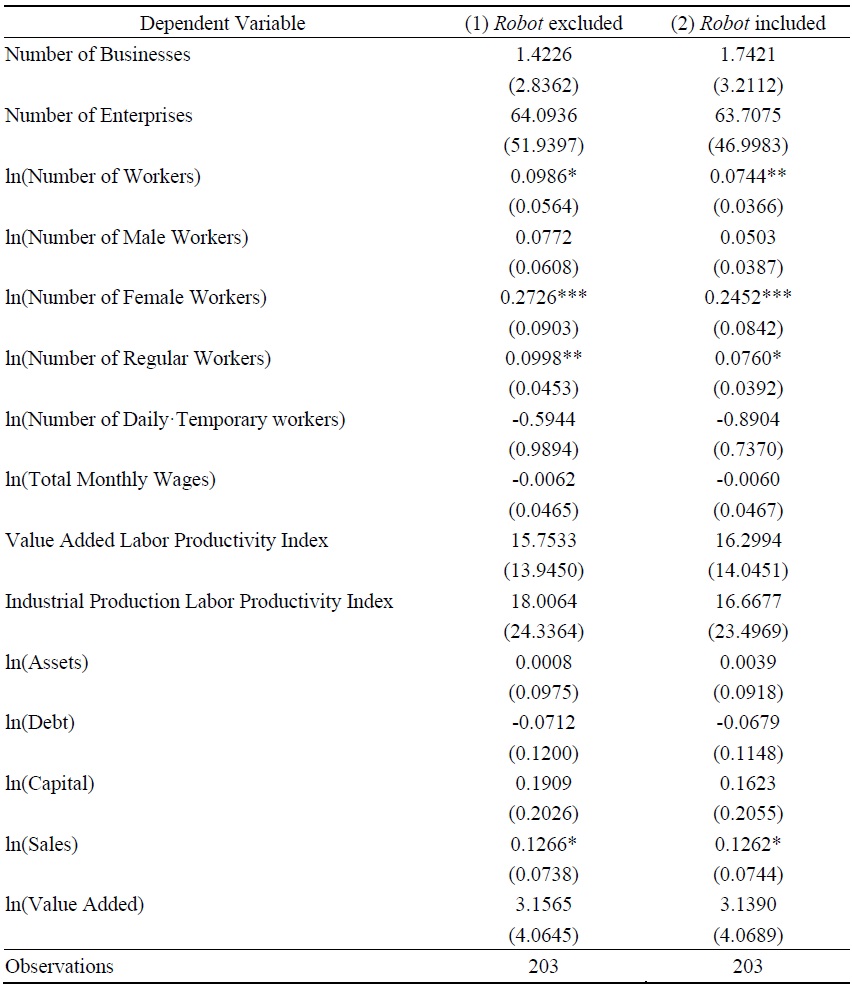
Notes: Robust standard errors in parentheses are clustered at the 2-digit industry level. *, **, and *** indicate significance at the 10%, 5%, and 1% significance levels, respectively.
Table 5.
Relationship between Industrial Employment Indicators in South Korea and AI Exposure Index
Notes: Signed log transformation used. Robust standard errors in parentheses are clustered at the 2-digit industry level. *, **, and *** indicate significance at the 10%, 5%, and 1% significance levels, respectively.
Table 6.
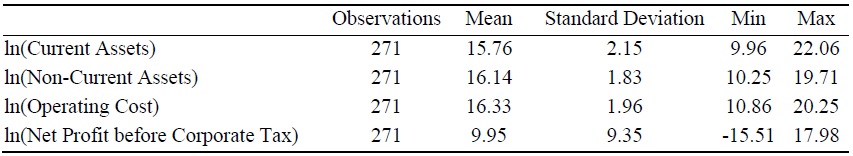
U.S. NAICS 4-digit Industry Indicators Summary Statistics
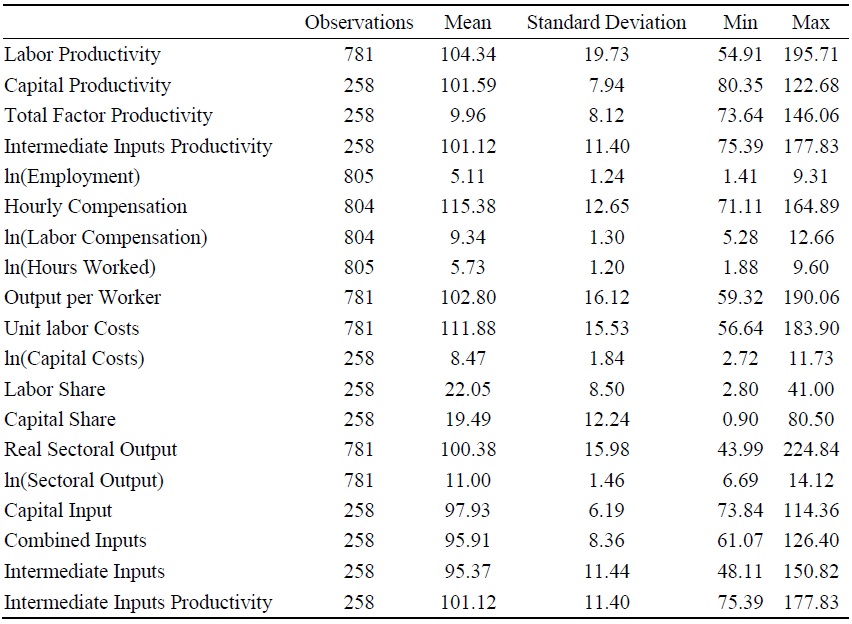
Notes: Data from 2019-2023, Bureau of Labor Statistics (BLS) (
Table 7.
Relationship between NAICS 4-digit Industry Indicators in U.S. and AI Exposure Index
Notes: The units of the variables that have not been log-transformed are Index (2017=100) or percentage. Robust standard errors in parentheses are clustered at the industry level. *, **, *** denote significance at the 10%, 5%, and 1% levels, respectively.
Table 8.
Relationship between Industry Employment Indicators in U.S. and AI Exposure Index
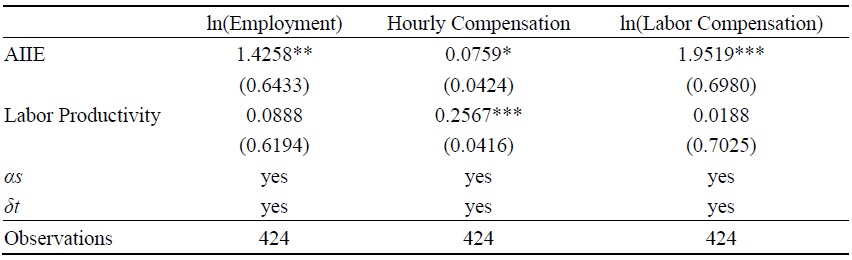
Notes: Signed log transformation is used. Robust standard errors in parentheses are clustered at the industry level. *, **, *** denote significance at the 10%, 5%, and 1% levels, respectively.
Table 9.
Relationship between Occupational Employment in South Korea and AI Exposure Index
Notes: Robust standard errors in parentheses are clustered at the industry level. *, **, *** denote significance at the 10%, 5%, and 1% levels, respectively.
APPENDIX
A.1. South Korea
A.2. U.S.
A.3. Details about Data and Indexes
This section describes the data and the construction of the AI Industrial Exposure (AIIE) for South Korea and the U.S. To construct the AIIE, the AI Occupational Exposure (AIOE) developed by Felten et al. (2021) was utilized for both countries.15 The AIOE can be used as a reference indicator to predict which occupations are expected to be most significantly affected by future advances in AI technology. A high AIIE indicates a greater employment share of workers in jobs with high AI exposure within that industry. Refer to the Appendix for the top and bottom industries of AIIE in South Korea and the United States for 2022.
A.3.1. South Korea
The AIOE of Felten et al. (2021) is based on the U.S. Standard Occupational Classification (SOC 2010) so it was converted to the Korean Standard Classification of Occupations (KSCO, 7th edition) in order to measure the South Korean AIOE.16
To generate the South Korean AIIE from 2019 to 2022, we utilize data from the South Korean AIOE and the Korean Labor & Income Panel Study (KLIPS).17 To address the issue of non-one-to-one matching between occupations and industries (i.e., when a single occupation belongs to multiple industries or multiple occupations belong to a single industry, resulting in a one-to-many relationship), the proportion of each occupation belonging to a specific industry was calculated to derive weights.18 These weights were then used to calculate a weighted average that converts the AIOE into AIIE.
The South Korean industry data mainly come from the Korea Productivity Center (KPC) and Statistics Korea (KOSIS), where the period starts from 2019 until 2022. Table 1 presents the South Korea 1-digit industrial indicators summary statistics for the value-added analysis of listed companies from the KPC. 19 The KPC indicators can be classified into value-added creation and distribution indicators, as well as growth and profitability indicators by industry. Table 3 uses the value-added creation & distribution indicators and the growth & profitability indicators by 1-digit industry.
Tables 2 and 5 data are from the KOSIS Business Activity Survey.20 Table 4 also shows variables by 2-digit industry using KOSIS data.21 The industrial robotic usage data in South Korea is sourced from the KOSIS Business Activity Survey, specifically the data on the development and utilization of Fourth Industrial Revolution technologies by 1-digit industry.22 Table 9 shows the variables from KLIPS.23
A.3.2. U.S.
Felten et al. (2021) used 2019 employment data to calculate the AIIE in the United States. In this study, we constructed an updated U.S. AIIE using the Occupational Employment and Wage Statistics (OEWS) from the U.S. Bureau of Labor Statistics (BLS) data from 2020 to 2022.24
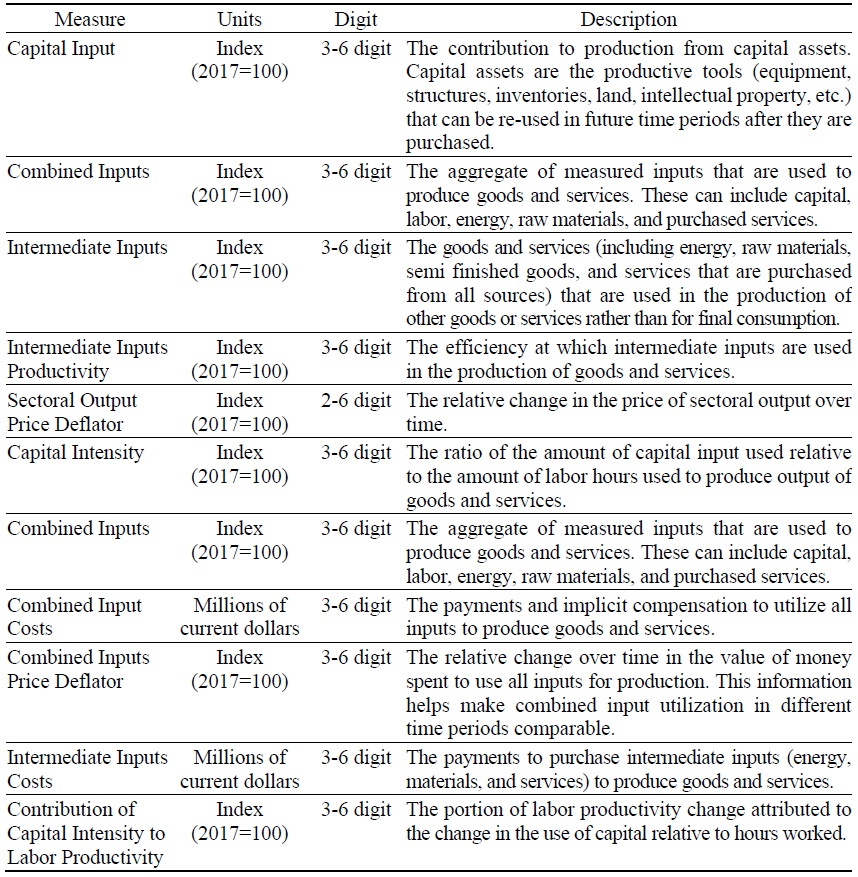
U.S. industrial indicators mainly come from BLS. The indicators in Tables 6 and 7 are from BLS OPT (U.S. Bureau of Labor Statistics, the Office of Productivity and Technology’s data series), where the period starts from 2019 until 2023. 25 This productivity data is available in quarterly or annual formats and is provided across three databases. The dataset includes Detailed Industry Productivity metrics (Labor, Total Factor, and State Labor), and the complete dataset was downloaded for use. It encompasses 27 variables and is classified by industry according to the NAICS at the 2-to 6-digit level.26 The industrial robotic usage data in U.S. is sourced from the National Center for Science and Engineering Statistics (NSF) Annual Business Survey: 2020.27
15)
16)The U.S. Standard Occupational Classification (SOC 2010, 6-digit) was converted to the International Standard Classification of Occupations (ISCO-08), and then further converted to the Korean Standard Classification of Occupations (KSCO, 7th edition, 3-digit). The conversion from SOC to ISCO was performed using data from the U.S. Bureau of Labor Statistics (BLS) (
17)The Occupational Classification Codes in the Korean Labor and Income Panel Study (KLIPS) are based on the Korean Standard Classification of Occupations (KSCO, 7th Edition) at the 3-digit level, while the industry classification codes are based on the Korean Standard Industrial Classification (KSIC, 10th Edition) at the 3-digit level. According to the KLIPS user guide (
18)Weights were derived separately for each level of industry classification: 1-3 digit.
19)
20)
21)
22)
23)
24)
25)
26)Variables: Capital costs, Capital input, Capital intensity, Capital productivity, Capital share, Combined input, Combined input costs, Combined input price deflator, Contribution of capital intensity to labor productivity, Contribution of intermediate inputs intensity to labor productivity, Employment, Hourly compensation, Hours worked, Intermediate input, Intermediated input costs, Intermediate input intensity, Intermediate inputs productivity, Intermediate inputs share, Labor compensation, Labor productivity, Labor share, Output per worker, Real sectoral output, Sectoral output, Sectoral output price deflator, Total factor productivity, Unit labor costs. Note that the units of the variables that have not been log-transformed are Index (2017=100) or percentage. All data is provided by the BLS as % Change from the previous year. Please refer to
27)
Appendix Tables & Figures
Figure A1.
South Korea KSIC 1-digit AIIE
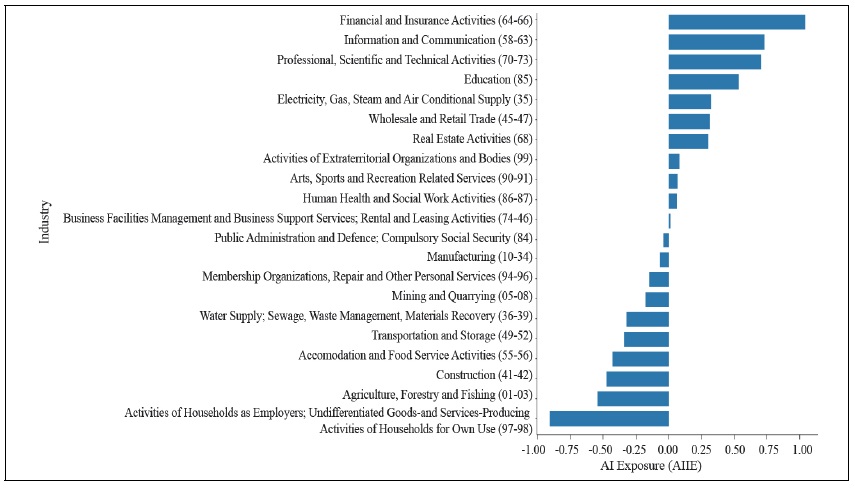
Table A1.
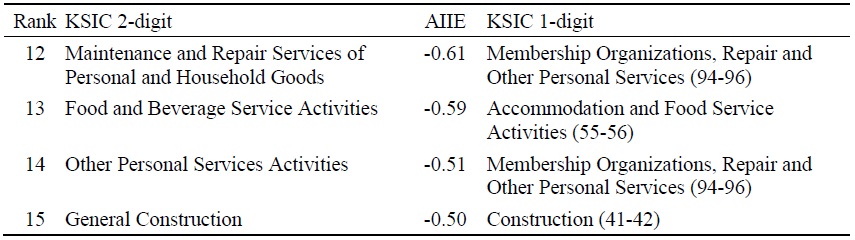
Top 15 South Korea AIIE
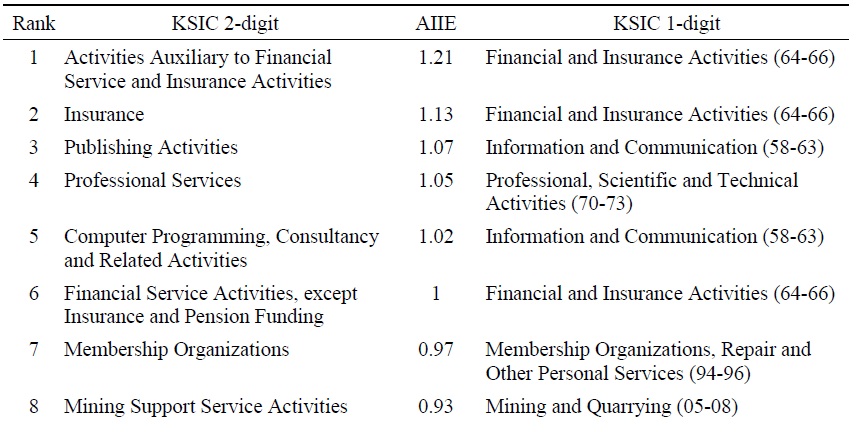
Table A1.
Continued
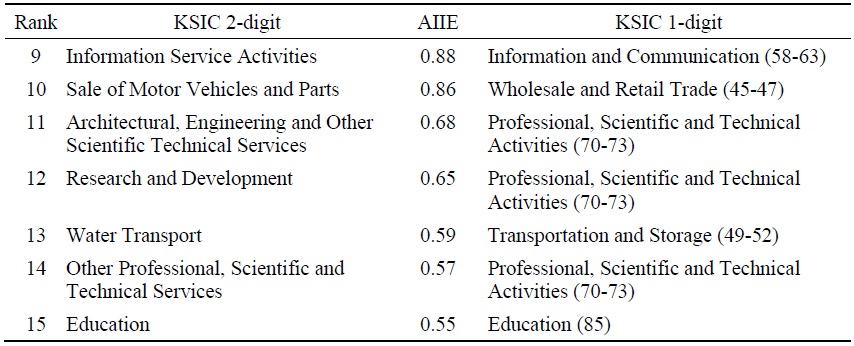
Notes: KSIC 2-digit AIIE values are author’s calculation. We conducted their analysis using the AIOE from
Table A2.
Bottom 15 South Korea AIIE
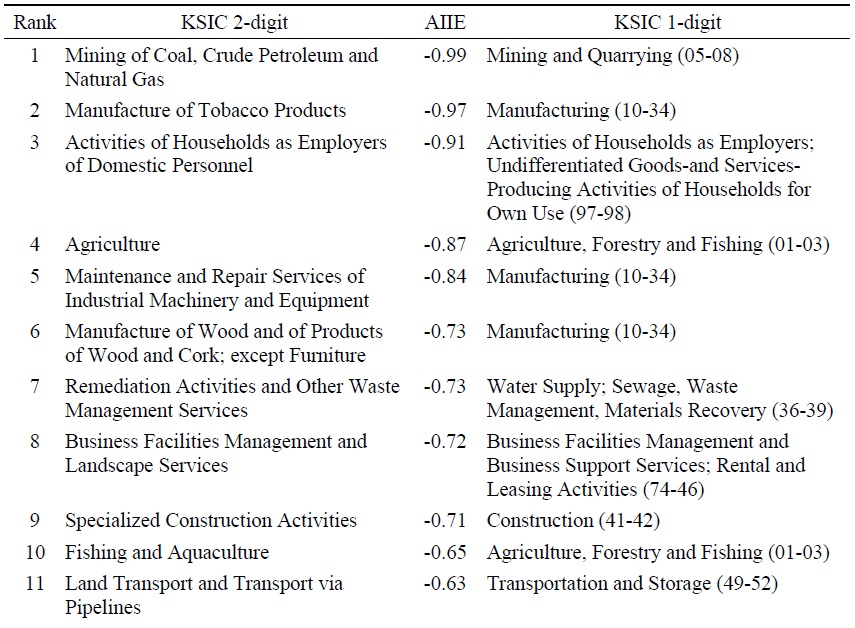
Table A2.
Continued
Notes: KSIC 2-digit AIIE values are author’s calculation. We conducted their analysis using the AIOE from
Table A3.
South Korea 1-digit Industrial Indicators Summary Statistics
Notes: KSIC 1-digit 2019-2022 indicators. Data source is Korea Productivity Center “Analysis of added value of listed companies (value added creation & distribution indicators, and growth & profitability indicators by 1-digit industries)” (
Table A4.
Relationship between major indicators in South Korea and AI exposure index
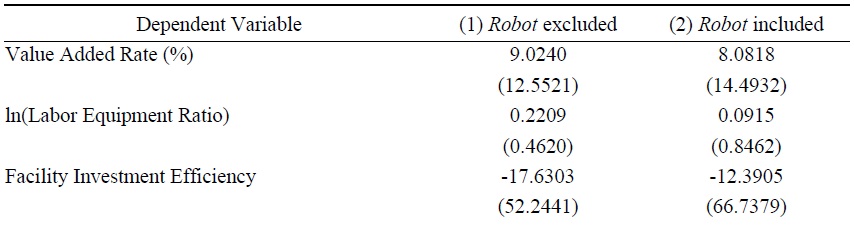
Table A4.
Continued
Notes: Robust standard errors in parentheses are clustered at the 1-digit industry level. *, **, and *** indicate significance at the 10%, 5%, and 1% significance levels, respectively.
Table A5.
South Korea 2-digit Industrial Indicators Summary Statistics
Notes: KSIC 2-digit 2019-2022 indicators. Logarithmic variables use signed log transformation. Total monthly wages, value- added labor productivity index, and industrial production labor productivity index are data from 2019-2023. Data source is Statistics Korea “Business Activity Survey” (
Table A6.
Relationship between Major Indicators by South Korea 2-digit Industry and AI Exposure Index
Notes: Robust standard errors in parentheses are clustered at the 2-digit industry level. *, **, and *** indicate significance at the 10%, 5%, and 1% significance levels, respectively.
Table A7.
Relationship between Major Indicators by South Korea 2-digit Industry and the Industrial Production Labor Productivity Index
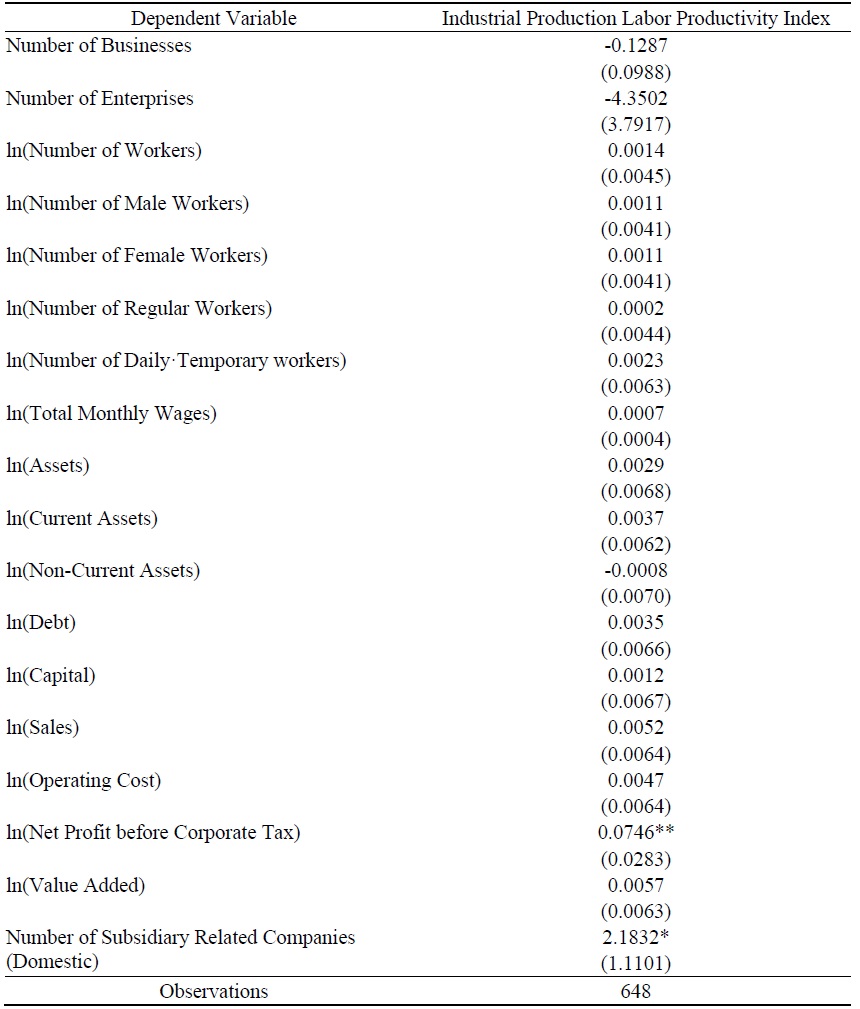
Notes: Robust standard errors in parentheses are clustered at the 2-digit industry level. *, **, and *** indicate significance at the 10%, 5%, and 1% significance levels, respectively. When the dependent variable is ln(Total Monthly Wage), the number of observations is 216.
Table A8.
Time-varying Relationship between One-year DHS Difference of Occupational Employment in South Korea and AI Exposure Index
Notes: Robust standard errors in parentheses are clustered at the industry level. *, **, *** denote significance at the 10%, 5%, and 1% levels, respectively.
Figure A2.
U.S. NAICS 2-digit AIIE
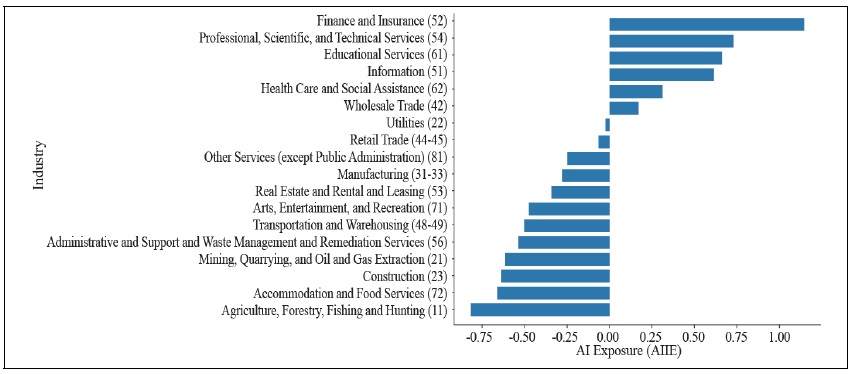
Table A9.
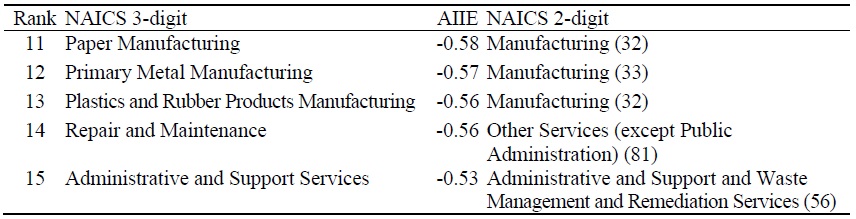
Top 15 U.S. AIIE
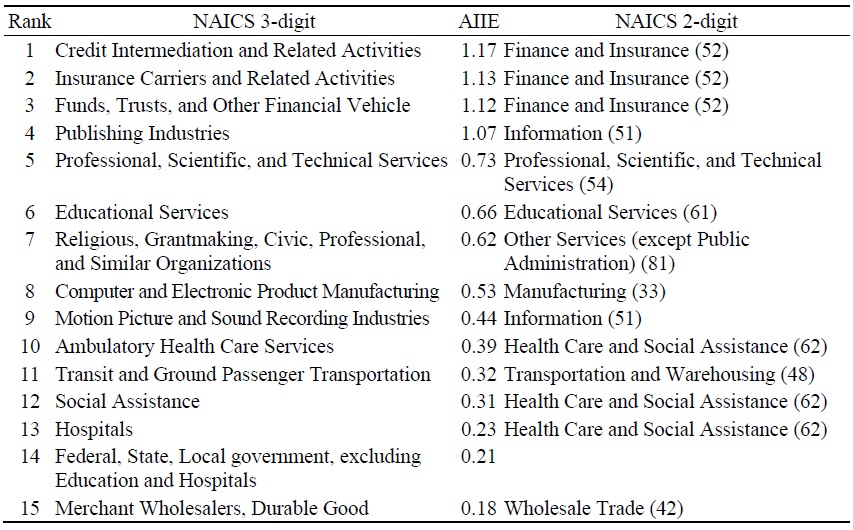
Notes: NAICS 3-digit AIIE values are author’s calculation. We conducted their analysis using the AIOE data from
Table A10.
Bottom 15 U.S. AIIE
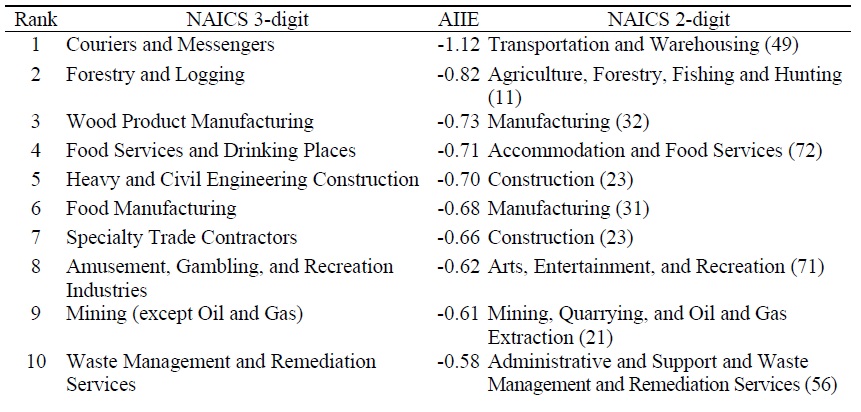
Table A10.
Continued
Notes: NAICS 3-digit AIIE values are author’s calculation. We conducted their analysis using the AIOE data from
Table A11.
Relationship between NAICS 4-digit Industry Indicators (first differences) in U.S. and AI Exposure Index (1)
Notes: Robust standard errors in parentheses are clustered at the industry level. *, **, *** denote significance at the 10%, 5%, and 1% levels, respectively.
Table A12.
Relationship between NAICS 4-digit Industry Indicators (first differences) in U.S. and AI Exposure Index (2)
Notes: Robust standard errors in parentheses are clustered at the industry level. *, **, *** denote significance at the 10%, 5%, and 1% levels, respectively.
Table A13.
U.S. NAICS 4-digit Industry Indicators Summary Statistics
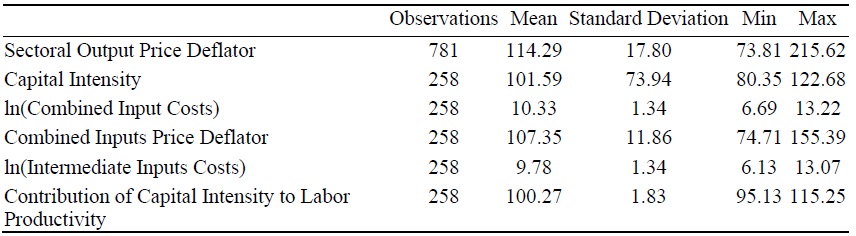
Notes: Data from 2019-2023, Bureau of Labor Statistics (BLS) (
Table A14.
Relationship between NAICS 4-digit Industry Indicators in U.S. and AI Exposure Index
Notes: The units of the variables that have not been log-transformed are Index (2017=100) or percentage. Robust standard errors in parentheses are clustered at the industry level. *, **, *** denote significance at the 10%, 5%, and 1% levels, respectively.
Table A15.
U.S. BLS Data
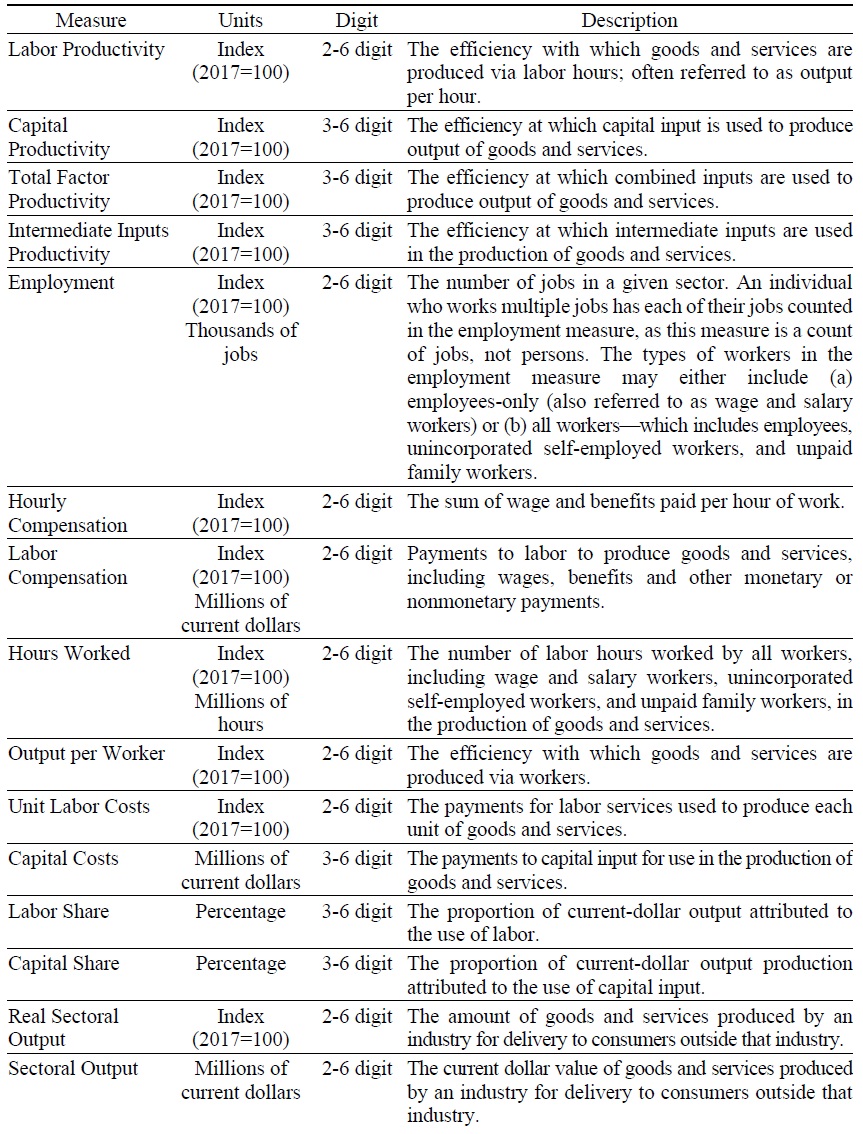
Table A15.
Continued
Notes: All measures have their converted values as % Change from previous year included in the data. Source from BLS (
References
-
Acemoglu, D., Autor, D., Hazell, J., and P. Restrepo. 2022. “Artificial intelligence and jobs: Evidence from online vacancies.”
Journal of Labor Economics , 40 (S1), S293-S340. - Autor, D. 2022. “The labor market impacts of technological change: From unbridled en- thusiasm to qualified optimism to vast uncertainty,” NBER Working Paper, no. 30074. National Bureau of Economic Research.
-
Babina, T., Fedyk, A., He, A., and J. Hodson. 2024. “Artificial intelligence, firm growth, and product innovation.”
Journal of Financial Economics , 151, 103745.
- Bonfiglioli, A., Crinò, R., Gancia, G., and I. Papadakis. 2023. “Artificial intelligence and jobs: Evidence from us commuting zones.” CESifo Working Paper, no. 10685.
-
Brynjolfsson, E., Mitchell, T., and D. Rock. 2018. “What can machines learn and what does it mean for occupations and the economy?”
AEA papers and proceedings , vol. 108, pp. 43-47. -
Brynjolfsson, E., Rock, D., and C. Syverson. 2019. “Artificial intelligence and the modern productivity paradox.”
The economics of artificial intelligence: An agenda , vol. 23, pp. 23-57. -
Cazzaniga, M., Jaumotte, M. F., Li, L., Melina, M. G., Panton, A. J., Pizzinelli, C., Rockall, E. J., and M. M. Tavares. 2024.
Gen-ai: Artificial intelligence and the future of work . International Monetary Fund. -
Chui, M., Hazan, E., Roberts, R., Singla, A., and K. Smaje. 2023.
The economic potential of generative AI . McKinsey&Company. -
Czarnitzki, D., Fernández, G. P., and C. Rammer. 2023. “Artificial intelligence and firm-level productivity.”
Journal of Economic Behavior & Organization , vol. 211, pp. 188-205.
-
Felten, E., Raj, M., and R. Seamans. 2018. “A method to link advances in artificial intelligence to occupational abilities.”
AEA Papers and Proceedings , vol. 108, pp. 54-57. -
Felten, E., Raj, M., and R. Seamans. 2021. “Occupational, industry, and geographic exposure to artificial intelligence: A novel dataset and its potential uses.”
Strategic Management Journal , vol. 42, no. 12, pp. 2195-2217. -
Frey, C. B. and M. A. Osborne. 2017. “The future of employment: How susceptible are jobs to computerisation?”
Technological forecasting and social change , vol. 114, pp. 254-280.
-
Georgieff, A. and R. Hyee. 2022. “Artificial intelligence and employment: New cross-country evidence.”
Frontiers in artificial intelligence , vol. 5, 832736.https://doi.org/10.3389/frai.2022.832736
-
Guliyev, H. 2023. “Artificial intelligence and unemployment in high-tech developed countries: New insights from dynamic panel data model.”
Research in Globalization , vol. 7, 100140.
-
Han, J. and S. Oh. 2023. “AI and the labor market.”
BOK Issue Note , no. 2023-30. -
Han, J. 2023. “The impact of Artificial Intelligence on the labor market and policy implications.”
Research Monograph , no. 2023-03. Korea Development Institute. -
Hatzius, J., Briggs, J. Kodnani, D., and G. Pierdomenico. 2023. “The potentially large effects of artificial intelligence on economic growth (briggs/kodnani).”
Economics Research , March, 2023. Goldman Sachs. -
Kim, S. 2024. “
The AI report (tech. rep.).” National Information Society Agency (NIA). -
Lane, M. 2024. “Algorithm and eve: How ai will impact women at work.” OECD
Policy Brief, December 6, 2024. Paris, France, OECD . -
Maslej, N., Fattorini, L., Perrault, R., Parli, V., Reuel, A., Brynjolfsson, E., Etchemendy, J., Ligett, K., Lyons, T., Manyika, J., Niebles, J. C., Shoham, Y., Wald, R., and J. Clark. 2024. Artificial Intelligence Index Report 2024. 10.48550/arXiv.2405.19522.
-
PwC S. 2024.
The current status of business using generative AI (tech. rep.). Samil PricewaterhouseCoopers (in Korean). -
Raj, M. and R. Seamans. 2019. “Primer on artificial intelligence and robotics.”
Journal of Organization Design , vol. 8, no. 11.https://doi.org/10.1186/s41469-019-0050-0 - Song, D., Cho, J., Choi, M., and H. Kim. 2021. “Artificial intelligence and firm productivity.” i-KIET Issues&Analysis, 2021-12. Korea Institute for Industrial Economics & Trade (KIET).
-
Svanberg, M., Li, W., Fleming, M., Goehring, B., and N. Thompson. 2024. “Beyond ai exposure: Which tasks are cost-effective to automate with computer vision?” Working Paper.
http://dx.doi.org/10.2139/ssrn.4700751 -
Tolan, S., Pesole, A., Martínez-Plumed, F., Fernández-Macías, E., Hernández-Orallo, J., and E. Gómez. 2021. “Measuring the occupational impact of ai: Tasks, cognitive abilities and ai benchmarks.”
Journal of Artificial Intelligence Research , vol. 71, pp. 191-236.
-
Webb, M. 2019. “The impact of artificial intelligence on the labor market.”
http://dx.doi.org/10.2139/ssrn.3482150 -
Yoon, S.-H., Yoon, J. E., Cho, S., Lee, J., Baek, Y., and N. S. Son. 2024.
Investment in intangible assets and economic growth: Global trends and policy implications . Korea Institute for International Economic Policy. -
Zarifhonarvar, A. 2024. “Economics of ChatGPT: A labor market view on the occupational impact of artificial intelligence.”
Journal of Electronic Business & Digital Economics , vol. 3, no. 2, pp. 100-116.