

- EAER>
- Journal Archive>
- Contents>
- articleView
Contents
Citation
| No | Title |
|---|
Article View
East Asian Economic Review Vol. 29, No. 1, 2025. pp. 77-104.
DOI https://dx.doi.org/10.11644/KIEP.EAER.2025.29.1.445
Number of citation : 0View
52
Download
41
The Heterogeneous Effects of Trade Facilitation on Trade in Intermediate Goods: The Case of Korea, China, and Japan
|
|
Kyung Hee University |
|---|---|
|
|
Kyung Hee University |

Abstract
This paper empirically examines the impact of trade facilitation on the trade of intermediate goods in Korea, China, and Japan, along with their trading partner countries, during the period from 2008 to 2017. We particularly focus on the distinct roles of hard and soft environments in trade facilitation. Trade facilitation levels are quantified using principal component analysis, and regression analyses are conducted using the two-way fixed-effects model and the Arellano-Bond estimator. The regression results indicate that overall trade facilitation has the greatest positive impact on Korea’s trade in intermediate goods. The hard environment significantly drives China’s trade growth in intermediate goods, while the soft environment exerts the most substantial influence on Japan’s trade growth in intermediate goods. These findings provide policy implications for regional cooperation and the enhancement of global value chains (GVCs) among Korea, China, and Japan.
JEL Classification: F14, F15, F61
Keywords
Trade Facilitation, Intermediate Goods Trade, Global Value Chain
I. Introduction
Trade in intermediate goods refers to the exchange of components, raw materials, and semi-finished products used in the production process. These goods serve as inputs in the manufacturing of final consumer goods or finished products. Trade in intermediate goods is crucial in global value chains (GVCs), highlighting the integration and interdependence of production networks across different countries. The United Nations Commodity Trade Statistics Database (UN COMTRADE) database indicates that trade in intermediate goods has become the dominant form of global trade, comprising 60% of goods and 70% of services. Additionally, the World Input-Output Database (WIOD) statistics show that from 2000 to 2014, the proportion of intermediate goods in total global trade increased from 59.92% to 64.4%. This proportion is similarly applicable to the trade conducted by Korea, China, and Japan. As key trading powers in the Asia-Pacific region, Korea, China, and Japan are collectively projected to achieve a total economic volume of $23.76 trillion in 2023, representing 59.36% of the region’s economy. The share of total trade in intermediate good was approximately 75% for Korea, 64% for China, and 74% for Japan in 2023. Over the years, countries worldwide have made significant efforts to promote trade in both final and intermediate goods by reducing tariffs, led by the World Trade Organization (WTO) and regional economic cooperation. However, factors such as transaction costs, non-tariff barriers continue to hinder trade growth in both categories (Mao and Yang, 2015).
Meanwhile, the average participation rate in GVCs had exceeded 50 percent by 2010, positioning them as a crucial form of international division of production (UNCTAD, 2013). The development of GVCs has made trade in intermediate goods the dominant form of global trade. GVCs demand efficient supply chain management, making trade facilitation essential for enhancing trade in intermediate goods and maintaining smooth value chain operations.1 Advancements in trade facilitation are closely aligned with the deepening of the division of production within GVCs (Diakantoni et al., 2017). Consequently, trade facilitation has long been a key concern of the WTO in the development of GVCs, and there is extensive academic research on this topic (Beverelli et al., 2023). However, research and international trade rules still predominantly focus on final goods and have not fully adapted to changes in trade dynamics, particularly concerning trade facilitation issues.
Research on trade facilitation and international trade typically focuses on two main areas. First, it involves constructing the level of trade facilitation using methods such as the principal component analysis or the entropy method (Kong and Dong, 2015; Toševska-Trpčevska and Tevdovski, 2016). Second, it analyzes the effects of trade facilitation, which include increasing trade gains, promoting economic development, enhancing participation in GVCs, and improving firms’ export value-added by reducing costs and enhancing supply chain efficiency (Shepherd and Wilson, 2009; Duan and Jing, 2021). While research on trade facilitation is abundant, several gaps remain. First, the measurement indicator system requires further development, with many studies relying on a single data source, such as the Global Competitiveness Report. Second, most research emphasizes total exports, with fewer studies examining the impact of trade facilitation on trade in intermediate goods, especially for East Asian countries. Third, most studies focus on international organizations or specific countries, like those involved in the Belt and Road initiative, RCEP, or G20 members, and often lack a comprehensive perspective on Korea, China, and Japan. Additionally, previous studies frequently target entire regions or employ simple geographic divisions, which overlook the significant heterogeneity between Korea, China, and Japan. There is a need to explore the non-linear relationship between trade facilitation and trade in intermediate goods within these countries.
To fill these gaps, this paper constructs a more systematic measurement indicator system to analyze the level of trade facilitation in Korea, China, and Japan, as well as their 42 trading partner countries, from 2008 to 2017. By utilizing indicators from various perspectives and expanding the gravity model, this paper focuses on the relationship between trade facilitation, its sub-indicators such as the hard and soft environments, and the trade in intermediate goods involving Korea, China, and Japan. The hard environment includes physical infrastructure, customs procedures, and logistics systems, allowing for a comparison of logistical efficiency and infrastructure quality across countries, which is crucial for assessing national competitiveness. The soft environment encompasses institutional frameworks, regulatory efficiency, and administrative transparency, offering a deeper understanding of how institutional settings affect trade in intermediate goods. The main contribution of this study lies in analyzing the effects of trade facilitation on intermediate goods trade among Korea, China, and Japan by categorizing and comparing it into soft and hard environments. Through this analysis, we aim to provide effective insights into trade facilitation strategies for both developing and developed countries.
This paper is structured as follows. Section 2 summarizes previous research and describes the contribution of this paper. Section 3 introduces the methods for measuring the trade facilitation index, along with the econometric specifications and data sources. Section 4 presents the empirical results and provides the rationale and interpretation of these results. Finally, Section 5 offers conclusions and policy implications.
1)Although international organizations such as the WTO, World Customs Organization (WCO), and World Bank (WB) have provided definitions of trade facilitation, a uniform definition has not yet been established. Previous studies typically build upon the framework proposed by
II. Literature Review and Contribution
1. Previous Studies
Numerous empirical studies have found that trade facilitation reduces export and import costs, thereby promoting bilateral trade between countries (Botelho et al., 2021). As a representative study, Wilson et al. (2005) found that global trade could increase by $377 billion if the trade facilitation levels of countries below the global average were elevated to the world average during the 2000-2001 period for 75 countries. They also discovered that these positive effects were more significant for exports to OECD markets. Porto et al. (2015) considered 72 countries during the 2011-2012 period and found that trade facilitation measures improved their trade performance, particularly in their authorized economic operator and single-window programs. Cheng and Yang (2022) found that trade facilitation extended the export duration of Chinese firms by reducing prices and increasing the variety of imported intermediates during the 2007-2013 period. They also observed that these positive effects were more pronounced for firms located in the western region of China and for key products. Beverelli et al. (2023) examined the post-implementation impact of the WTO Trade Facilitation Agreement (TFA) using a structural gravity model. They found that the agreement increased total trade by 1.17% and real income by 0.12% worldwide.
Meanwhile, several studies have focused on the differing effects of trade facilitation on trade in intermediate goods compared to final goods. In GVCs, high fragmentation costs can impede the effective allocation of production stages across countries based on their comparative advantages. Trade in intermediate goods can proceed smoothly when these costs are sufficiently reduced (Baldwin and Venables, 2013). An increase in trade facilitation can reduce production fragmentation costs, thereby promoting the international division of production resources and increasing bilateral trade in intermediate goods. This improvement better integrates countries into international production supply chains and ultimately contributes to the overall growth of trade and foreign direct investment (FDI) (Engman 2005). Qin and Guo (2024) found that, due to the different production stages involved in intermediate and final goods, intermediate goods trade is more influenced by trade facilitation, while final goods trade is more affected by production costs. Similarly, Zheng and Han (2022) discovered that, due to the division of labor in GVCs and the vertical specialization production model of member countries, trade facilitation has a stronger impact on promoting intermediate goods trade than on final goods trade. Additionally, Dong and Kong (2021) noted that trade facilitation primarily boosts value-added exports through intermediate goods trade, but is less beneficial for the value-added exports of final goods.
When examining the impact of trade facilitation on the trade of intermediate goods in Korea, China, and Japan, few studies have contributed valuable insights. Jang and Cho (2015) studied eight countries with which Korea has concluded Free Trade Agreements (FTAs) and found that these agreements significantly boosted Korea’s imports of intermediate goods. Xu (2016) used the gravity model to analyze trade among Korea, China, and Japan and predicted that the establishment of the Korea-China-Japan FTA, along with cultural exchange, could be highly effective in promoting the development of a trilateral free trade zone, particularly within the context of GVCs. Li (2018) examined the impact of trade facilitation on the trade of manufactured goods among Korea, China, and Japan by constructing a gravity model. The study found that improvements in trade facilitation positively impacted trade flows between China and Japan, as well as China and Korea. It highlights the significant influence of customs environments, port facilities, and regulatory conditions on trade. Li (2021) further found that, compared to European countries, improvements in trade facilitation in Asian and African countries more effectively promote China’s imports of final consumer goods.
2. Contribution of the Paper
Compared to existing literature, this paper seeks to contribute in several key areas. First, it expands the research perspective by exploring the impact of trade facilitation on the trade of intermediate goods in Korea, China, and Japan, considering both export and import viewpoints. Additionally, the paper examines the heterogeneity of trade facilitation’s effects on intermediate goods trade in Korea, China, and Japan from multiple angles, thereby enriching the research. Despite their significant economic status in the Asia-Pacific region, research on the determinants of intermediate goods trade in Korea, China, and Japan has been relatively insufficient. In particular, there appears to be a lack of rigorous analysis on how the level of trade facilitation in these countries and their trading partners has affected their trade in intermediate goods.
Second, this paper constructs detailed indicators by developing sub-indicators of trade facilitation from various perspectives, examining their specific impacts in different countries, and aiming to uncover their underlying effects on value chain trade. In this context, this paper explores the non-linear impact of the hard and soft environments of trade facilitation on trade in intermediate goods. By analyzing their marginal effects, this paper reveals that the impact of these environments on trade in intermediate goods varies, depending on the degree of participation in GVCs and the level of international competitiveness among Korea, China, and Japan. The empirical results of the paper help countries identify areas for improvement in physical infrastructure and institutional environments, providing practical insights for policy formulation.
Consequently, this research on intermediate goods trade in Korea, China, and Japan provides insights into the structure of GVCs and the economic integration of the East Asian region, highlighting the interdependencies among Korea, China, and Japan. By analyzing the role of trade facilitation and its sub-indicators on intermediate goods trade patterns, the paper aids in understanding the economic development stages and industrial structures, helping to identify each country's comparative advantages and structural shifts. As a result, this paper supports trade policy and negotiations by offering empirical evidence crucial for non-tariff measures and trade agreements. Additionally, it assists in devising strategies to enhance the stability of supply chains, particularly in response to global disruptions.
III. Econometric Methodologies
1. Measurement of Trade Facilit
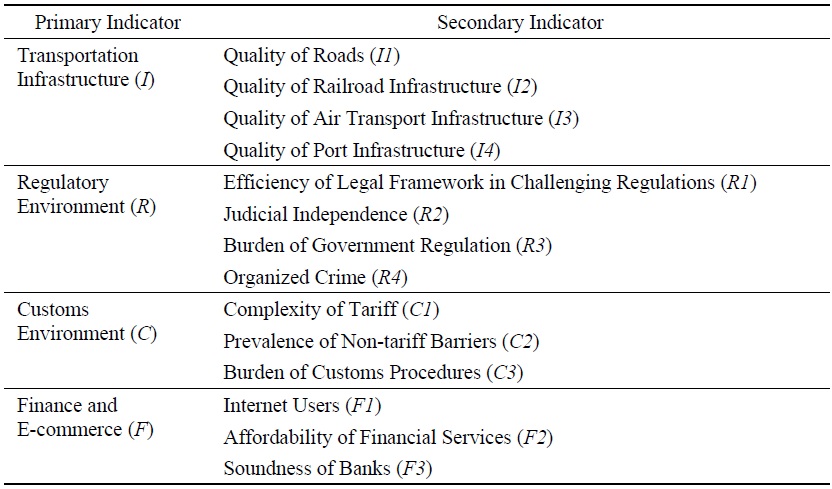
Following the framework of Wilson et al. (2003) and utilizing the data from the Global Competitiveness Report (GCR) by the World Economic Forum and the Logistics Performance Index (LPI) by the World Bank, we select four primary indicators: infrastructure (
To measure the average level of comprehensive trade facilitation by country, we selected principal component analysis (PCA) among common methods such as the arithmetic average method and the entropy method (Liu et al., 2018). PCA is a statistical technique used to reduce the dimensionality of data while retaining as much variability as possible, thereby simplifying analysis or improve visualization (Jolliffe, 2002). This method is advantageous because it can extract key information from highly correlated indicators, ensuring both the explanatory power and independence of the indicators.
We considered the following five stages in the process of PCA. First, we standardized the secondary indicators because they have values in different ranges from various data sources. The standardization formula involves subtracting the maximum value from the actual value and then dividing by the difference between the maximum and minimum values within the range of the corresponding original data. This standardization helps eliminate the influence of differing magnitudes between indicators. Second, we calculated the covariance matrix using standardized data, which helps in understanding the variability of the data and the correlations between variables. Considering the Kaiser-Meyer-Olkin (KMO) measure and Bartlett’s test of sphericity, the test rests suggest that the sample is appropriate for the application of PCA. The KMO value is 0.897, which is greater than 0.7. The significance level of Bartlett’s test is 0.000, which is less than 0.05.
Third, we performed eigenvalue decomposition on the covariance matrix to obtain the eigenvalues and eigenvectors. The eigenvalues represent the importance of the principal components, while the eigenvectors indicate the direction of the principal components. Then, we selected the eigenvectors corresponding to the largest eigenvalues. These eigenvectors form the principal components, representing the directions that explain the most variability in the data. We extracted three principal components, each with corresponding eigenvalue greater than 1, and their cumulative contribution rate reaches 82.45%. Fourth, we calculated the square roots of the corresponding eigenvalues for the three principal components. Then, we divided the initial component loadings of each secondary indicator by the square roots of their corresponding eigenvalues to obtain standardized principal component coefficients. Fifth, each principal component’s contribution was weighted by the variance explained ratio and their weighted sum was used to derive the composite score.
Consequently, we obtain a comprehensive assessment equation for the level of trade facilitation as follows:

where each variable (
2. Econometric Equation and Data Source
Based on a gravity model, we build up the following equation to empirically examine the effects of trade facilitation on the trade in intermediate goods of Korea, China, and Japan with trading partner countries3 during the 2008-2017 period.4

where
As the dependent variable,
We also include other control variables such as the GDP of each country (
In addition to the empirical analysis of the entire sample, we conduct empirical analyses on several sub-samples as follows. First, we divide the sample into three groups based on
In Table 1, transportation infrastructure (
The two-way fixed-effects model is used as the main regression. We conduct two F-tests and the Hausman test to determine whether the two-way fixed-effects model is superior to the pooled OLS and the random-effects model, respectively. To address the endogeneity problem in the main regressions, we consider using the Arellano-Bond estimator as a robustness test.5 To verify the validity of the system GMM in the Arellano-Bond estimator, we conduct the Arellano-Bond test for AR(1) and AR(2) to assess the first-order autocorrelation of the dependent variable. Additionally, we performed the Hansen test to check for the over-identification problem of the instrument variables.
3. Summary Statistics
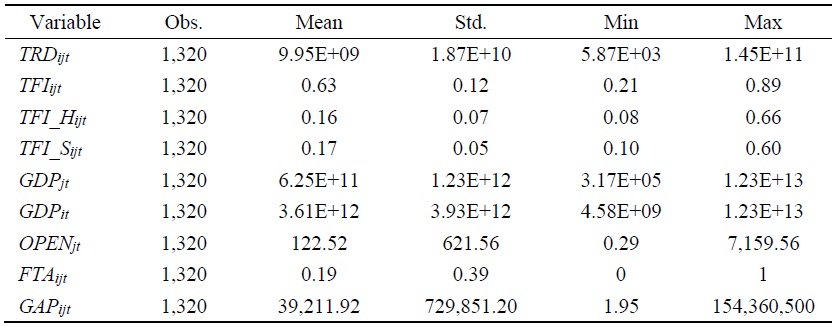
Table 2 presents the mean, standard deviation, minimum, and maximum values of each variable, based on a total of 1,320 observations. The data indicate that trade in intermediate goods, the overall GDP of China Korea and Japan, the GDP and openness of trading partner countries, and the economic gap between countries vary significantly. This is evidenced by the large standard deviations, which reflect a high degree of unevenness in the size of the global economy. This is why these variables should be log-transformed in the regression analysis.
We also estimate the correlation coefficients between the variables to check for significant multicollinearity problems in the regression analysis. The results show that the correlation coefficients among
2)The data on the quality of port infrastructure is derived from LPI, while the other 13 secondary indicators are derived from GCR.
3)The WIOD database just includes 43 countries including Korea, China, and Japan. These trading partner countries are heavily involved in intermediate goods trade with Korea, China, and Japan, accounting for more than 70% of their total intermediate goods trade. The estimation results explicitly include bilateral trade flows among Korea, China, and Japan.
4)The GCR, one of our main data sources, applied a different estimation methodology starting in 2018, which altered the scale of the data values. Therefore, we limited the research period to up until 2017 to maintain data consistency.
5)The Arellano-Bond estimator is a commonly used estimation method in dynamic panel data analysis to address endogeneity issues. It primarily uses first differencing to eliminate fixed effects which represent the time-invariant characteristics of individual units. To address endogeneity, it uses lag values of endogenous variables as instrument variables and the Generalized Method of Moments (GMM) for estimation, which enhances the efficiency of the estimator through the appropriate selection of instrument variables
IV. Empirical Results
1. Main Results
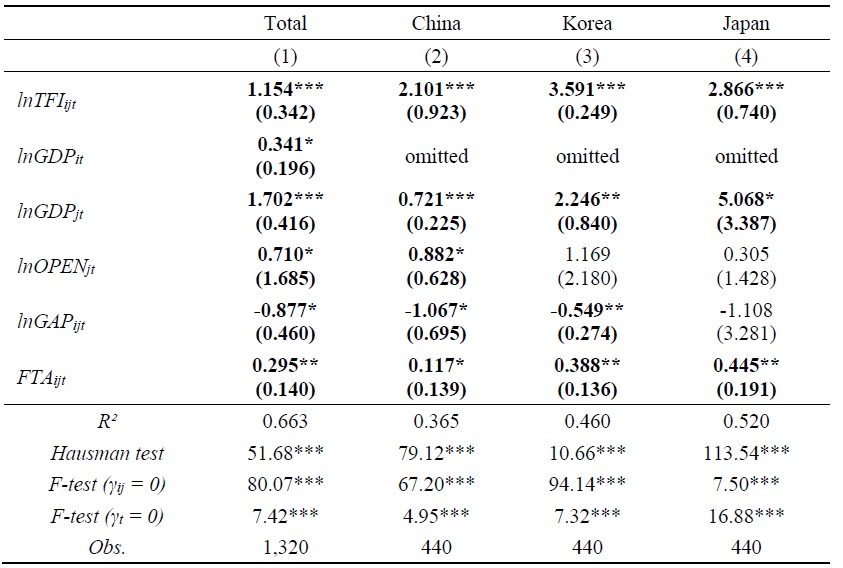
Table 3 presents the empirical results from the two-way fixed-effects model, which serves as the main regression analysis. Column (1) displays the results from the total sample, while columns (2), (3), and (4) present the results for three groups based on
The results in column (1) of Table 3 show that trade facilitation significantly enhanced trade in intermediate goods, with an overall coefficient of 1.154, at the 1% significance level. In columns (2) to (4), the results show that trade facilitation positively impacted trade in intermediate goods for Korea, China, and Japan, respectively, all at the 1% significance level. This suggests that for every 1% improvement in trade facilitation, the volume of trade in intermediate goods between Korea, China, and Japan and their trading partner countries increased by approximately 1.154%. When comparing among the three countries, Korea benefited the most from trade facilitation, with a coefficient of 3.591, followed by Japan with 2.866, and China with 2.101, all significant at the 1% level.
The GDP of the three countries had a significant positive effect on trade in intermediate goods, with a coefficient of 0.341 at the 10% significance level. Similarly, the GDP of trading partner countries significantly contributed to trade flows and the effect varied across different countries. Trading partner’s openness positively affected overall trade in intermediates, with a coefficient of 0.710 at the 10% significance level. However, only China benefited significantly, with a coefficient of 0.882 at the 10% significance level, while the impact on Japan and Korea was insignificant. The economic gap significantly inhibited trade in intermediate goods, with an overall coefficient of -0.877 at the 10% significance level. This effect was particularly strong for China, with a coefficient of -1.067 at the 1% significance level, and for Korea, with a coefficient of -0.549 at the 5% significance level. These results are consistent with the arguments presented by Hu and Qiu (2024). In contrast, Japan experienced no significant impact. FTAs positively affected overall trade in intermediate goods, with a coefficient of 0.295 at the 5% significance level. Both Korea and Japan exhibited significant effects, with coefficients of 0.445 and 0.388 at the 5% significance level, respectively. China also showed a significant but smaller effect, with a coefficient of 0.117 at the 10% significance level.
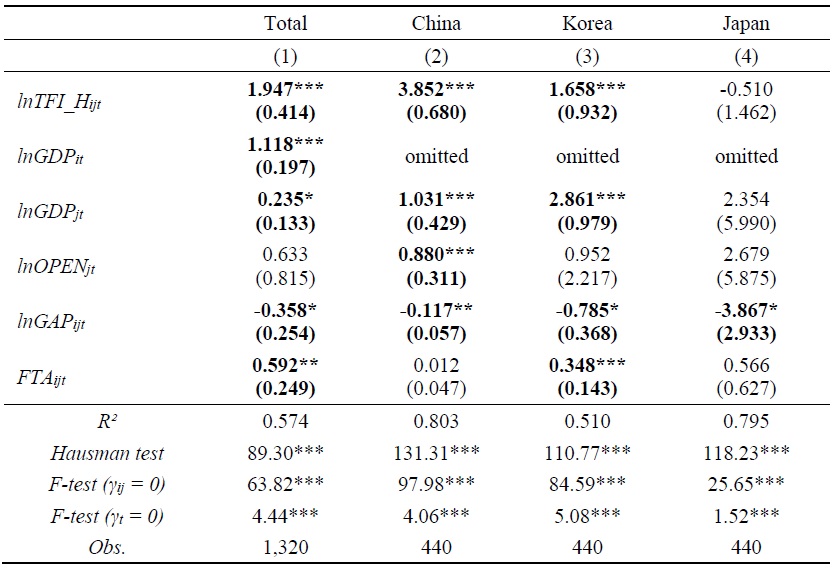
Table 4 presents the empirical results from the two-way fixed-effects model, with the hard environment of trade facilitation considered as a key independent variable. The description for each column is the same as in Table 3. In all columns,
As in Table 3, the GDP of the three countries significantly boosted trade in intermediate goods, with a coefficient of 1.118 at the 1% significance level, in Table 4. However, compared to Table 3, several independent variables in Table 5 gained or lost their statistical significance. The GDP of trading partner countries had a significant positive effect on the total sample, as well as China and Korea, with coefficients of 0.235, 1.031, and 2.861 at the 1% or 10% significance level, respectively, but had no effect on Japan. Trading partner’s openness had a significant positive effect only on China. The economic gap had a significant negative effect on the total sample, with a coefficient of -0.358 at the10% significance level, as well as on all three countries individually, suggesting that widening disparities inhibited trade in intermediate goods. FTAs promoted trade in intermediate goods overall, with a coefficient of 0.592 at the 5% significance level. Korea benefited the most, with a coefficient of 0.348 at the 1% significance level, while China and Japan experienced insignificant effects.
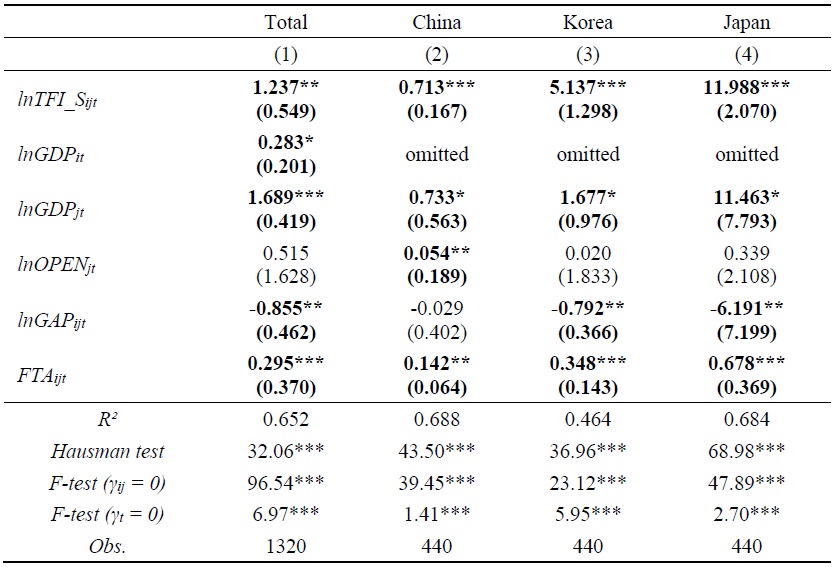
Table 5 presents the empirical results from the two-way fixed-effects model, with the soft environment of trade facilitation considered as a key independent variable. The description for each column is the same as in Tables 3 and 4. In all columns, F-tests and the Hausman test indicate that the two-way fixed-effects model is appropriate. The results in Table 5 indicate that the soft environment of trade facilitation significantly impacted trade in intermediate goods, with an overall coefficient of 1.237 at the 5% significance level. This suggests that for every 1% improvement in the soft environment of trade facilitation, the volume of trade in intermediate goods between Korea, China, and Japan and their trading partner countries increased by approximately 1.237%. In the sub-country analysis, Japan recorded the highest coefficient at 11.988, followed by Korea at 5.137 and China at 0.713, all significant at the 1% level.
As shown in Tables 3 and 4, the GDP of Korea, China, and Japan significantly promoted trade in intermediate goods, with an overall coefficient of 0.283 at the 10% significance level in Table 5. Additionally, the openness of trading partner countries had a minor positive effect on China alone. FTAs exerted a significant positive effect on trade in intermediate goods both overall, as well as for Korea, China, and Japan, highlighting FTAs as a crucial strategy for promoting such trade. As in Table 3, the GDP of trading partner countries had a significant positive effect overall and for each country, with Japan demonstrating the strongest influence in Table 5. However, the results for the economic gap in Table 5 differ somewhat from those in Tables 3 and 4. The economic gap had an overall negative effect, significantly dampening Japan's and Korea's respective trade in intermediate goods, but not China’s.
2. Robustness Check
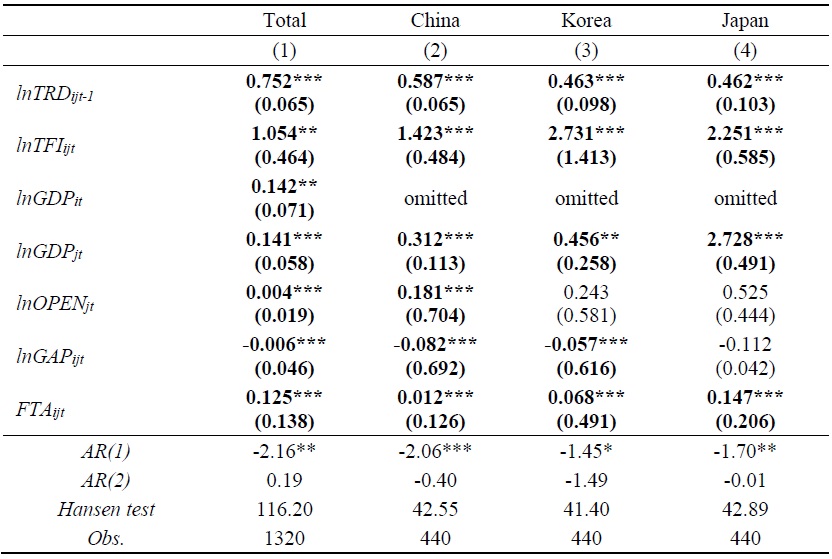
Table 6 presents the empirical results from the Arellano-Bond estimator, serving as a robustness check for the findings in Table 3. The description for each column is the same as in Table 3. In all columns, the Hansen test indicates no significant statistics for the overall sample and the three countries, indicating that the instrumental variables are valid and the endogeneity problem is not severe. The Arellano-Bond test results show that the p-value of the AR(1) test for the overall sample, as well as for Korea, China, and Japan, is less than 0.1, indicating first-order autocorrelation. Meanwhile, the p-value of the AR(2) test is greater than 0.1, confirming the absence of second-order autocorrelation, thereby verifying the validity of the system GMM model. Comparing the empirical results of Table 6 with those of Table 3, the coefficients in Table 6 appear smaller in absolute terms than those in Table 3. This suggests that the results in Table 3 may be overestimated due to endogeneity issues. However, there is no difference in the statistical significance of the coefficients between Tables 3 and 6.
The results in Table 6 indicate that the one-year lagged effect of trade in intermediate goods is significant in the overall sample, as well as in Korea, China, and Japan, demonstrating the dynamic characteristics of trade in intermediate goods. Overall trade facilitation had a significant positive impact on trade in intermediate goods, with the most pronounced effects observed in Korea. The results for the other control variables did not differ from those in Table 3 in terms of sign and statistical significance. Consequently, the results from the Arellano-Bond estimator are consistent with those from the two-way fixed-effects model, thereby supporting the credibility of our empirical findings for the effects of overall trade facilitation on the trade in intermediate goods of the three countries.
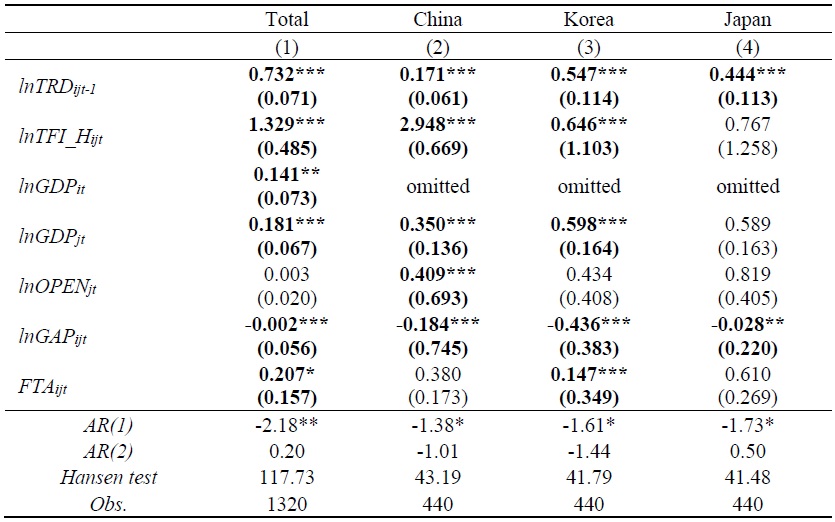
Table 7 presents the empirical results from the Arellano-Bond estimator, serving as a robustness check for the findings in Table 4. The description for each column is the same as in Table 4. In all columns, the Hansen test, the AR(1) and the AR(2) tests confirm the validity of the system GMM model. Comparing the empirical results of Table 7 with those of Table 4, the coefficients in Table 7 generally appear smaller in absolute terms than those in Table 4. This suggests that the results in Table 4 may be overestimated due to endogeneity issues. However, there is no difference in the statistical significance of the coefficients between Tables 4 and 7.
The key findings in Table 7 indicate that the hard environment of trade facilitation had a significant impact on Korea’s and China’s trade in intermediate goods, with the most pronounced effects observed in China. However, there were no effects on Japan’s trade in intermediate goods. In terms of statistical significance, the results for the other variables in Table 7 are consistent with those in Table 4. Consequently, the results from the Arellano-Bond estimator reinforce the credibility of our empirical findings concerning the effects of the hard environment of trade facilitation on the trade in intermediate goods of the three countries.
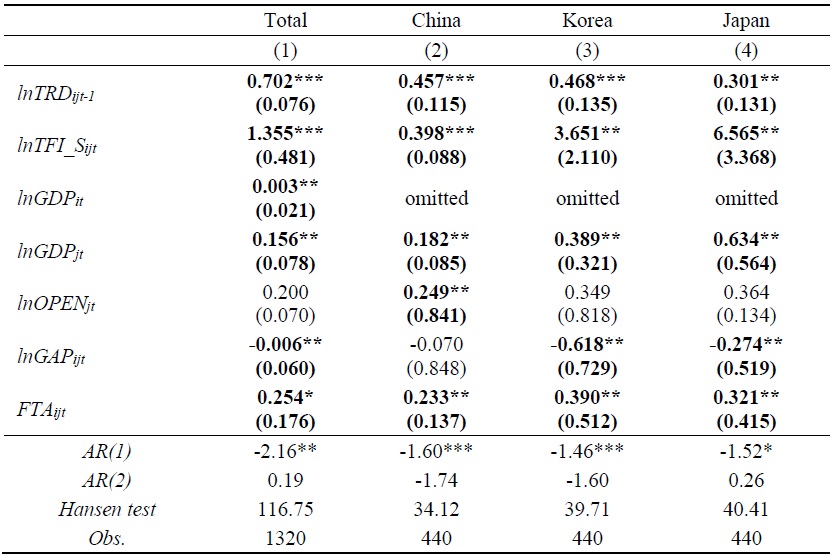
Table 8 presents the empirical results from the Arellano-Bond estimator, serving as a robustness check for the findings in Table 5. The description for each column is the same as in Table 5. In all columns, the Hansen test, the AR(1) and the AR(2) tests confirm the validity of the system GMM model. Comparing the empirical results of Table 8 with those of Table 5, the coefficients in Table 8 generally appear smaller in absolute terms than those in Table 5. This suggests that the results in Table 5 may be overestimated due to endogeneity issues. However, there is no difference in the statistical significance of the coefficients between Tables 5 and 8.
The key findings in Table 8 indicate that the soft environment of trade facilitation had a significant impact on the trade in intermediate goods for the three countries, with the most pronounced effects observed in Japan. In terms of statistical significance, the results for the other variables in Table 8 are consistent with those in Table 5. Consequently, the results from the Arellano-Bond estimator reinforce the credibility of our empirical findings concerning the effects of the soft environment of trade facilitation on the trade in intermediate goods of the three countries.
The regression results in Tables 3 to 8 are summarized as follows: First, trade facilitation significantly promoted the trade of intermediate goods in Korea, China, and Japan, with the most pronounced effects observed in Korea. Second, in the case of the hard environment of trade facilitation, it had the most significant positive impact on China’s trade in intermediate goods, followed by Korea. However, for Japan, the effect was not statistically significant. Third, in the case of the soft environment of trade facilitation, it had the most significant positive impact on Japan’s trade in intermediate goods, followed by Korea and China, respectively. Consequently, in the increase of trade in intermediate goods, China benefited significantly from improvements in the hard environment of trade facilitation, while Japan gained more from the soft environment. In the case of Korea, trade in intermediate goods increased due to both types of trade facilitation, and the overall effect of trade facilitation on intermediate goods trade was found to be the largest.
3. Rationale and Interpretation of the Empirical Results
Depending on the participation levels and positions in GVCs, as well as international competitiveness in producing intermediate goods, we speculate that the effects of trade facilitation on trade in intermediate goods would vary for Korea, China, and Japan. Each country's unique position and industrial strengths are likely to influence how trade facilitation measures impact their trade dynamics in intermediate goods. First, we calculate the forward and backward GVC participation indices for the three countries, using the methodologies of Koopman et al. (2010) and the OECD Inter-Country Input-Output Tables of 2021.6 We describe the detailed calculation results and analysis in Table A1 of the Appendix. In addition, we calculate the New Revealed Comparative Advantage (NRCA) index for the three countries, using the methodologies of Wang et al. (2013) and the OECD Trade in Value-Added database (TiVA).7 In this process, we decompose intermediate goods into primary products, semi-finished products, and components using the Broad Economic Categories (BEC) classification.8 We describe the detailed calculation results and analysis in Table A2 of the Appendix.
The indices of GVC participation reveal that Korea is deeply involved in all stages of GVCs, exhibiting the highest overall GVC participation index among the three countries. Trade facilitation contributes to the deepening of international production fragmentation by intensifying intermediate goods and value-added trade among countries, and promoting the agglomeration and vertical specialization in production stages (Baldwin and Venables, 2013). Korea imports large quantities of raw materials necessary for producing semi-finished products and components, thereby achieving economies of scale and actively participating in GVCs (Choi, 2023). These economies of scale effect of trade facilitation on intermediate goods trade can be observed through the “cascade effect” mentioned by Diakantoni et al. (2017). In GVCs, the cascade effect refers to how trade costs or barriers at one production stage can amplify and affect the entire chain, leading to increased production costs. This effect highlights the importance of minimizing trade barriers to maintain efficiency and competitiveness across all stages of production. Trade facilitation can strengthen Korea’s economies of scale, enhance export efficiency, and increase technological output capacity, thereby boosting its market competitiveness through larger trade volumes. Japan’s index is lower than Korea’s, indicating a slightly lesser degree of participation. Meanwhile, China's index is significantly lower than those of Korea and Japan. Consequently, we speculate that Korea may experience the most significant scale economies effects from trade facilitation in intermediate goods among the three countries, followed by Japan and then China. This rationale underpins the empirical results showing that the effects of overall trade facilitation on trade in intermediate goods were greatest in Korea, followed by Japan and then China.
When decomposing trade facilitation into hard and soft environments, we speculate that the position in GVC participation and the technology level of intermediate goods are the primary significant factors (Liu et al., 2019; Vu and Nguyen, 2010). On one hand, low-tech intermediate goods require extensive transportation and logistics support (Chen and Xing, 2022) and are therefore highly dependent on well-developed transportation networks and port facilities. The hard environment of trade facilitation, including infrastructure and the customs environment, is crucial for reducing transportation costs of intermediate goods and enhancing supply chain efficiency. On the other hand, high-value-added intermediate goods exhibit lower sensitivity to logistics costs because their core competitiveness stems from technological innovation, intellectual property rights, and R&D investments, rather than transportation expenses. The value of these products is determined by their technological content and innovative elements, with logistics costs representing a relatively small portion of the overall costs. In addition, market demand is driven more by product quality, technical standards, and brand value than by low logistics costs. Consequently, trade in high-value-added intermediate goods relies more on soft environmental factors, such as technology protection and industry standards, than on hard environmental factors.
Tables A1 and A2 indicate that Japan primarily trades in components among intermediate goods, leveraging its greater NRCA indices and robust innovation system (Kushida, 2017). It is predominantly positioned at the upper end of GVCs, focusing on advanced intermediate goods with high added value and R&D (Hong and Oh, 2013). To maintain its position in the global value chain, Japan influences the production models of downstream countries by setting technological standards and protecting intellectual property rights (Ito et al., 2020). Japan has higher demands for external systems, including policies and regulations, the business environment, and government administrative efficiency. Consequently, the efficiency of transparency of the soft environment of trade facilitation are crucial for Japan’s trade in intermediate goods, rather than the hard environment.
In contrast, Tables A1 and A2 indicate that China primarily trades in primary products among intermediate goods, leveraging primary production factors such as labor. As a major manufacturing hub, China is mainly positioned at the lower end of GVCs, trading in intermediate goods with low NRCA indices and added value (Li et al., 2020). By improving transportation facilities and optimizing customs processes, China can effectively enhance the efficiency of cross-border transportation of intermediate goods, thereby maintaining its low-cost competitiveness in GVCs. In addition, since China began developing its soft environment, such as legal system, intellectual property protection, and business environment, at a later stage and is gradually opening to the international community, the optimization of this environment must align with international standards (Zhen, 2018). This process requires time and the accumulation of practical experience, which means that the marginal benefits are not immediately apparent. Consequently, the efficiency of transparency of the hard environment of trade facilitation are crucial for China’s trade in intermediate goods, rather than the soft environment.
Meanwhile, Tables A1 and A2 indicate that, in terms of GVC position and international competitiveness of producing intermediate goods, Korea is positioned between Japan and China. Korea primarily imports large quantities of raw materials with low added value and exports semi-finished products and components with high added value, such as electronics and semiconductors. Consequently, this rationale underpins the empirical results showing that the effects of the hard environment of trade facilitation on trade in intermediate goods were greatest in China, followed by Korea, with no observable effects in Japan. Additionally, it supports the empirical results that the effects of the soft environment of trade facilitation on trade in intermediate goods were greatest in Japan, followed by Korea and then China.
6)Forward GVC participation measures the extent to which a country’s intermediate goods are used in the production of other countries’ final goods. Backward GVC participation indicates the degree to which a country relies on imported intermediate goods for its own final goods production. Overall GVC participation is the sum of forward and backward participation.
7)The NRCA index is calculated by dividing a country’s share of world value-added exports of a specific product by its share of total world value-added exports, indicating whether the country has a comparative advantage in that product. The larger the NRCA, the stronger the trade competitiveness of the industry within the country.
8)Primary products refer to raw materials or natural resources that have not been processed, such as crude oil, minerals, agricultural products, and forestry products. Semi-finished products refer to goods that have undergone some processing but are not yet complete, such as steel rods, textile yarns, and partially assembled components. Finally, components refer to parts and sub-assembles used in the production, assembly, or repair of finished goods, such as spare parts in capital goods and equipment.
V. Conclusion and Policy Implication
This paper measures the level of trade facilitation in Korea, China, and Japan, along with their 42 trading partner countries. It examines how trade facilitation, both in terms of hard and soft environments, differently affected the trade in intermediate goods among them during the 2008-2017 period. The hard environment includes physical infrastructure like transportation and logistics, while the soft environment involves regulatory efficiency and administrative processes. Our empirical findings are as follows: Korea benefited the most from overall trade facilitation. Among the three countries, Korea has the highest participation in GVCs, importing low-value raw materials and exporting high-value semi-finished products and components. We speculate that this participation generated economies of scale effects from overall trade facilitation on trade in intermediate goods. China benefited significantly from improvements in the hard environment of trade facilitation, as it is positioned at the lower end of GVCs and focuses on primary products with low added value. In contrast, Japan gained the most from improvements in the soft environment of trade facilitation, being positioned at the upper end of GVCs and focusing on advanced intermediate goods such as components.
These empirical results provide a strategic framework for policymakers to enhance trade facilitation and leverage their positions within GVCs as follows. First, further investment in hard infrastructures, such as transport and logistics, can enhance trade efficiency in intermediate goods. This approach is particularly beneficial for developing countries that engage in trading a higher volume of low value-added products at the lower end of GVCs. Second, developed countries should more concentrate on refining their regulatory and administrative frameworks to maintain their competitive edge in the trade of high-value intermediate goods at the upper end of GVCs. Third, the higher the participation in GVCs, the more essential it becomes to invest in a balanced manner between physical infrastructure and regulatory reforms to sustain competitive advantage in GVC participation. Consequently, for Korea, China, and Japan, which are geographically close and closely interconnected at various stages of GVCs, strengthening regional trade agreements and cooperation can leverage their respective strengths in trade facilitation to enhance their roles in within GVCs. For Korea and China, focusing on innovation and R&D will be crucial to moving up the value chain in GVCs, as evidenced by Japan’s strategy of focusing on high-value-added goods.
This paper is limited by its focus on analyzing the relationship between trade facilitation and trade in intermediate goods solely among Korea, China, and Japan. Future study should expand the scope to include a broader range of countries and years, distinguish between TFI for exporters and importers, and consider product types, such as capital and final goods. This would provide more comprehensive empirical evidence for both developed and developing countries, as well as insight into recent international trade trends and various product characteristics. In particular, there is a need for research that theoretically explores and empirically supports the nonlinear relationship between trade facilitation and trade in intermediate goods according to the level of economic development of each country. We speculate that while improvements in the hard environment of trade facilitation lead to an increase in the trade in intermediate goods, the marginal effects diminish over time. Conversely, enhancements in the soft environment of trade facilitation are presumed to result in a progressively increasing impact on the trade in intermediate goods. Additionally, in the case of China, the rapid advancement of high-tech industries such as AI likely led to significant changes in its position within GVCs. Consequently, it would be an interesting research topic to explore how the economic effects of trade facilitation have dynamically changed as a result. These ideas will be reserved for future research endeavors.
Tables & Figures
Table 1.
Primary and Secondary Indicators of Trade Facilitation
Source: the information compiled by the authors
Table 2.
Descriptive Statistics of Variables
Source: the information compiled by the authors
Table 3.
Main Results: Overall Trade Facilitation
Notes: Figures in parentheses are standard errors. *, **, and *** represent significance at the 1%, 5%, and 10% levels, respectively
Table 4.
Main Results: Hard Environment of Trade Facilitation
Notes: Figures in parentheses are standard errors. *, **, and *** represent significance at the 1%, 5%, and 10% levels, respectively.
Table 5.
Main Results: Soft Environment of Trade Facilitation
Notes: Figures in parentheses are standard errors. *, **, and *** represent significance at the 1%, 5%, and 10% levels, respectively.
Table 6.
Robustness Check: Overall Trade Facilitation
Notes: Figures in parentheses are standard errors. *, **, and *** represent significance at the 1%, 5%, and 10% levels, respectively.
Table 7.
Robustness Check: Hard Environment of Trade Facilitation
Notes: Figures in parentheses are standard errors. *, **, and *** represent significance at the 1%, 5%, and 10% levels, respectively.
Table 8.
Robustness Check: Soft Environment of Trade Facilitation
Notes: Figures in parentheses are standard errors. *, **, and *** represent significance at the 1%, 5%, and 10% levels, respectively.
Table A1.
GVC Participation Indices of Korea, China, and Japan
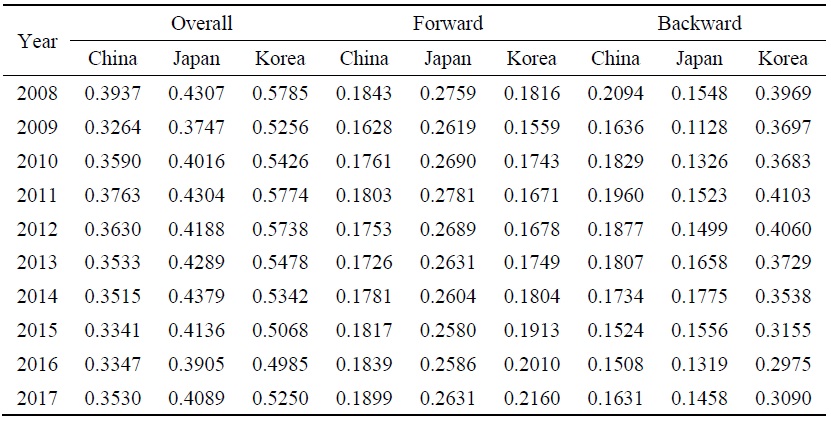
Source: The authors’ calculations using data from the OECD Inter-Country Input-Output Table
Table A2.
NRCA Indices of Korea, China, and Japan
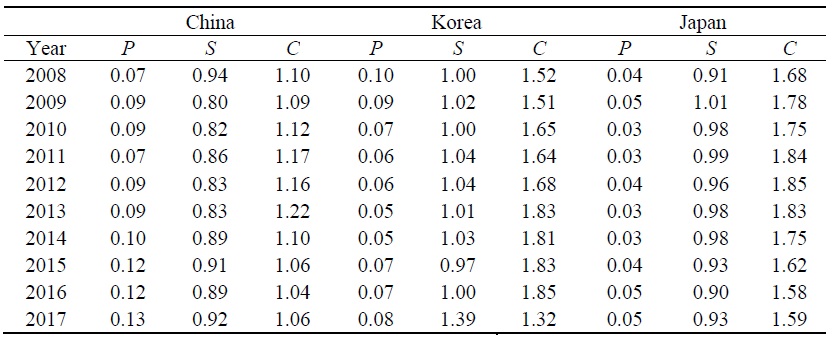
Note: P, S, and C refer to primary products, semi-finished products, and components, respectively.
Source: The authors’ calculations using data from the OECD TiVA
References
-
Arellano, M. and S. Bond. 1991. “Some Tests of Specification for Panel Data: Monte Carlo Evidence and an Application to Employment Equations.”
Review of Economic Studies , vol. 58, issue 2, pp. 277-297.
-
Baldwin, R. and A. Venables. 2013. “Spiders and Snakes: Offshoring and Agglomeration in the Global Economy.”
Journal of International Economics , vol. 90, no. 2, pp. 245-254. -
Beverelli, C., Gourevich, I., Heiland, I., Keck, A., Larch, M., and Y. Yotov. 2023. “Trade and Welfare Effects of the WTO Trade Facilitation Agreement.”
Staff Working Paper ERSD-2023-04, World Trade Organization. -
Botelho, J., Mietule, I., Hushko, S., Kulishov, V., and I. Maksymova. 2021. “Comparative Advantages of International Trade: The Bilateral Opportunities Portugal-Latvia, Portugal-Poland, and Portugal-Ukraine.”
Journal of European Economy , vol. 20, no. 1, pp. 93-126.
-
Chen, W. and L. Xing. 2022. “Measuring the Intermediate Goods’ External Dependency on the Global Value Chain: A Case Study of China.”
Sustainability , vol. 14, issue 7, pp. 1-21. -
Cheng, K. and F. Yang. 2022. “The Impact of Trade Facilitation on Enterprise Export Duration: From the Perspective of Imported Intermediate Goods.”
International Economics and Trade Research , no. 02, pp. 66-82. -
Choi, Y. 2023. “Global Value Chains and Productivity in Korean Industry: Does the Position of Participation Matter?”
Journal of Asian Studies , vol. 26, no. 4, pp. 163-181.
- Deng, J. 2021. “The Impact of Trade Facilitation on Global Value Chain Participation and Positioning.” Master’s Thesis, Zhongnan University of Economics and Law.
-
Diakantoni, A., Escaith, H., Roberts, M., and T. Verbeet. 2017. “Accumulating Trade Costs and Competitiveness in Global Value Chains.”
WTO Working Paper ERSD-2017-02. World Trade Organization. -
Dong, H. and Q. Kong. 2021. “Trade Facilitation, International Production Fragmentation, and Export Value Composition.”
International Economics and Trade Research , vol. 37, issue 01, pp. 4-19. -
Duan, W. and G. Jing. 2021. “Trade Facilitation, Global Value Chain Embedding, and Supply Chain Efficiency: From the Perspective of Export Enterprise Inventory.”
China Industrial Economics , no. 02, pp. 117-135. -
Engman, M. 2005. “The economic impact of trade facilitation.”
OECD Trade Policy Papers , no. 21. OECD Publishing. -
Hong, G. and H. Oh. 2013. “Gains from trade liberalization between heterogeneous countries: Implications for the Korea–Japan FTA.”
KIEP Working Paper 13-09. Korea Institute for Economic Policy. -
Hu, C., Li, T., and Y. Qiu. 2024. “The Impact of Regional Trade Agreements on Global Value Chain Participation: A Perspective Based on the Depth Level of Regional Trade Agreements.”
Journal of Hebei University of Economics and Business , vol. 45, no. 3, pp. 98-109. -
Ito K., Deseatnicov, I., and K. Fukao. 2020. “Japan’s participation in Global Value Chains: Splitting the IO table into Production for Export and Domestic Sale.”
Economic Systems Research , vol.32, issue 2, pp. 173-191. -
Jang, Y. and M. Cho. 2015. “Trade Liberalization of the Intermediate Goods and Domestic Product Growth: Evidence from Korea.”
Journal of International Trade and Industry Studies , vol. 20, no. 3, pp. 1-31. -
Jolliffe, I. 2002.
Principal Component Analysis . New York: Springer. -
Kong, Q. and H. Dong. 2015. “Measurement of Trade Facilitation Levels and Research on Trade Potential in ‘Belt and Road’ Countries.”
International Trade Issues , no. 12, pp. 158-168. -
Koopman, R., Powers, W., Wang, Z., and S. Wei. 2010. “Give Credit Where Credit is due: Tracing Value Added in Global Production Chains.”
NBER Working Paper No. 16426. -
Kushida, K. 2017. “Innovation and Entrepreneurship in Japan: Why Japan (Still) Matters for Global Competition.”
SVNJ Working Paper , no. 2017-2. - Li, X. 2018. “Analysis of the Impact of Trade Facilitation on China’s Trade in Manufactured Goods with Japan and Korea.” Master’s Thesis, Liaoning University.
- Li, X. 2021. “Research on the Impact of Trade Facilitation Levels in ‘Belt and Road’ Countries on China’s Imports of Final Consumer Goods.” Master’s Thesis, Jilin University.
-
Li, Y., Sun, H., Huang, J., and Q. Huang. 2020. “Low-End Lock-In of Chinese Equipment Manufacturing Industry and the Global Value Chain.”
Sustainability , vol. 12, issue 7, pp. 1-25. -
Liu, B., Wang, N., and C. Li. 2019. “Trade facilitation and value chain participation: An analysis based on the World Input-Output Database.”
Economic Research Journal , vol. 10, pp. 73-85. -
Liu, B., Wang, N., and X. Tu. 2018. “Does Trade Facilitation Improve the Returned Value Added in Exports?”
The Journal of World Economy , vol. 41, no. 8, pp. 103-128. -
Mao, Y. and S. Yang. 2015. “The Maritime Silk Route and the Building of Trade Facilitation Corporation and Capacity.”
International Economics and Trade Research , vol. 31, issue 4, pp. 101-112. -
Porto, P., Canuto, O., and C. Morini. 2015. “The Impacts of Trade Facilitation Measures on International Trade Flows.”
Policy Research Working Paper 7367, World Bank. -
Portugal-Perez, A. and J. Wilson. 2012. “Export Performance and Trade Facilitation Reform: Hard and Soft Infrastructure.”
World Development , vol. 40, issue 7, pp. 1295-1307.
-
Qin, X. and W. Guo. 2024. “The Impact of Trade Facilitation on Value-Added Trade from the Perspective of Global Value Chains.”
Management Modernization , vol. 44, issue 03, pp. 1-8. -
Shepherd, B. and J. Wilson. 2009. “Trade Facilitation in ASEAN Member Countries: Measuring Progress and Assessing Priorities.”
Journal of Asian Economics , vol. 20, issue 4, pp. 367-383.
-
Toševska-Trpčevska, K. and D. Tevdovski. 2016. “Trade Facilitation Indicators and Their Potential Impact on Trade between the Countries of South-Eastern Europe.”
Scientific Annals of Economics and Business , vol. 63(3), pp. 347-362.
-
UNCTAD. 2013.
World Investment Report 2013: Global value chains—Investment and trade for development . Geneva: United Nations. -
Vu, H. and T. Nguyen. 2010. “Differential Impacts of Trade Facilitation on Homogeneous and differentiated Products in East Asia.”
Asia-Pacific Research and Training Network on Trade Working Paper Series , no. 85, UN ESCAP. -
Wang, Z., Wei, S., and K. Zhu. 2013. “Quantifying International Production Sharing at the Bilateral and Sector levels.”
NBER Working Papers 19677, National Bureau Economic Research. -
Wilson, J., Mann, C., and T. Otsuki. 2003. “Trade Facilitation and Economic Development: A New Approach to Measuring the Impact.”
World Bank Economic Review , vol. 17, issue 3, pp. 367-389.
-
Wilson, J., Mann, C., and T. Otsuki. 2005. “Assessing the Benefits of Trade Facilitation: A Global Perspective.”
The World Economy , vol. 28, issue 6, pp. 841-871.
- Xu, Y. 2016. “An Empirical Study on the Trade Growth Potential of China, Japan, and Korea.” Master’s Thesis, Guizhou University.
-
Zhen, J. 2018. “Research on the Soft Environment of Industrial Parks in China: Function, Connotation, and Optimizing Countermeasure.”
Advances in Economics, Business and Management Research , vol. 54, pp. 185-188. -
Zheng, H. and J. Han. 2022. “The Impact of Trade Facilitation Rules in Free Trade Agreements on Value Chain Trade.”
World Economy Studies , no. 02, pp. 73-88.