

- EAER>
- Journal Archive>
- Contents>
- articleView
Contents
Citation
| No | Title |
|---|
Article View
East Asian Economic Review Vol. 29, No. 2, 2025. pp. 107-137.
DOI https://dx.doi.org/10.11644/KIEP.EAER.2025.29.2.446
Number of citation : 0View
152
Download
102
Innovation and Income Inequality: Exploring the Role of the Golden Triangle
|
|
Golestan University |
|---|

Abstract
This study explores the complex relationship between innovation and income inequality in 29 Asian economies from 2013 to 2022, emphasizing the mediating role of the Golden Triangle—comprising the state, civil society, and the market system. The study highlights how imbalances in the Golden Triangle’s components can hinder the inclusive potential of innovation, exacerbating inequality. Using a Panel Smooth Transition Regression (PSTR) model, it captures the nonlinear dynamics of innovation’s impact on income distribution and identifies threshold effects driven by institutional imbalances. The study reveals that the impact of innovation on income inequality is highly dependent on the balance within the Golden Triangle—state, civil society, and the market. When this balance is maintained, innovation contributes to more equitable income distribution by fostering inclusive economic growth. However, when the Golden Triangle is imbalanced, innovation disproportionately benefits higher-income groups, widening income disparities. Specifically, excessive power imbalances reduce the income share of low-income groups and concentrate wealth among high-income groups. Power imbalances weaken the redistributive effects of innovation, reducing the income share of lower-income groups while concentrating wealth at the top. These results highlight the critical role of institutional frameworks in shaping the equity outcomes of innovation. The study offers valuable policy insights, emphasizing the need for balanced institutional structures to ensure that innovation promotes inclusive growth rather than deepening economic disparities in Asian economies.
JEL Classification: O33, D63, F63
Keywords
Golden Triangle, Income Inequality, Innovation, Institutional Balance
I. Introduction
The relationship between innovation and income inequality has been a focal point of welfare and inequality issues, particularly in the context of rapidly developing economies. Innovation, often heralded as the engine of economic growth, can produce both opportunities and disparities within societies. On one hand, it fosters technological advancement, productivity growth, and employment creation. On the other hand, it may exacerbate income inequality by disproportionately benefiting skilled labor and high-income groups, while marginalizing unskilled workers and low-income populations (Acemoglu and Autor, 2011). Understanding this duality is essential for policymakers aiming to harness the benefits of innovation without deepening social and economic divides.
Identifying and explaining the relationship between innovation and income inequality has become increasingly important in recent years. The rapid growth of artificial intelligence (AI) as a leading innovation and transformative technology is expected to have a profound impact on the automation of businesses and industries. One of the key variables likely to be significantly influenced by the development of AI is the distribution of income within societies and, more broadly, economic inequality between countries worldwide. Understanding the mechanisms through which innovation (for example AI), affects income distribution is not only important but also essential for developing policies that promote inclusive growth and mitigate the adverse effects of technological advancements on inequality. In the Asian economy, this dynamic is particularly pronounced. Asia has emerged as a global hub for innovation, driven by rapid industrialization, digital transformation, and significant investments in research and development (R&D) (OECD, 2021). Countries such as China, South Korea, and Singapore have experienced unprecedented economic growth through innovation-led strategies, which have simultaneously contributed to widening income gaps. This phenomenon underscores the importance of examining the specific mechanisms through which innovation influences income distribution in Asia, where economic contexts and institutional frameworks differ significantly from those in Western economies (Xu and Li, 2020).
This study seeks to explore the intricate relationship between innovation and income inequality in Asian economies, with a focus on the role of the Golden Triangle in shaping these outcomes. Aghion et al. (2021) introduce the “golden triangle” as a framework comprising the state, civil society, and the market system, which collectively foster innovation and creative destruction (Aghion et al., 2021). For this synergy to work, each pillar must be independently strong and balanced in power relative to the others. The state provides stable institutions, enforces property rights, and maintains macroeconomic stability; civil society cultivates trust, social capital, and cooperative norms; and the market promotes competition, entrepreneurship, and resource efficiency. A balanced distribution of power ensures these elements support and regulate each other, preventing issues such as monopolies from an unregulated market or authoritarianism from excessive state control. Civil society plays a crucial mediating role, holding both the state and market accountable. This interplay creates an adaptive environment conducive to continuous innovation, aligning with Schumpeter’s (1942) concept of creative destruction (Aghion et al., 2021).
By analyzing empirical evidence and theoretical perspectives, this paper aims to contribute to the growing body of literature on the socioeconomic impacts of innovation. In other words, this paper examines how innovation affects income inequality in Asian countries and how innovation growth will change the income share of the bottom and top deciles of society, and also identifies and explains the mediating role of the Golden Triangle (state, market, and civil society) in how innovation affects income distribution.
II. Lecture Review
1. Innovation and Inequality
Kuznets (1955) proposed the influential hypothesis that industrialization initially exacerbates income inequality, a claim supported by Williamson’s (Williamson, 1980; Williamson, 1985) analysis of post-Industrial Revolution Britain, where inequality rose steadily until the mid-19th century. Inspired by this framework, Chu and Perreto (2023) developed a model depicting two distinct economic eras. In the pre-industrial era, the economy stagnates with minimal growth, and income inequality stems from fixed disparities in land ownership, remaining stable over time. Transition to the industrial era occurs when population growth expands market size, triggering innovation and accelerating output growth until a steady state is reached. During this phase, income inequality rises gradually due to shifting dynamics in asset ownership. The model highlights that wealth inequality—initially tied to land—drives income disparities. Industrialization introduces innovation, raising economic growth and interest rates. This increases the relative importance of unequally distributed asset income, intensifying inequality until the economy stabilizes on a balanced growth path. Consequently, the analysis demonstrates that income inequality exerts differential impacts on key economic variables across long-term growth trajectories. The magnitude and directionality of these effects are further determined by the structural characteristics inherent to the economic growth pathway. From this analytical lens, innovation emerges as a principal structural determinant of sustained economic development trajectories. Endogenous growth frameworks posit that shifts in innovation intensity dynamically reconfigure production frontiers, thereby inducing path-dependent redistributive effects. This bifurcation mechanism generates non-linear inequality dynamics, where the elasticity of income dispersion to innovation rates depends critically on institutional factors like intellectual property regimes, labor market flexibility, and human capital diffusion capacities (Aghion et al., 2019).
A key question in the study of innovation is how it influences income distribution and contributes to income and wealth inequality. Theoretical frameworks suggest that innovation can impact income distribution through various channels, with effects that may either increase or reduce inequality, depending on the prevailing conditions. While innovation has the potential to exacerbate income inequality, under certain circumstances, it can also help mitigate disparities. These divergent effects depend on factors such as access to education, the distribution of capital, and the structure of labor markets. The following channels illustrate how innovation can contribute to the widening of income inequality.
Innovation introduces new technologies and production processes, leading to skill-biased technological change (SBTC), where demand for high-skilled labor increases, often at the expense of low-skilled workers (Acemoglu, 2002). This dynamic can widen income gaps, particularly in economies where access to education and skill acquisition is uneven. Card and DiNardo (2002) analyzed the rise in wage inequality in the United States, attributing it to SBTC associated with new computer technologies, which increased demand for skilled workers and widened wage gaps (Card and DiNardo, 2002). Similarly, Berman et al. (1998) provided international evidence supporting the SBTC hypothesis, showing that countries experiencing greater technological advancements saw a more significant increase in the demand for skilled labor, leading to higher wage inequality (Berman et al., 1998). In the context of OECD countries, Taniguchi and Yamada (2019) found that increases in ICT capital intensified wage disparities between skilled and unskilled workers, as technological advancements complemented skilled labor, enhancing their productivity and earnings (Taniguchi and Yamada, 2019). Workers’ adaptability to technological change impacts income distribution, influenced by institutional frameworks regarding education and skill development. Countries with inclusive education policies help all income levels acquire necessary skills, reducing inequality (Acemoglu and Autor, 2011). Nordic countries exemplify this by minimizing wage gaps through strong educational systems, while weak institutions exacerbate wage disparities as highly skilled workers disproportionately benefit from innovation-driven wage increases.
Labor market institutions, such as trade unions and minimum wage policies, significantly influence how innovation impacts income distribution. In economies with robust labor protections, technological advancements promote proportional wage growth across income groups, allowing workers to benefit alongside firms. For example, Germany’s collective bargaining system has alleviated wage polarization from automation. Conversely, in countries with weak labor institutions, technological change often leads to job displacement and reduced labor income shares, increasing income inequality (Card, 2001).
Innovation fosters market concentration, enabling innovators and firms with intellectual property rights to accumulate disproportionate shares of income and wealth, further exacerbating inequality. Innovative firms that pioneer new technologies or business models frequently achieve dominant market positions, capturing significant rents and concentrating wealth among a small group of entrepreneurs and investors. This concentration can intensify income inequality over time. Aghion et al. (2021) found a positive correlation between innovation and top income inequality in the United States, suggesting that innovative activities contribute to income concentration among top earners (Aghion et al., 2021). Similarly, Kurz argued that technological innovations grant firms market power, enabling them to capture significant economic rents, which exacerbates wealth concentration and income inequality (Kurz, 2017). Aghion et al. (2015) finds a significant positive relationship between innovation and top income inequality in the U.S., with innovation explaining around 17% of the rise in the top 1% income share from 1975 to 2010 (Aghion et al., 2015).
Market competition significantly influences how innovation benefits society. Strong institutions promote fair competition, preventing monopolies and fostering broader participation in technology, which helps distribute income more equitably (Zingales, 2017). In contrast, weak institutions enable “Superstar Firms” to dominate, leading to wealth concentration and wage suppression. Studies indicate that lax antitrust laws contribute to wage stagnation and rising income inequality (Autor et al., 2020).
Innovation-driven economic growth disproportionately benefits owners of capital (e.g., intellectual property, financial assets), further increasing the income share of the wealthy relative to labor incomes. Piketty highlighted that returns on capital, such as intellectual property and financial assets, often exceed economic growth rates, leading to a rising income share for wealthy individuals (Piketty, 2014). Aghion et al. showed that innovation enhances the profitability of capital-intensive firms, enabling them to accumulate wealth at a faster pace than wage growth for workers (Aghion et al., 2015). Similarly, Alvaredo et al. found that innovation contributes to income inequality by increasing the valuation of intangible assets like patents, disproportionately benefiting the top income earners (Alvaredo et al., 2018). Financial institutions are crucial in determining access to innovation-driven economic growth. Strong financial systems provide broad access to credit for small and medium-sized enterprises (SMEs) and entrepreneurs, enabling income generation through technology (Greenwood and Jovanovic, 1990). For instance, Germany and Japan’s frameworks promote equitable wealth distribution. In contrast, weak financial institutions limit access to capital for a small elite, increasing wealth concentration and economic disparities (Beck et al., 2007).
On the other hand, innovation can improve income distribution through channels and if the necessary conditions are in place. Innovation drives productivity and economic expansion, creating new industries and employment opportunities. These benefits can improve living standards and reduce income disparities, particularly when complemented by policies that support education and labor mobility. Crépon et al. showed that regions with higher innovation activities experienced more job creation, particularly in high-tech industries, which contributed to a reduction in regional income disparities (Crépon et al., 2013). Furthermore, Bloom et al. demonstrated that innovation, coupled with policies promoting labor mobility and education, can significantly enhance social mobility and reduce income inequality by providing individuals with the tools needed to participate in emerging industries (Bloom et al., 2017).
Taxation systems shape the extent to which innovation-driven wealth is equitably distributed. In economies with progressive tax systems, governments can use tax revenues from high-income earners and corporations benefiting from technological advancements to fund social programs and public investments, thereby reducing inequality (Piketty, 2014). Empirical studies show that Scandinavian countries, with well-designed redistributive policies, have managed to contain the inequality effects of innovation far better than economies with weaker redistribution mechanisms, such as the United States (Piketty and Saez, 2013). Conversely, in countries with weak tax institutions, innovation tends to exacerbate income disparities as the benefits of technological progress remain concentrated among top earners.
Technological advances often reduce the cost of goods and services, enhancing access for lower-income groups. For instance, innovations in communication and healthcare improve quality of life and social outcomes, indirectly reducing inequality. Several empirical studies have found that technological advances, particularly in communication and healthcare, can reduce the cost of goods and services, enhancing access for lower-income groups and indirectly reducing inequality. (Brynjolfsson and McAfee, 2014) Showed that advancements in communication technologies, such as the internet and mobile phones, have facilitated greater access to information and markets, benefiting lower-income groups by improving their social and economic mobility.
By reshaping economic structures, innovation can shift labor from low-productivity sectors to high-productivity ones, increasing wages and reducing disparities in developing and emerging economies (Kuznets, 1955). Kuznets (1955) first proposed this concept in his seminal work, suggesting that economic growth driven by technological advancements could lead to structural shifts in the labor market, promoting higher wages in more productive sectors. Later studies, such as those by Acemoglu and Autor, showed that innovation in technology and industry could foster this type of structural transformation, especially in emerging economies (Acemoglu and Autor, 2011).
Thus far, the analysis demonstrates that, according to existing theoretical foundations, innovation can influence income and wealth distribution through multiple channels. These channels can be categorized into three subsets (figure 1): market-based, government-driven, and civil society-oriented. However, empirical evidence indicates that the nature of innovation’s impact on income and wealth inequality is heavily contingent on a society’s institutional structures and socioeconomic characteristics. The ultimate impact of innovation on distributional outcomes hinges on the interplay of power dynamics within each of these channels. Furthermore, all such channels operate within a framework governed by the overarching institutional environment of a society. Consequently, the institutional architecture and its equilibrium—particularly the balance between market, state, and civil society forces—emerge as critical determinants in shaping whether innovation exacerbates or mitigates inequality.
Empirical studies also confirm that institutional structures are an effective factor in how innovation affects income distribution and inequality. Reforming institutions can significantly alter the impact of innovation on income inequality. Strengthening labor rights ensures that wages grow alongside productivity improvements, preventing the erosion of labor’s share of income. Investing in universal education enhances workers’ ability to adapt to technological change, reducing skill-biased wage inequality. Enforcing competition laws prevents excessive wealth accumulation by monopolies (Zingales, 2017). Lastly, implementing progressive taxation redistributes innovation-generated wealth more equitably, preventing widening income gaps (Piketty, 2014).
Formal institutions, such as government effectiveness, labor regulations, and tax systems, mediate inequality through: A. Skill Development Programs: Effective governments invest in education and vocational training, enabling workers to adapt to technological shifts and reducing skill mismatches (Acemoglu and Restrepo, 2020). B. Antitrust Regulations: Strong antitrust policies prevent monopolistic accumulation of digital rents. For example, regions with stricter competition laws limit wealth concentration among tech firms (Aghion et al., 2021). C. Progressive Taxation: Redistributive tax systems offset capital-biased returns from digital assets. In Scandinavia, high top marginal tax rates curb income concentration among tech elites (Piketty, 2014). In regions with high government effectiveness (e.g., Denmark), the inequality-widening effect of digital technology (DT) is reduced by 40%. This is attributed to policies like universal broadband access paired with subsidized upskilling programs (Antonietti et al., 2025).
Informal institutions, particularly bridging and bonding social capital, mitigate inequality by (Antonietti et al., 2025): A. Bridging Social Capital: Inclusive networks connect displaced workers to new opportunities. For instance, community-driven digital literacy programs in Germany’s Baden-Wurttemberg region helped low-skilled workers transition to tech-adjacent roles (Putnam, 2000). B. Bonding Social Capital and
2. Golden Triangle
Therefore, considering all of the above, we can conclude that: Innovation undeniably plays a dual role in shaping income inequality, serving as both a catalyst for economic growth and a potential source of socioeconomic disparities. This duality underscores the complexity of understanding and managing the relationship between innovation and income distribution. This dual impact of innovation on inequality is highly dependent on the institutional structure in society. But in addition to institutional structure, this article argues that the balance of institutional power is of great importance in the effect of innovation on inequality. In this article, I argue that the Golden Triangle is a pivotal framework for analyzing how innovation influences income inequality. But what is the Golden Triangle? Aghion et al. (2021) argue that the interplay of three institutional forces—the state, civil society, and the market system—constitutes the foundational framework for driving creative destruction and advancing innovation. They conceptualize this triad as the “Golden Triangle,” emphasizing its centrality to sustainable development. For this triangle to function optimally, two criteria must be met: (1) each institution must independently demonstrate substantial institutional capacity, and (2) a balanced power equilibrium must exist among them. Absent such equilibrium, the system fails to catalyze innovation or structural transformation. The authors caution that excessive concentration of executive authority within the state, for instance, risks institutional decay into autocratic governance, which over time cultivates environments prone to corruption and stifles disruptive innovation (Aghion et al., 2021). Specifically, the state must establish and uphold robust institutions, secure property rights, and ensure macroeconomic stability. Civil society is tasked with cultivating trust, cooperative norms, and mechanisms for collective action. The market system must incentivize entrepreneurship, enforce market competition, and allocate resources efficiently. Crucially, the synergistic interplay of these three pillars generates an ecosystem conducive to innovation. Conversely, dominance by any single pillar—such as a hegemonic state suppressing civil liberties or monopolistic markets distorting competition—disrupts this equilibrium, leading to institutional paralysis and diminished creative capacity (Aghion et al., 2021).
Inspired by this framework, an imbalance in the golden triangle—particularly state overreach or weakened civil society—could exacerbate inequality during the transition to an innovation-driven economy, as skewed power dynamics distort resource access and amplify rent-seeking over inclusive growth. The impact of innovation on income distribution is profoundly shaped by the institutional and structural contexts in which it unfolds, making the Golden Triangle a critical threshold mechanism in mediating these effects. When the Golden Triangle fosters conditions conducive to creative destruction, innovation can act as a force for reducing income inequality by promoting inclusive economic growth. Under these circumstances, innovation facilitates the diffusion of benefits across diverse social and economic groups. Conversely, in the absence of these enabling conditions, innovation may exacerbate income disparities, disproportionately benefiting skilled labor and capital owners while marginalizing low-income and less skilled populations. This divergence underscores the importance of understanding the specific roles of each pillar within the Golden Triangle. The state plays a crucial role by implementing policies that ensure equitable access to education and skill development, robust labor market regulations, and progressive taxation systems. Such measures are essential for mitigating the polarizing effects of innovation and fostering a more inclusive economic landscape. Civil society contributes by fostering social trust, promoting collective action, and advocating for policies that address systemic inequality. Through its capacity to hold both the state and market actors accountable, civil society acts as a vital intermediary in ensuring that the benefits of innovation are widely shared. The market system, when characterized by competitiveness and inclusivity, enables broad-based participation in the economic gains generated by innovation. A well-functioning market system ensures that innovation does not concentrate wealth and opportunities in the hands of a few but rather drives equitable economic advancement (Aghion et al, 2021). However, the balance among these pillars is critical. An imbalance within the Golden Triangle—such as excessive state control, inadequate civil society engagement, or unchecked market power—can distort the distributional effects of innovation, exacerbating inequalities. For example, excessive state intervention may stifle entrepreneurial activity, while unregulated markets can lead to monopolistic practices that concentrate wealth. Thus, achieving a dynamic equilibrium within the Golden Triangle is essential for harnessing innovation as a tool for reducing income inequality and fostering sustainable, inclusive growth. Therefore, as shown in Figure 1, innovation can have an impact on inequality through multiple channels, but the type and size of its effect will depend on the conditions of the Golden Triangle and the balance of power between the three sides of this triangle.
III. Method
This study employs the Panel Smooth Transition Regression (PSTR) approach to capture nonlinear and regime-dependent relationships in panel data. The Panel Smooth Transition Regression (PSTR) model, originally introduced by González et al. (2005), is a flexible econometric technique designed to capture nonlinear and regime-dependent relationships in panel data. Unlike traditional panel regression models, which assume constant marginal effects across all observations, PSTR allows for smooth and continuous variation in the coefficients based on a transition variable. Standard panel regression models (fixed effects or random effects) impose the assumption that the impact of an independent variable on the dependent variable remains constant across all observations. However, in many economic contexts, the strength and direction of a relationship may change depending on underlying structural conditions. The PSTR model addresses this limitation by allowing regression coefficients to evolve gradually across different regimes rather than shifting abruptly, as seen in threshold regression models (PTR). For instance, in this study, we hypothesize that the impact of innovation on income inequality is nonlinear and depends on institutional balance (Golden triangle balance or StdGold index). Specifically: When institutional balance is weak, innovation may primarily benefit high-income groups, exacerbating inequality. When institutions are well-balanced, innovation may promote inclusive economic growth, leading to lower inequality.
The PSTR model is particularly suitable for contexts where the effects of explanatory variables on the dependent variable are not constant but vary smoothly across different regimes. This variation is driven by a continuous transition variable and governed by threshold values. The PSTR model is an extension of panel threshold models that allows for smooth transitions between regimes rather than abrupt changes. It is defined as follows:

Where,
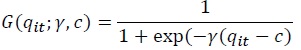
Where
1)Absolute Gini index is (Gini x GDP/1000). Income inequality data is obtained from World Income Inequality (WIID) Database. It should be noted that many studies believe that the absolute Gini coefficient can be a more appropriate indicator for measuring inequality in r time dependent analyses
2)The Global Innovation Index (GII) is an annual ranking that evaluates the innovation capabilities and performance of countries worldwide. It is jointly developed by the World Intellectual Property Organization (WIPO), Cornell University, and INSEAD. The GII is calculated based on a composite index that integrates 80+ indicators across various dimensions of innovation. These indicators are grouped into two main sub-indices: the Innovation Input Sub-Index, which measures factors that enable innovation (such as institutions, human capital, infrastructure, market sophistication, and business sophistication), and the Innovation Output Sub-Index, which assesses tangible innovation results (such as knowledge creation, technology outputs, and creative outputs). The final GII score is derived as the simple average of these two sub-indices. It evaluates national innovation ecosystems across indicators spanning seven pillars: Human capital/research (education, R&D investment), Infrastructure (ICT, logistics), Market sophistication (credit, investment, trade), Business sophistication (knowledge workers, innovation linkages), Knowledge/technology outputs (patents, high-tech exports), Creative outputs (intangible assets, cultural goods). The GII aggregates these dimensions into a normalized score (0?100), providing a holistic measure of innovation capacity and performance.
3)The countries are: Azerbaijan, Bangladesh, Bahrain, Cambodia, China, Georgia, Hong Kong SAR, China, India, Indonesia, Iran (Islamic Rep.), Israel, Japan, Jordan, Korea (Rep.), Kuwait, Lebanon, Malaysia, Mongolia, Nepal, Oman, Pakistan, Philippines, Qatar, Saudi Arabia, Singapore, Sri Lanka, Thailand, United Arab Emirates, and Vietnam. It should be noted, estimating the model required a large amount of raw data. A critical limitation of PSTR models is that they cannot accommodate any missing data during estimation. Therefore, the selection was focused on countries with complete datasets. Additionally, we aimed to choose a relatively homogeneous group of countries, specifically those on a development trajectory. Given these considerations, Asian countries were selected as they provided both comprehensive data and a relevant case for analysis
4)Several studies have utilized the Panel Smooth Transition Regression (PSTR) model to examine nonlinear relationships in economic and financial contexts.
IV. Data Description and Estimation of the Golden Triangle Index
Table 1 presents the descriptive statistics for the main variables of the study. The data shows considerable variation in innovation, inflation, and economic growth across countries. While the Global Innovation Index demonstrates moderate variability, inflation and GDP growth exhibit much higher fluctuations. Income distribution is uneven, with significant disparities between the top and bottom income groups. The Gini index, which measures inequality, also varies widely, indicating different levels of economic inequality across countries. These statistics highlight the diverse economic conditions and inequalities examined in this research.
The provided box plots (Figure 3) illustrate the distribution of several economic and social indicators across sample countries, revealing notable dispersions. Regarding income inequality, both the “Income share of the top 20%” and the “Gini index” exhibit considerable variability across nations, indicating a wide range of income distribution patterns. Some countries show a highly concentrated income share among the top quintile, reflected in higher medians and larger interquartile ranges (IQRs), while others demonstrate a more equitable distribution. Conversely, “Income share of the bottom 20%” displays an inverse pattern, with greater dispersion signifying varying levels of economic vulnerability. The “GDP per capita growth” plot also reveals substantial variation in economic performance across countries. Finally, the “Global Innovation Index” demonstrates a relatively wider spread, suggesting diverse levels of innovation capacity and performance worldwide. These dispersions highlight the heterogeneity in economic development, income distribution, and innovative capacity across the studied countries.
Creative destruction and positive effect of innovation will happen when the golden triangle sufficiently meets the necessary conditions. The golden triangle consists of three sides: State, Markets and Civil Society. In this research, the index of the State will be measured by the share of government expenditure (%GDP). The market index is measured using economic Freedom Index. EIU Democracy Index has also been used to measure civil society. But it is necessary to create a composite index of these three variables that can show the size of the golden triangle. For this purpose, it is assumed that each of these values (which are between 0 and 100) is the size of one of the sides of the golden triangle for each country in each year. According to the lengths of the three sides (value of three index) of the golden triangle, and using Heron’s law,5 the area of the golden triangle has been calculated for each country in each year. In this research, this variable is introduced to show the “Golden Triangle”. The figure 4 shows the results of estimating the Golden Triangle Index for the sample countries in the years 2013-2022. According to this Figure, it can be seen that the dispersion of the Golden Triangle Index for countries during this period has had many differences. According to the descriptive statistics in Table 1, it can also be seen that Golden Triangle index, with a mean of 562.4 and a standard deviation of 318.3, exhibits a broad range from 30.6 to 1580.7.
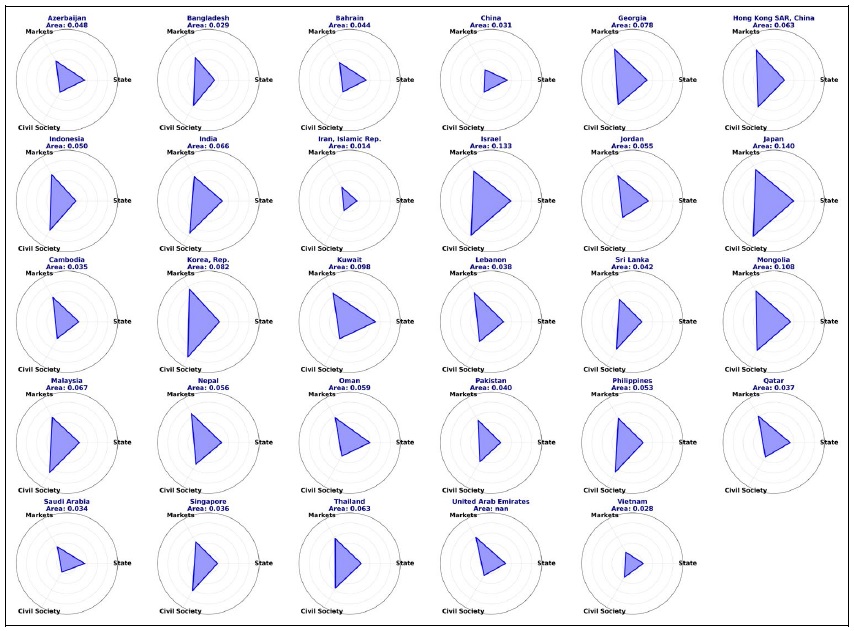
In addition, the set of figure 5 also shows the average area of the Golden Triangle for each country (in the years 2013-2022). The figure presents radar charts visualizing the relative influence of different actors (State, Markets, and Civil Society) within various countries. The area enclosed by the plotted shape indicates the overall level of influence of these actors within that country's context. Larger areas suggest a greater aggregate golden triangle. The shape of the enclosed area reveals the balance of power among these actors; for instance, a shape skewed heavily towards the “State” axis indicates a dominant role of the government, while a more balanced shape suggests a more even distribution of influence. Comparing the charts across different countries highlights variations in the interplay and relative importance of state power, market forces, and civil society engagement. Some countries demonstrate a strong state presence, while others show a larger role for markets or a more prominent civil society.
In the concepts presented about the Golden Triangle, it was found that in addition to the importance of the area of this triangle, the balance of power at the three vertices of the triangle will also be an important and significant indicator. To measure the balance of power at the three vertices of the triangle, we use the standard deviation index between the three Variables: State, Civil Society, and market for each year and each country in the sample. Figure 4.b shows the dispersion of this variable, which we will henceforth denote as
5)Heron’s formula, formula credited to Heron of Alexandria for finding the area of a triangle in terms of the lengths of its sides. In symbols, if
V. Results
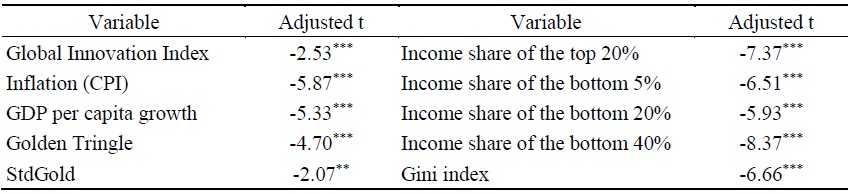
First, to estimate the mode, a stationary test is performed for the variables. Table 2 shows the results of the stationary Levin?Lin?Chu test. In the provided table, the negative t-statistics for all variables indicate that the null hypothesis of a unit root (non-stationarity) is rejected at the 1% significance level. This means that all the variables are stationary.
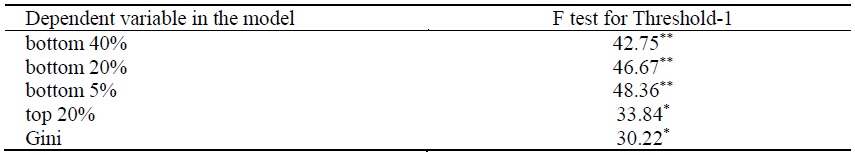
The threshold effect test (table 3) was conducted to assess the presence of a regime-switching mechanism in the PSTR model, where the relationship between the dependent and independent variables may change at specific threshold levels. The results confirm the existence of a significant threshold across all models with different dependent variables, indicating that the data exhibits non-linear dynamics. This suggests that the impact of the explanatory variables varies depending on whether the threshold variable falls below or above a certain critical value, highlighting the importance of considering regime-dependent behavior in the analysis.
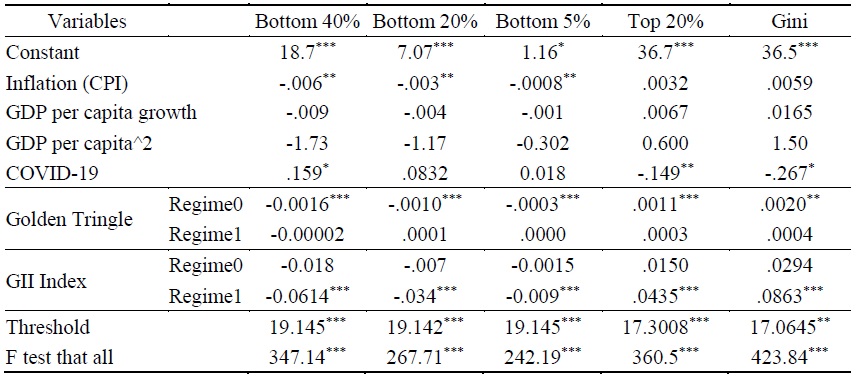
The results of the Panel Smooth Transition Regression (PSTR) model highlight the nuanced relationships between the chosen variables and income inequality, offering insights into the role of innovation, economic conditions, and the Golden Triangle in shaping inequality dynamics. The table 4 presents the results of the PSTR model estimation, where the dependent variables include various income distribution measures (bottom 40%, bottom 20%, bottom 5%, top 20%), the Gini coefficient. The analysis incorporates key explanatory variables such as inflation (CPI), GDP per capita growth, square of GDP per capita, the COVID-19 period, the Golden Triangle, and the Global Innovation Index (GII). As previously stated, in this model, the variable
According to the results presented in Table 3, the significant thresholds confirm the presence of non-linear relationships in all models, indicating regime-switching behavior in the effects of the explanatory variables. The F-test results strongly support the overall significance of the models, demonstrating that the PSTR approach effectively captures the dynamics of income distribution and inequality.
Inflation has a negative and significant impact on the income shares of the bottom percentiles, suggesting that rising prices contribute to a decline in their relative earnings. However, its effect on the top 20% and inequality measures is statistically insignificant. The results indicate that an increase in inflation has led to a reduction in the income share of lower-income groups. The largest decline is observed for the bottom 40%, where a one-point increase in inflation is associated with a 0.006 percentage point reduction in their income share. A possible explanation for this pattern lies in the borrower-lender dynamics and the structure of household debt. Low-income households often have higher debt burdens relative to their earnings and limited access to financial instruments that hedge against inflation. If inflation erodes the real value of wages but nominal debt obligations remain fixed or rise due to inflation-driven interest rate adjustments, lower-income households may experience a disproportionate loss in income share. Moreover, if wage adjustments do not keep pace with inflation, especially for lower-income earners in informal or less protected sectors, their real incomes decline more severely than those of higher-income groups. The insignificant effect of inflation on the income shares of the top 20% and overall inequality suggests that wealthier households are better positioned to mitigate inflationary pressures. They are more likely to hold assets that appreciate with inflation, such as real estate and equities, and have greater access to financial instruments that preserve purchasing power (Deaton, 1997). These results align with existing literature that highlights the asymmetric effects of inflation on income groups, where lower-income households bear a greater burden due to rigid earnings and higher relative debt exposure (Ravallion, 2011; Doepke and Schneider, 2006; Erosa and Ventura, 2002).
GDP per capita growth does not significantly influence income distribution. However, it can be implicitly seen that the effect of GDP per capita growth on the share of low-income groups is negative and causes inequality to increase. Therefore, it can be implicitly expected that economic growth in this sample has come at the cost of increasing inequality.
The COVID-19 period shows mixed effects: it significantly increases income shares of the bottom 40%, but reduces the share of the top 20% and decreased inequality as measured by the Gini coefficient. These results reflect the uneven economic impacts of the pandemic across different income groups and its contribution to widening inequality. During this period, governments provided significant welfare support to vulnerable groups. This support was an important factor in increasing the income share of low-income groups. On the other hand, the damage to businesses, whose owners were often from the upper income deciles of society, caused inequality to decrease overall. This result can be attributed to several reasons. 1. Redistribution through Welfare Policies: The pandemic prompted unprecedented fiscal interventions by governments worldwide, including direct cash transfers, expanded unemployment benefits, food assistance programs, and other targeted welfare measures. These policies significantly boosted the disposable incomes of low-income households, leading to an increase in their income share. This finding aligns with Blundell et al., who demonstrated that targeted fiscal policies during the pandemic significantly reduced income inequality (Blundell et al., 2022). 2. Impact on Labor Markets: Low-income groups are often employed in essential sectors, such as healthcare, logistics, and food services, which remained operational during the pandemic. This relative stability in employment for certain low-income workers contrasts with the significant job losses and revenue declines experienced by businesses owned by higher-income individuals in industries like tourism, luxury goods, and high-end services. This sectoral divergence contributed to the observed reduction in inequality. Palomino et al. confirmed that this segmentation in the European labor market temporarily reduced inequality during the pandemic (Palomino et al., 2021). 3. Capital vs. Labor Dynamics: theories regarding returns on capital and labor, such as those proposed by Piketty (Piketty, 2014) in Capital in the Twenty-First Century, suggest that economic shocks can temporarily reduce returns to capital and curb rising inequality. Empirical evidence on declining returns to capital during the COVID-19 pandemic supports this argument. 4. Behavioral Economics and Precautionary Savings: Low-income households experienced an increase in disposable income not only from direct transfers but also from reduced discretionary spending during lockdowns. Meanwhile, high-income households faced declining business profits, investment losses, and disrupted consumption patterns for luxury goods and services. These behavioral adjustments amplified the temporary redistribution effects.6
The Golden Triangle variable exhibits a regime-dependent effect. In Regime 0, it negatively impacts lower income shares and inequality measures, while in Regime 1, its influence becomes less pronounced or even positive. This suggests a shift in its effectiveness depending on the threshold level.
Innovation demonstrates stronger negative effects on lower income shares in Regime 1, while positively contributing to the income share of the top 20% and inequality measures. This finding highlights the role of innovation in driving economic divergence, benefiting higher-income groups disproportionately in Regime 1. As stated in the idea based on the Golden Triangle, it is expected that when the three main pillars of the Golden Triangle (State, Market and Civil Society) grow unbalancedly (i.e. the standard deviation of the three variables together is high, in other words, larger values for
The findings underline the nuanced effects of innovation on income distribution, with significant implications for economic theory and policy design. Innovation, while often hailed as a driver of economic growth, has a dual-edged impact on inequality depending on the structural balance of institutions, as captured by the “Golden Triangle” framework. The results are consistent with both theoretical predictions and empirical studies, offering a robust foundation for interpretation. The stronger negative effects of innovation on lower income shares (bottom 40%, bottom 20%, and bottom 5%) in Regime 1 reflect the phenomenon of “economic divergence”, where innovation disproportionately benefits higher-income groups. This outcome aligns with the skill-biased technological change (SBTC) hypothesis, which posits that innovation tends to favor skilled workers and capital owners, thereby widening income disparities. Studies such as Autor et al. have demonstrated that technological advancements often replace low-skill labor, while creating lucrative opportunities for high-skill workers, exacerbating inequality (Autor et al., 2008). The concept of the “Golden Triangle” (state, market, and civil society) introduces a critical dimension to understanding innovation’s impact. When the three pillars are unbalanced (as indicated by a high standard deviation in StdGold, exceeding the threshold of 19.145), innovation appears to deviate from its potential to foster creative destruction—a process where outdated economic structures are replaced by more productive ones. Instead, innovation in such contexts reinforces existing power dynamics, benefiting high-income groups at the expense of lower-income populations. Theoretical work by Acemoglu and Robinson (2012) supports this interpretation, arguing that institutional imbalances often lead to “extractive” economic activities, where innovation benefits entrenched elites rather than fostering broad-based economic progress. The observed increase in both Gini coefficients and the Absolute Gini under Regime 1 reflects the inability of innovation to promote equitable growth when institutional imbalances are pronounced. This outcome is consistent with findings from Aghion et al., who argue that the impact of innovation on inequality is mediated by the strength of redistributive institutions (Aghion et al., 2021). In environments where markets dominate over state and civil society, innovation amplifies wealth concentration. The distinction between “creative destruction” and “rent-seeking innovation” is critical in this analysis. When institutional imbalances are high, innovation tends to align with rent-seeking behaviors, where economic gains are captured by incumbents rather than being distributed across society. Studies by Schneider highlight how innovation, in such contexts, often serves to entrench existing economic hierarchies rather than disrupting them (Schneider, 2018). The findings emphasize the importance of balanced institutional growth for fostering inclusive innovation. Policies that strengthen state capacity, regulate markets, and empower civil society are critical for ensuring that innovation drives inclusive growth rather than exacerbating inequality. For example, Rodrik argues that balanced institutions act as a filter, enabling innovation to contribute to productivity while mitigating its adverse distributive effects (Rodrik, 2015).
To ensure the absence of endogeneity in the model, three instrumental variables were selected given the data limitations, and the model was estimated using the instrumental variable (IV) approach. The primary instrumental variable chosen was High-technology exports (% of manufactured exports). As shown in Table 5 and 6, across all model specifications, the results of the endogeneity test (i.e., the statistical significance of the residuals of the main endogenous variable obtained from the 2SLS regression with the instrumental variable) indicate that endogeneity is not a concern in the model. The coefficients are insignificant, suggesting that the endogenous regressor does not exhibit systematic correlation with the error term. The results of the instrumental variable (IV) regression diagnostics indicate that the chosen instrument is valid and strong. The first-stage F-test and the Cragg-Donald F-statistic both have a high value of 135.27, which significantly exceeds the critical threshold for weak instruments (16.38 is Stock-Yogo critical values), confirming that weak identification is not a concern. Additionally, the Anderson LM test for underidentification yields a highly significant value (92.75, p < 0.01), rejecting the null hypothesis that the model is underidentified and affirming that the instrument provides sufficient variation for identification. The endogeneity test results for all dependent variables suggest that endogeneity is not a major issue, as none of the test statistics are significantly different from zero. These findings collectively support the validity and relevance of the instrument used in the model. This provides strong evidence that the instruments are relevant and sufficiently correlated with the endogenous variable. To further verify the robustness of these findings, two additional instrumental variables were tested: A. Secure Internet servers (per 1 million people) and B. Individuals using the Internet (% of population); In both cases, the results remained consistent, reinforcing the validity of the initial conclusions regarding endogeneity and instrument strength.7 Given these robustness checks and methodological considerations, the results reported in Table 4 can be considered reliable, with no endogeneity bias, making them suitable for inference and policy analysis.
6)While the pandemic-induced decline in inequality appears as a short-term outcome, it does not necessarily reflect a structural change in income distribution. Once pandemic-related support measures phase out, inequality may revert or even worsen. Historical evidence, as highlighted in Atkinson and Piketty’s (2007) work, suggests that short-term shocks often fail to address the underlying drivers of long-term inequality, such as wealth accumulation, education disparities, and unequal access to capital.
7)It is important to note that estimating the Panel Smooth Transition Regression (PSTR) model requires a fully balanced panel dataset with no missing values. Therefore, the selection of instrumental variables was constrained by this requirement. Many other potential instruments, such as: Research and development expenditure (% of GDP) and Patent applications, residents; could not be used due to data availability issues, as their inclusion would have resulted in an unbalanced panel.
VI. Conclusion
The analysis using the PSTR model reveals significant nonlinear effects of innovation on income inequality, mediated by the Golden Triangle’s institutional balance. The findings show that in contexts where the Golden Triangle is balanced, innovation positively impacts income distribution by increasing the income share of lower-income groups and reducing inequality. However, in cases of institutional imbalance—reflected in higher values of the StdGold index—innovation disproportionately benefits higher-income groups, reducing the income share of the bottom deciles and increasing inequality measures such as the Gini index and Absolute Gini. These results align with the Schumpeterian perspective that innovation drives both income concentration at the top and social mobility via creative destruction.
Inflation negatively affects the income shares of lower-income groups, while GDP per capita growth marginally increases absolute inequality without significantly redistributing income across deciles. During the COVID-19 period, targeted fiscal interventions improved the income shares of lower-income groups, reducing overall inequality, as evidenced by decreases in the Gini index.
Crucially, the study confirms that when the balance among the state, market, and civil society is disrupted, innovation fails to foster creative destruction and instead reinforces existing economic hierarchies. These results align with theoretical predictions and provide empirical evidence on the need for balanced institutional growth to mitigate the regressive effects of innovation. The findings emphasize the dual-edged nature of innovation and the critical role of institutional frameworks in shaping its distributive outcomes.
Therefore, the findings of the article indicate that, to harness the benefits of innovation while mitigating its adverse effects on inequality, policymakers must ensure a balanced distribution of power among the state, market, and civil society. This balance enables creative destruction, where innovation disrupts entrenched economic structures and fosters broad-based growth. In conclusion, Asian economies stand at a pivotal moment where rapid technological advancements offer immense opportunities for growth and development. By fostering balanced institutional frameworks and implementing inclusive policies, these countries can navigate the complexities of AI-driven innovation and ensure that its benefits contribute to sustainable and equitable progress.
Our findings indicate that institutional imbalances exacerbate income inequality when innovation is not broadly inclusive. To address this challenge, governments should adopt a multidimensional approach that fosters institutional equilibrium within the Golden Triangle—the state, the market, and civil society—ensuring that innovation contributes to inclusive economic growth rather than deepening disparities. Key policy measures include: 1- Strengthening Institutional Frameworks: Establishing a well-calibrated distribution of power among the state, market, and civil society is crucial to preventing regulatory capture and policy distortions that favor elite interests. Governments should enhance transparency, enforce accountability mechanisms, and promote participatory governance structures to ensure that innovation policies serve the broader public interest rather than reinforcing structural inequalities. 2- Enhancing Access to Innovation Benefits: Innovation-driven growth must be complemented by redistributive policies that ensure equitable access to technological advancements. This includes progressive taxation to redistribute wealth generated by high-growth sectors, universal digital access to bridge the technological divide, and inclusive education and workforce reskilling programs that empower marginalized populations to participate in the innovation economy. By aligning technological progress with inclusive development strategies, governments can mitigate the risk of innovation-driven polarization. 3- Promoting Institutional Flexibility and Adaptive Governance: Rapid technological advancements require institutional structures that can evolve in response to economic and social transformations. Governments should foster public-private partnerships that leverage market efficiencies while ensuring public accountability. Additionally, adaptive regulatory frameworks—such as dynamic competition policies and agile labor market regulations—can help balance the benefits of innovation with social protection measures, preventing the concentration of economic gains among a small segment of society.
By implementing these policies, governments can maintain institutional equilibrium, ensuring that innovation serves as a catalyst for broad-based economic development rather than a driver of socioeconomic fragmentation. A balanced Golden Triangle fosters an ecosystem where technological progress translates into sustainable, equitable growth, reinforcing social cohesion and long-term economic resilience.
Tables & Figures
Figure 1.
Channels of Innovation’s Impact on Inequality and Role of the Golden Triangle
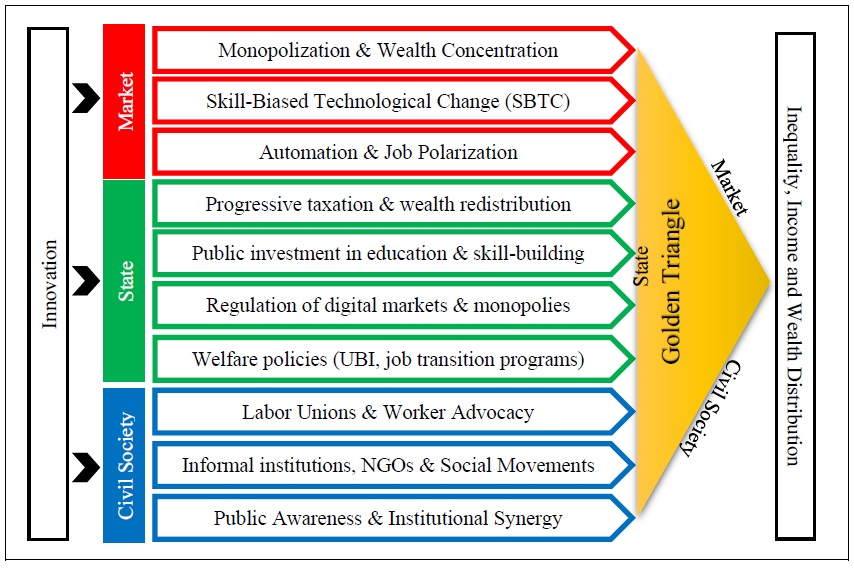
Figure 2.
Smooth Transition Function in PSTR Model
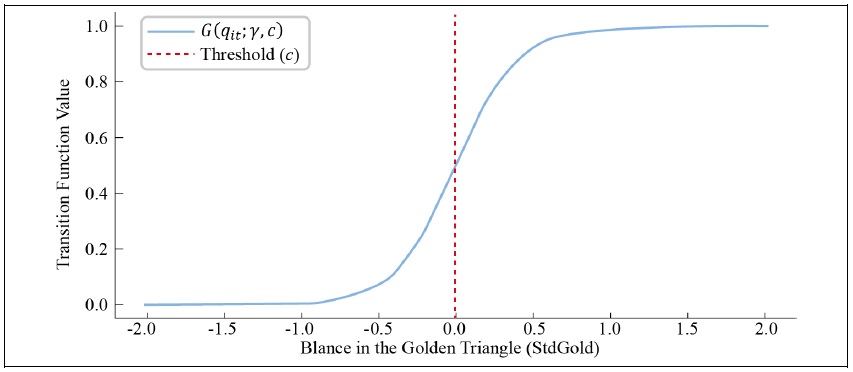
Table 1.
Descriptive Statistics of the Model Variables
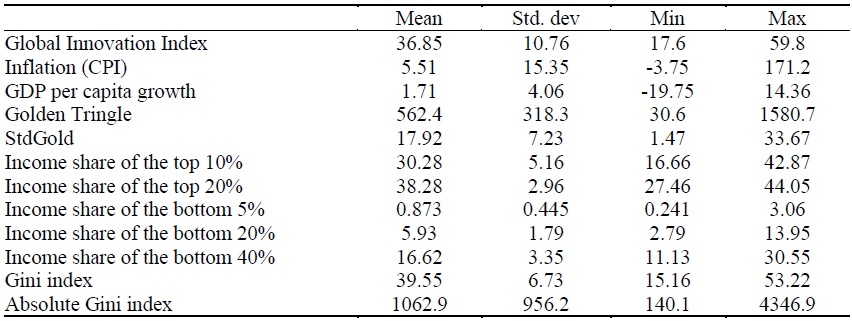
Note: Golden Tringle is Area of a triangle resulting from the measurements of three variables: State, Civil Society, and market for each year and each country. StdGold is standard deviation index between the three Variables: State, Civil Society, and market for each year and each country
Figure 3.
Distribution Diagram (box plot) of Variables for the, for 2013-2022 in the Sample Countries
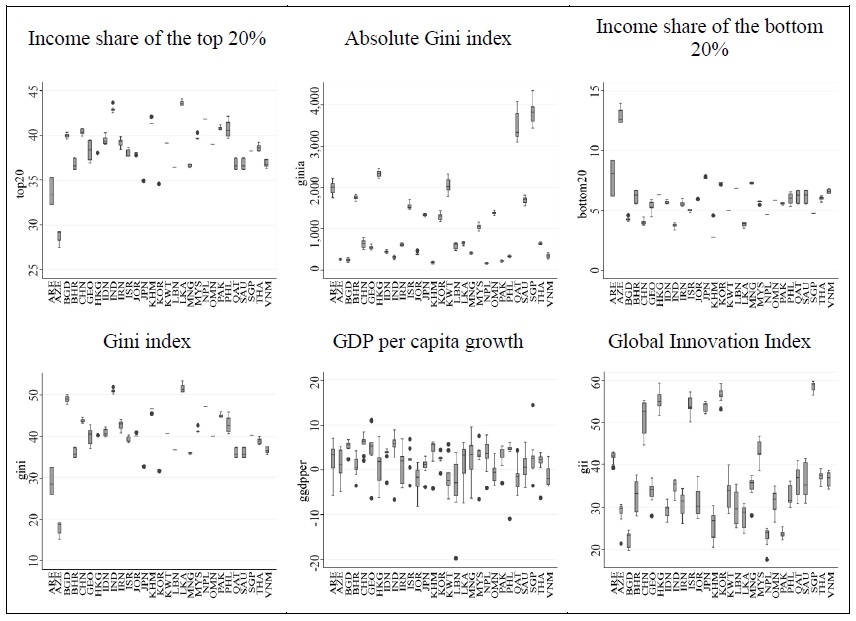
Figure 4.
Distribution diagram (box plot) for the Golden Triangle, Its Standard Deviation, for 2013-2022 in the Sample Countries
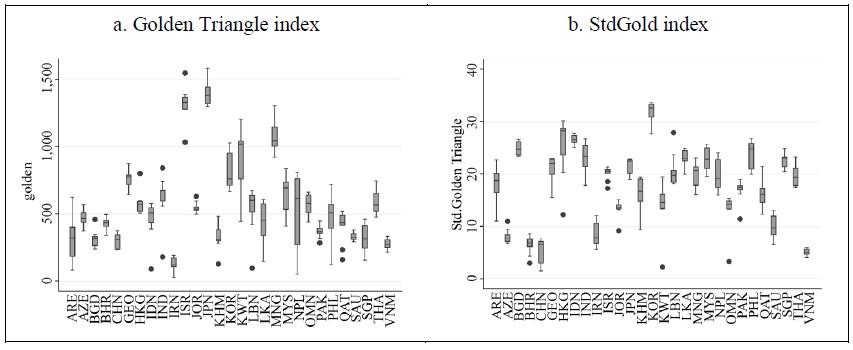
Figure 5.
Average of The Golden Triangle Indicator Area in 2022-2013 for Sample Countries
Source: Research Findings
Table 2.
Levin–Lin–Chu Unit Root Test
Source: Research Findings
Table 3.
Threshold Effect test for Models
Source: Research Findings
Table 4.
PSTR Model for Income Inequality, Threshold Variable is std in Golden Triangle
Source: Research Findings
Figure 6.
Smooth Transition Function in Estimated Model
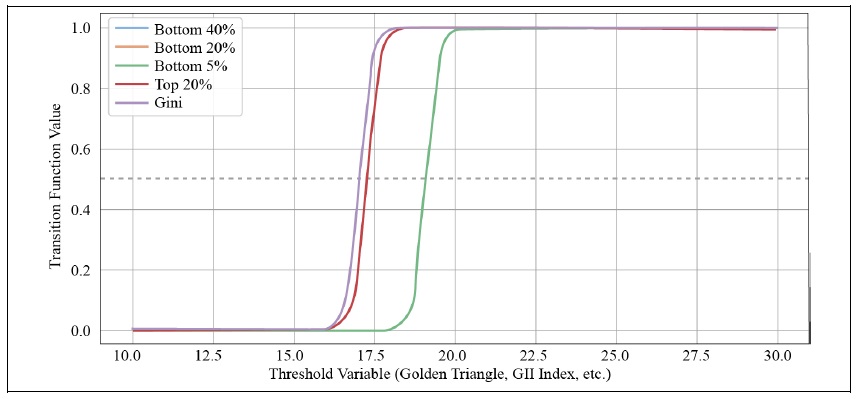
Table 5.
Endogeneity Test and Weak Instruments Test for IV

Table 6.
Weak Instruments Test for IV
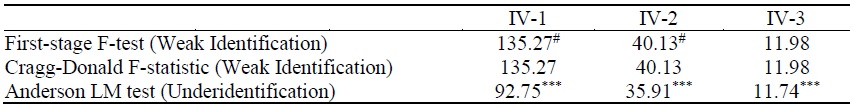
Note: #16.38 (Stock-Yogo, 10%); IV-1: High-technology exports. IV-2: Individuals using the Internet (% of population) and IV-3: Secure Internet servers (per 1 million people).
References
-
Acemoglu, D. 2002. “Technical change, inequality, and the labor market.”
Journal of Economic Literature , vol. 40, no. 1, pp. 7-72.
-
Acemoglu, D. and P. Restrepo. 2020. “The wrong kind of AI? Cambridge Journal of Regions.”
Economy and Society , vol. 13, no. 1, pp. 25-35. -
Acemoglu, D. and D. Autor. 2011. “Skills, tasks and technologies: Implications for employment and earnings.” In Ashenfelter, O and D. Card. (Eds.)
Handbook of Labor Economics , vol. 4, pp. 1043-1171. Elsevier. -
Aghion P., Akcigit U., Bergeaud A., Blundell R., and D. Hémous. 2015. “INNOVATION AND TOP INCOME INEQUALITY.”
National Bureau of Economic Research , MA 02138, Working Paper 21247.http://www.nber.org/papers/w21247 -
Aghion, P., Antonin, C., and S. Bunel. 2021.
The Power of Creative Destruction: Economic Upheaval and the Wealth of Nations . Harvard University Press. -
Alvaredo, F., Atkinson, A. B., Piketty, T., Saez, E., and G. Zucman. 2018.
World inequality report 2018 . Belknap Press. -
Ammari, A., Chebbi, K., and N. B. Arfa. 2023. “How does the COVID-19 pandemic shape the relationship between Twitter sentiment and stock liquidity of US firms?”
International Review of Financial Analysis , vol. 88, 102633.
-
Antonietti, R., Burlina, C., and A. Rodríguez-Pose. 2025. “Digital technology and regional income inequality: Are better institutions the solution?”
Papers in Regional Science , vol. 104, no. 2., 100079.https://doi.org/10.1016/j.pirs.2025.100079
-
Autor, D. H., Levy, F., and R. J. Murnane. 2008. “The Skill Content of Recent Technological Change: An Empirical Exploration.”
Quarterly Journal of Economics , vol. 118, no. 4, pp. 1279-1333.
-
Autor, D., Dorn, D., Katz, L. F., Patterson, C., and J. Van Reenen. 2020. “The fall of the labor share and the rise of superstar firms.”
The Quarterly Journal of Economics , vol. 135, no. 2, pp. 645-709.
-
Bandyopadhyay, S. 2018. “The absolute Gini is a more reliable measure of inequality for time dependent analyses (compared with the relative Gini).”
Economics Letters , vol. 162, pp. 135-139.
-
Beck, T., Demirgüç-Kunt, A., and R. Levine. 2007. “Finance, inequality, and the poor.”
Journal of Economic Growth , vol. 12, no. 1, pp. 27-49.
-
Berman, E., Bound, J., and S. Machin. 1998. “Implications of skill-biased technological change: International evidence.”
Quarterly Journal of Economics , vol. 113, no. 4, pp. 1245-1279.https://doi.org/10.1162/003355398555892
-
Bloom, N., Griffith, R., and J. Van Reenen. 2017. “Do R&D tax credits work? Evidence from a panel of countries 1979-2000.”
Journal of Public Economics , vol. 81, no. 1, pp. 25-49.https://doi.org/10.1016/S0047-2727(00)00132-4 -
Blundell, R., Costa Dias, M., Joyce, R., and X. Xu. 2022. “COVID-19 and Inequalities.”
Fiscal Studies , vol. 43, no. 1, pp. 119-139. -
Brynjolfsson, E., and A. McAfee. 2014.
The second machine age: Work, progress, and prosperity in a time of brilliant technologies . W. W. Norton & Company. -
Card, D. 2001. “The effect of unions on wage inequality in the U.S. labor market.”
Industrial and Labor Relations Review , vol. 54, no. 2, pp. 296-315.
-
Card, D. and J. E. DiNardo. 2002. “Skill-biased technological change and rising wage inequality: Some problems and puzzles.”
Journal of Labor Economics , vol. 20, no. 4, pp. 733-783.https://doi.org/10.1086/342055
-
Cho, D. and K. Lee. 2022. “Population aging and fiscal sustainability: Nonlinear evidence from Europe.”
Journal of International Money and Finance , vol. 126, 102665.
-
Chu, A. and P. Peretto. 2023. “Innovation and inequality from stagnation to growth.”
European Economic Review , vol. 160, 104615.https://doi.org/10.1016/j.euroecorev.2023.104615
-
Crépon, B., Duguet, E., and J. Mairesse. 2013. “Research, innovation, and productivity: An overview of the literature.”
Economics of Innovation and New Technology , vol. 22, no. 6, pp. 507-530.https://doi.org/10.1080/10438599.2013.857095 -
Deaton, A. 1997.
The Analysis of Household Surveys: A Microeconometric Approach to Development Policy . Johns Hopkins University Press. -
Doepke, M. and M. Schneider. 2006. “Inflation and the redistribution of nominal wealth.”
Journal of Political Economy , vol. 114, no. 6, pp. 1069-1097.https://doi.org/10.1086/508379
-
Erosa, A. and G. Ventura. 2002. “On inflation as a regressive consumption tax.”
Journal of Monetary Economics , vol. 49, no. 4, pp. 761-795.https://doi.org/10.1016/S0304-3932(02)00115-0
-
Evangelista, R., Guerrieri, P., and V. Meliciani. 2014. “The economic impact of digital technologies in Europe.”
Econ. Innov. New Technol. , vol. 23, no. 8, pp. 802-824.https://doi.org/10.1080/10438599.2014.918438
-
González, A., Teräsvirta, T., and D. van Dijk. 2005. “Panel smooth transition regression models.”
Working Paper Series in Economics and Finance , 604. -
Greenwood, J. and B. Jovanovic. 1990. “Financial development, growth, and the distribution of income.”
Journal of Political Economy , vol. 98, no. 5, pp. 1076-1107.
-
Kurz, M. 2017. “On the Formation of Capital and Wealth: IT, Monopoly Power and Rising Inequality.” SSRN:
https://ssrn.com/abstract=3014361 -
Kuznets, S. 1955. “Economic growth and income inequality.”
American Economic Review , vol. 45, no. 1. -
OECD. 2021.
R&D and innovation in Asia: Trends and prospects . Organisation for Economic Cooperation and Development. -
Palomino, J. C., Rodríguez, J. G., and R. Sebastian. 2021. “Wage Inequality and Poverty Effects of Lockdown Measures in Europe.”
European Economic Review , vol. 134, 103679. -
Perugini, C. and G. Martino. 2008. “Income inequality within European regions:determinants and effects on growth.”
Rev. Income Wealth , vol. 54, no. 3, pp. 373-406.
-
Piketty, T. 2014.
Capital in the Twenty-First Century . Harvard University Press. -
Piketty, T. and E. Saez. 2013. “Top incomes and the Great Recession: Recent evolutions and policy implications.”
IMF Economic Review , vol. 61, no. 3, pp. 456-478.
-
Putnam, R. D. 2000.
Bowling alone: The collapse and revival of American community . Simon & Schuster. -
Ravallion, M. 2011. “Growth, Inequality, and Poverty: Looking Beyond Averages.”
World Development , vol. 29, no. 11, pp. 1803-1815.
-
Rodríguez-Pose, A. and M. Di Cataldo. 2015. “Quality of government and innovative performance in the regions of Europe.”
J. Econ. Geogr. , vol. 15, no. 4, pp. 673-706.
-
Rodrik, D. 2015.
Economics Rules: The Rights and Wrongs of the Dismal Science . New York: W. W. Norton & Company. -
Schneider, P. H. 2018. “Income Inequality and Innovation.”
Economic Inquiry , vol. 56, no. 1, pp. 488-499. -
Taniguchi, M. and K. Yamada. 2019. “ICT and wage inequality: Evidence from OECD countries.”
Journal of Economic Studies , vol. 46, no. 5, pp. 964-988.https://doi.org/10.1108/JES-09-2018-0334 -
Williamson, J. 1980. “Earnings inequality in nineteenth-century Britain.”
Journal of Economic History , vol. 40, pp. 457-475.
-
Williamson, J. 1985.
Did British Capitalism Breed Inequality? Unwin Hyman. -
Xu, Z. and H. Li. 2020. “Innovation and income inequality: Evidence from developing countries.”
Economic Modelling , vol. 85, pp. 1-12.
-
Zingales, L. 2017. “Towards a political theory of the firm.”
Journal of Economic Perspectives , vol. 31, no. 3, pp. 113-130.