

- EAER>
- Journal Archive>
- Contents>
- articleView
Contents
Citation
| No | Title |
|---|
Article View
East Asian Economic Review Vol. 29, No. 2, 2025. pp. 139-199.
DOI https://dx.doi.org/10.11644/KIEP.EAER.2025.29.2.447
Number of citation : 0View
55
Download
46
Reassessing Services Trade Barriers: Evidence from Turkish Microdata and the STRI Framework
|
|
Ankara University; Ministry of Trade |
|---|

Abstract
This study examines two key challenges in services trade research: the reliability of trade data and the measurement of non-tariff barriers, particularly the Services Trade Restrictiveness Index (STRI). Using firm-level panel data from Türkiye with fixed effects, we show that international data limitations significantly affect empirical results and that the explanatory power of the gravity model declines with more detailed microdata. We also find that the STRI’s link to trade flows is weaker and more sector-specific than assumed, questioning its methodological adequacy. Additionally, ad valorem equivalent (AVE) rates are estimated, revealing moderate barriers for Türkiye’s exports but much higher protection in imports, notably in technical services and transport. The findings highlight the need for sector-specific liberalization and call for next-generation STRI indices that are dynamic, firm-responsive, and modular by regulatory dimension. We advocate for cautious interpretation of STRI-based estimates and encourage the use of microdata across countries to improve services trade analysis and policy design.
JEL Classification: F13, F14, C23
Keywords
Trade in Services, Gravity Model, the Services Trade Restrictiveness Index (STRI), Non-Tariff Barriers, Ad Valorem Equivalents (AVEs)
I. Introduction
Since its formal inclusion in the multilateral trading system during the Uruguay Round (1986–1994), trade in services has expanded rapidly. Over the past three decades, the average annual growth rate of services trade has consistently outpaced the growth of global goods trade and world GDP, reaching approximately 7 trillion dollars. It is conceivable that the services sector could soon account for half of international trade. This potential has motivated countries to incorporate services into multilateral and bilateral trade agreements.
However, the success of such initiatives critically depends on accurately identifying sectoral barriers and assessing their effects on trade flows. Yet, research on services trade consistently points to two fundamental challenges. First, data-related limitations persist: as Miroudot and Shepherd (2015) note, over one-third of global services trade data remains unreported or incomplete. Second, measuring trade restrictions in services remains problematic. Indicators such as the Services Trade Restrictiveness Index (STRI), produced by international organizations to quantify barriers, have been subject to considerable criticism regarding their conceptual soundness and methodological consistency (Gupta et al., 2020). Together, these issues raise serious questions about the reliability of services trade indicators and the robustness of empirical findings based on them.
Against this backdrop, this study addresses two critical and interconnected research questions. First, have existing studies accurately captured the relationship between trade flows and regulatory barriers, given persistent data limitations? Second, how reliable are existing indices such as the STRI in measuring barriers to services trade? Since data shortcomings and methodological flaws could jointly compromise restrictiveness measures, both questions are analyzed together.
To this end, we leverage a newly available, highly detailed firm-level microdata set on Türkiye’s services trade between 2016 and 2022, provided by the Turkish Statistical Institute (TurkStat). Employing a fixed-effects gravity model, we conduct a comprehensive empirical analysis that tests the reliability of existing STRI-based findings under more stringent data conditions. Our microdata set captures bilateral trade at both the country and the detailed sectoral levels, offering a unique opportunity to reassess established empirical relationships.
This paper makes several important contributions to the literature. First, it provides direct empirical evidence on the magnitude and nature of data limitations in services trade, which have long been acknowledged but rarely quantified in previous studies. Second, it demonstrates that the explanatory power of gravity models in services trade diminishes significantly when using more disaggregated and comprehensive data, highlighting the importance of data quality in empirical modeling. Third, it critically evaluates the STRI methodology, showing that the STRI variable effectively explains trade flows only in a limited number of sectors, and with considerable variation in effect sizes—thereby calling into question the index’s broader applicability and validity. Finally, yet importantly, it calculates ad valorem equivalent (AVE) rates for Türkiye’s services trade, revealing a significant asymmetry: while Türkiye faces moderate barriers abroad, it maintains relatively high levels of protection in its domestic services market. This sector-specific analysis offers new insights for trade policy formulation.
The structure of the paper is as follows. Section II reviews the relevant literature. Sections III and IV discuss issues related to services trade data and the STRI approach, respectively. Section V outlines the empirical methodology. Section VI presents the results, including AVE estimations. Section VII concludes with a discussion of policy implications and directions for future research.
II. Literature Review
Despite its growing significance, there is considerably less literature on the factors affecting trade in services compared to trade in goods. One primary reason for this gap is the problematic nature of trade data in services (Hoekman and Shepherd, 2021; Benz et al., 2020). Most studies rely on databases from international organizations such as the WTO, IMF, OECD, or UNCTAD. They often lack long-term data series for countries and sectors, and they frequently use mirror data when adequate statistics are unavailable. Consequently, research typically focuses on limited periods and/or specific groups of countries (Nordås and Rouzet, 2017; Chen, 2024; Benz and Jaax, 2019). Additional data challenges arise when calculating the Services Trade Restrictiveness Index (STRI), which measures barriers to market access. For instance, the partial inclusion of trade in services (Nordås and Rouzet, 2017), reliance on short-term data (Chen, 2024), and non-compliance with international commitments (Borchert et al., 2014) are some reasons why calculating index values for various countries and sectors can be difficult.
Research utilizing aggregate data sets indicates that the typical negative impact of trade barriers in services varies by country and sector (Nordås, 2016; Nordås and Rouzet, 2017; Chen, 2024). These studies typically reference the STRI scores calculated by the OECD to assess restrictions across different service sectors (Grosso and Shepherd, 2008; Nordås and Rouzet, 2017; Rouzet et al., 2017; Benz and Jaax, 2019, 2020; Matuszczak, 2019; Benz et al., 2020; Chen, 2024). In contrast, recent research has emerged that focuses on disaggregated trade data. For instance, Rouzet et al. (2017) utilize microdata from the US and several European nations to explore how restrictions influence the decision-making and operations of trading firms. Benz et al. (2020) reveal that barriers to trade in services disproportionately affect smaller, less productive businesses and first-time exporters, drawing on microdata from the US, Japan, and select European countries. However, similar to prior studies, they also rely on the STRI as a framework for assessing restrictions in the relevant sectors.
Given the constraints mentioned earlier, there is a widespread agreement that studies on services should be expanded to include more trade data and regulatory information (Grosso and Shepherd, 2008; Benz and Jaax, 2019; Benz et al., 2020; Hoekman and Shepherd, 2021). As a result, new studies employing various methodologies have emerged in the last decade to gather comparable information on services trade policies (Benz, 2017; Borchert et al., 2014; Shepherd, 2020). However, alternative methods for measuring trade barriers, such as the Heterogeneity Index and the Services Policy Index (SPI), are also based on the Services Trade Restrictiveness Index (STRI) (Nordås, 2016; Shepherd, 2020; Hoekman and Shepherd, 2021).
When quantifying barriers to trade in services, researchers typically prefer the STRI, especially with longer data series. However, the OECD’s approach has faced criticism due to various conceptual and methodological flaws that impair its effectiveness as a measurement tool. Gupta et al. (2020) raise several key objections: (i) the binary scoring method may not accurately reflect the level of restrictiveness; (ii) the weighting formula used may be problematic, leading to deviations in index values; (iii) the index may not represent the actual situation due to insufficient data; and (iv) several significant regulatory barriers are not accounted for in the STRI methodology. Given these concerns, it may be necessary to significantly revise the STRI values based on recalculations. Nonetheless, many previous studies have based on the STRI approach, which is considered reliable, for analyzing services trade. Therefore, obtaining comprehensive trade data would provide an opportunity to evaluate the STRI approach more thoroughly.
III. Data Issues
The Extended Balance of Payments Services Classification (EBOPS) is a database that compiles data on international services trade by categorizing the balance of payments reported by various countries. This database is developed in collaboration with several international organizations, including the European Statistical Office (EUROSTAT), the OECD, and the UN. EBOPS enables relevant parties, primarily central banks, to conduct advanced data inquiries. An alternative classification system is the Trade in Services by Mode of Supply (TISMOS) dataset, prepared by the WTO. TISMOS provides estimates on services trade across four different categories defined under the General Agreement on Trade in Services (GATS). While EBOPS includes data from approximately 200 countries and 35 sectors (along with their sub-sectors) covering the period from 2016 to 2023, TISMOS encompasses 55 sectors and more than 200 economies and regions, spanning from 2005 to 2022.
Despite their comprehensiveness, these databases may not always provide disaggregated trade data sufficient for thorough analysis. Miroudot and Shepherd (2015), for instance, provide a clear overview of the challenges associated with disaggregated statistics on cross-border services trade. While total services trade data is available for most countries, many lack information on trading partners or sectors. Additionally, even countries that share comprehensive data often struggle to collect detailed statistics. For instance, the sum of bilateral trade data by sector in the OECD database accounts for only an average of 70% of total trade. Consequently, it is likely that discrepancies in estimation results will occur when using databases on services trade provided by international organizations, which may contain incomplete or inconsistent data. To put it briefly, relying on these databases, which may suffer from significant inaccuracies, can lead to variations in estimation results.
The mentioned data limitations can be explained through the example of TurkStat, which derives national services trade statistics from firm-level “microdata” by using targeted surveys. The surveys are typically directed to firms that report cross-border services trade activity in their fiscal tax declarations. This survey-based microdata represents nearly 98% of the total trade while including disaggregated information on exports and imports by partner country and sector, aligned with international classifications such as EBOPS. Access to the microdata is strictly limited due to confidentiality concerns, and it is only available to authorized researchers under specific project-based conditions.
For public dissemination, TurkStat aggregate the microdata into national statistics by imputing the remaining 2% using modeling procedure. These national statistics are then published as “Central Dissemination System Statistics (MEDAS)” in a more aggregated form to protect firm-level information. Due to the limited number of firms running business in certain sectors (e.g., transport), data protection is common to prevent the identification of private enterprises. Therefore, publicly available statistics may diverge from the original microdata, particularly at the sectoral or partner-country level.
A third layer of trade in services data emerges when international organizations such as the WTO, OECD, or UNCTAD gather cross-country comparable databases. These institutions rely on national statistics (e.g., MEDAS) as their primary input, but must often adjust for gaps caused by confidentiality constraints. To fill in missing bilateral flows, for instance, they frequently use mirror data from partner countries. This practice, while pragmatic, leads to further discrepancies between national and international datasets. Additionally, Türkiye’s tourism sector is excluded from the MEDAS figures when compared to international databases.
Consequently, we face three distinct data sources for analyzing services trade: microdata, national statistics, and international databases. Although each is based on the same main source, methodological differences, data privacy, and data imputation naturally introduce substantial variation in the reported trade figures. Accordingly, empirical findings from studies utilizing different datasets can yield divergent conclusions—an outcome that is not only unsurprising but also methodologically significant. Being aware of these inconsistencies is important for both policy makers and researchers who want to interpret or compare analytical results based on services trade data.
Figure 1 compares Türkiye’s bilateral trade with its trading partners using various data sources (WTO, MEDAS, and microdata). The figure clearly shows that these sources provide conflicting export and import figures for Türkiye. For instance, the discrepancies between the WTO and MEDAS data amount to 19.37 billion dollars for exports and 28.56 billion dollars for imports in total, with variations of up to 2.22 and 0.96 billion dollars, respectively, on a country-by-country basis. Additionally, there is no information on imports from or exports to Germany, Spain, the United Arab Emirates, Russia, Switzerland, or China. This statistical inconsistency arises not only from the absence of data on the tourism sector but also from missing information overall.
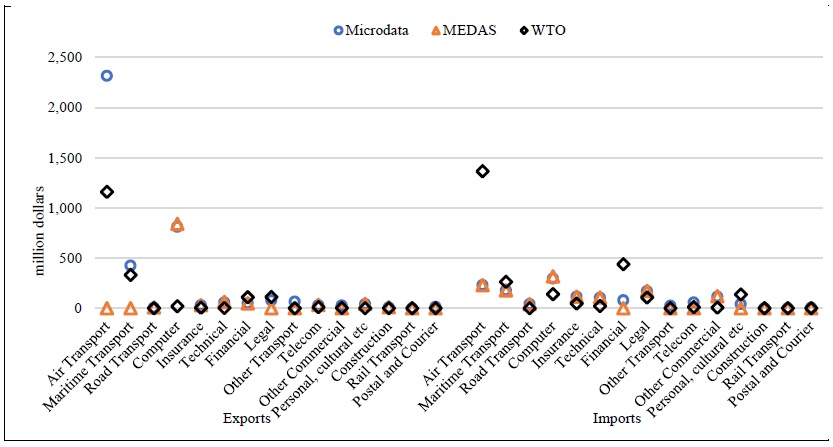
The differences in export and import statistics by sector, as reported by the microdata, MEDAS, and WTO, can be as high as 9.15 billion dollars in exports and 6.31 billion dollars in imports, as illustrated in Figure 2. The total discrepancy amounts to 13.46 billion dollars for exports and 9.09 billion dollars for imports. However, the tourism industry cannot fully explain these inconsistencies in sectoral data. For example, there are gaps in trade statistics for road, rail, and other transportation modes. In summary, the trade figures are inconsistent both at the sector level and by country.
There are significantly larger disparities in the overall export and import figures when examining country-sector data. For instance, in the case of Türkiye’s sectoral services trade with the United States and the United Kingdom, noticeable differences exist between the MEDAS and WTO statistics, along with a substantial amount of missing data (Figures 3 and 4). These figures clearly show the fact that accessing to MEDAS is limited due to data confidentiality, which could ultimately complicate economic analysis within the services sector at the country-sector level.
The data issues, however, are not only attributable to a single country or data provider, but instead reflect broader structural challenges in the collection and dissemination of services trade data. Significant data constraints across nations and industries persist despite efforts to standardize and enhance the quality of international services trade statistics. We create a comparative table (Table 1) using the WTO database, which shows 2023 export values by EBOPS sector for a few large trade economies, to highlight the limitations. For each reporting country, the table includes two key indicators: (i) the sum of exports reported to individual trading partners by sector (the column of sum of exports), and (ii) the total exports to the world as reported in aggregate (the column of world exports). While one would expect these two measures to align closely, in practice they often differ greatly. In the associated table (Table 1), sub-sectoral data are revealed only for the transportation sector. This choice is made for illustrative purposes, as it is a key component of services trade and often displays noteworthy reporting discrepancies. Presenting sub-sectoral details for all EBOPS categories would significantly expand the table and reduce its readability. Therefore, for practical and presentational clarity, the focus is restricted to transportation sector as a typical example of broader data issues.
For instance, Germany’s exports to partner countries in 2023 sum to approximately 226.73 billion dollars, whereas its aggregate exports to the world amount to 438.89 billion dollars. This divergence echoes the fact that bilateral data are often incomplete or missing altogether for certain partner-country-sector combinations. Moreover, in some cases, the trade data are absent at the country level. For example, South Korea and India have no detailed partner-level services exports data for many EBOPS categories. Their bilateral data can only be approximated using mirror data, which are subject to additional methodological uncertainty. Even when sectoral data are available, the sum of sector-specific exports often does not match the overall total for a given country. In the case of the United States, for example, total financial services exports to individual partners in 2023 amount to 119.60 billion dollars, while the reported aggregate is 175.46 billion dollars.
Further complications arise when examining data at the sub-sectoral level such as transport. While countries may report values for the overall transport sector, data for its constituent sub-sectors (e.g., air, sea, and other modes) are often missing or reported as zero. For example, Germany reports 33.98 billion dollars of total transport exports but does not provide any corresponding data for its sub-sectors. Ireland, on the other hand, does provide sub-sectoral values, but they are not internally consistent with the sector aggregate. Other economies, such as Spain, South Korea, and India, lack sub-sector data entirely, and such information can only be inferred indirectly from the mirror data provided by their trading partners.
These examples emphasize a broader systemic issue: limitations in services trade statistics are not confined to a handful of countries or sectors, but rather constitute a comprehensive challenge that affects the comparability of international services trade flows.
IV. Services Trade Restrictiveness Index (STRI)
The gravity model, a prevalent analytical tool in international trade, is employed not only for examining trade in goods but also for investigating the determinants of trade in services. In its traditional formulation, the gravity model elucidates bilateral trade flows by considering the economic size and geographical distance between trading partners. Various physical and economic characteristics of countries are incorporated as explanatory variables, including but not limited to gross domestic product (GDP), population, per capita income, the presence of a common language, historical ties, and existing economic or trade agreements. This model, while fundamentally grounded in geographic and spatial parameters, reflects a broader range of influences that shape trade dynamics.
In the context of goods trade, tariff rates serve as crucial explanatory variables, effectively quantifying the level of protectionism exercised by nations. These rates are particularly advantageous for econometric analysis due to their accessibility and standardization at both country and sectoral levels, typically represented in an
The OECD has been quantifying regulatory barriers affecting trade in services since 2014 through the STRI. This index encompasses data from 50 countries across 22 industries and categorizes regulatory obstacles into five distinct policy domains: barriers to competition, other discriminatory measures, restrictions on market entry conditions, limitations on the free movement of persons, and regulatory transparency. The OECD’s approach allows for a quantification of regulatory barriers ranging from completely liberal (0) to fully restrictive (1), while also accounting for the significance and hierarchy of various regulations. In parallel, the WB calculates its own version of the STRI, providing comparable insights into trade restrictions affecting 103 countries across five key sectors—namely telecommunications, banking, transportation, retail, and professional services—along with various modes of supply, including cross-border trade, consumption abroad, commercial presence, and the presence of natural persons. It is noteworthy, however, that the WB’s estimations are limited only to the years 2016 and 2022. This multidimensional approach to analyzing regulatory and non-tariff barriers underscores the complexity inherent in assessing trade in services, revealing the nuanced interplay of various factors that govern international trade practices.
Despite employing analogous methodologies, the OECD and the WB yield contradictory findings regarding protectionism within the services sector. Table 2 elucidates a sector-by-sector comparison of the index values pertaining to Germany, France, and Türkiye. Over the period from 2016 to 2022, the OECD’s average STRI demonstrated relatively less fluctuation compared to the WB’s calculations. Notably, the OECD’s average STRI for Türkiye remained unchanged throughout this timeframe, while a slight increase is observed for Germany and a decrease for France. Conversely, the average STRI values reported by the WB for all three countries show a general upward trend. This divergence implies that the OECD posits a stable level of protectionism in the services sector, whereas the WB indicates an escalation in protective measures. The coefficient of variation, which illustrates the distribution as a percentage difference from the mean, further underscores that the WB’s index values exhibit greater variability than those of the OECD. Consequently, the indices derived from these two institutions reflect differing extents of protectionism within the services sector. This variation necessitates careful consideration of index selection, as it significantly influences the assessment of how non-tariff barriers might influence trade within the services domain.
The OECD index, notable for its extended historical data series, is often preferred in academic literature as a benchmark for evaluating non-tariff measures in the sector. Nevertheless, its robustness is undermined by various conceptual and methodological challenges. As outlined by Gupta et al. (2020), the dual scoring methodology may inadequately capture the restrictiveness of trade measures, while the weighting formula employed may lead to discrepancies in index values. Moreover, the index may fail to accurately represent the realities of specific sectors due to potential inaccuracies in the underlying data. The authors also contend that the STRI does not adequately account for significant regulatory barriers that affect service trade. Consequently, they advocate for a downward revision of the OECD index values for India and a substantial upward adjustment for the sample countries and sectors presented in Table 3.
While the OECD’s STRI has known limitations—such as imperfect ability to mirror
Prior research has estimated the impact of trade in services utilizing the OECD index, despite recognizing significant methodological objections. The validity of these research conclusions may be further called into question if the critiques pertaining to the STRI methodology are substantiated, alongside prevailing issues related to trade data accuracy. In this context, as highlighted by Nordås and Rouzet (2017), our investigation provides an opportunity to critically evaluate the extent to which sector-specific trade barriers in services are effectively captured by the STRI. This assessment is essential for refining our understanding of trade impediments in the services sector and for informing policy decisions aimed at enhancing trade liberalization.
V. Data and Methodology
Studies on international trade recurrently utilize the gravity model to identify the factors that influence trade flows of services (Grosso and Shepherd, 2008; Benz, 2017; Nordås and Rouzet, 2017; Matuszczak, 2019; Hoekman and Shepherd, 2021; Nordås, 2023; Chen, 2024). As a result, we estimate a gravity model of trade in services using the Poisson Pseudo Maximum Likelihood (PPML) estimator, with partner country, sector, and time fixed effects. The dependent variable
where:
•
•
•
•
•
•
•
•
•
•
The model facilitates the estimation of exports, imports or bilateral trade of services both as a collective entity and for each sector (
The application of fixed effects (FE) helps address unobserved heterogeneity. Year fixed effects control for global shocks (e.g., COVID-19, global services demand); country fixed effects account for unobservable country-specific trade characteristics; and sector fixed effects capture persistent differences across services industries. While FE improve model consistency, they also absorb variation that may otherwise have been attributed to key regressors—particularly in granular samples with limited within-group variation.
The trade data utilized in this analysis is sourced from the TurkStat micro-database, which aggregates statistics based on domestic enterprises categorized by trading countries and sectors. The bilateral trade data encompasses service modalities defined by the General Agreement on Trade in Services (GATS), specifically: cross-border supply (Mode 1), consumption abroad (Mode 2), and movement of persons (Mode 4).2 It is important to note that the tourism sector is excluded from the analysis under Mode 2. Additionally, the microdata set includes comprehensive trade statistics, thereby negating the necessity for employing alternative methods such as mirror data to fill in any missing values. The regression estimates are confined to 7 main sectors and 12 sub-sectors across 205 countries for the period spanning 2016 to 2022.3 The STRI scores for main sectors such as “SC-Transport”, “SI-Telecommunications, computer and information”, and “SJ-Other business”—which are not directly calculated by the OECD—are re-estimated through the application of trade weights, utilizing the index values of their corresponding sub-sectors. The relevant EBOPS sectors associated with the STRI are detailed in Table 4. Additional explanatory variables incorporated in the model are obtained from the CEPII Gravity Data Set.
In this study, we utilize three distinct samples to address the research question regarding the sensitivity of services trade estimations to data sources. The first is based on national statistics (i.e., MEDAS), while the other two samples are derived from firm-level microdata. Although international datasets are considered, they are ultimately excluded due to the limited availability of disaggregated information. Both international and national datasets often suffer from missing values—primarily due to data privacy—making them less appropriate for granular analysis compared to microdata. The principal goal of the study is to assess whether different datasets yield varying results when applied to the same empirical gravity model framework. To this end, the construction of each sample is designed to reflect both data availability and the granularity of sectoral information.
Accordingly, Sample-1 is established based on MEDAS statistics and is limited to country-level analysis due to the incomplete coverage of sectoral data. This sample allows for estimations without accounting for sectoral heterogeneity, providing a benchmark for comparing more detailed samples. Samples 2 and 3 are constructed using firm-level microdata, considering the structure and availability of the STRI methodology. Since STRI values are available only for 7 primary sectors and 12 sub-sectors, Sample-2 includes firms classified under broader, aggregate sectors, while Sample-3 comprises firms categorized under more detailed sub-sectors.
While Sample-1 helps a baseline analysis at the national level, Sample-2 and Sample-3 enable more refined analyses at both the country and sector levels. The essential function of Sample-2 and Sample-3 is to examine whether STRI values are statistically associated with services trade flows within a gravity model framework. In contrast, Sample-1 is primarily used to assess whether the choice of dataset (national MEDAS statistics vs. microdata) has a substantive impact on estimation results. This multi-sample design, therefore, allows for a robust evaluation of how data granularity and source influence the measurement of policy effects in services trade, providing empirical insights into the reliability and comparability of different data sources.
Table 5 provides a comprehensive overview of the descriptive statistics for both independent and explanatory variables across the samples. Notably, the number of observations in Samples 2 and 3 is significantly higher than that in Sample-1, attributable to the extensive nature of the microdata. Furthermore, we observe that the values of the STRI variable exhibit greater variability within Sample-1, while the characteristics of the CEPII variables remain consistent across all three samples, which is an expected outcome.
In the study, the
The power of the tariff equivalent (
2)The GATS framework also includes commercial presence (Mode 3) within its four recognized modes of service supply.
3)The “main sectors” refer to broad service categories based on the Extended Balance of Payments Services Classification (EBOPS). Specifically, we group the following EBOPS codes as main sectors: SC (Construction services), SE (Insurance and pension services), SF (Telecommunications services), SG (Computer services), SI (Financial services), SJ (Other business services) and SK (Personal, cultural, and recreational services). The “sub-sectors” are defined as more granular service items within these main categories and include the following EBOPS codes: SC1 (Sea transport), SC2 (Air transport), SC3B (Rail transport), SC3C (Road transport), SC3G (Other supporting and auxiliary transport services), SC4 (Postal and courier services), SJ211 (Legal services), SJ3 (Technical, trade-related and other business services), SJ34 (Trade-related services), SI1 (Telecommunications services), SI2 (Computer services) and SI3 (Information services).
VI. Estimation Results
1. Pooled Results
This study investigates how the estimation of gravity models in services trade responds to different data sources and sectoral granularity levels by employing three distinct datasets as explained previously: (i) aggregate country-level data based on Turkish national statistics or MEDAS (Sample-1), (ii) firm-level microdata aggregated at the sector level (Sample-2), and (iii) firm-level microdata disaggregated to sub-sectoral level (Sample-3). The central research question concerns whether the empirical sensitivity of trade estimates, particularly with respect to the OECD-STRI, could be significantly shaped by the type and resolution of data used.
The proposed gravity model (Equation-1) is estimated across all three samples utilizing the PPML method. The model incorporates both time and country fixed effects for Sample-1 while including time, country and sector fixed effects for Samples 2 and 3. The estimation results are presented in Tables 6-8, respectively.
Across all specifications, the estimated coefficients on the STRI index—interpreted as the substitution elasticity of services trade with respect to regulatory restrictiveness—show significant variation across datasets. In Sample-1, a 1% increase in the STRI index is associated with a 5.62% decline in bilateral services trade, a 5.06% drop in exports, and a 5.22% decrease in imports, although significance depends on the FE structure (significant only under year FE for exports and bilateral trade; only under country FE for imports). In Sample-2, the negative STRI coefficients are smaller in magnitude: 2.43 for bilateral trade, 4.47 for exports, and 3.30 for imports (significant only when year-country-sector FE are used). In Sample-3, the STRI coefficients are either statistically insignificant or counterintuitively positive.
The estimated STRI coefficients in Sample-1 indicate a highly elastic response of services trade to regulatory barriers. The results from Sample-2 still confirm the trade-dampening effect of STRI but suggest a somewhat less dramatic response when sectoral variation is incorporated. The statistically insignificant coefficients or coefficients that are either positive or anomalous in sign in Sample-3 reflect poor alignment between the STRI index and the sub-sectoral data, which raise concerns about the robustness of STRI as a measure when applied to highly disaggregated data. These inconsistent results likely stem from the inability of STRI—designed for broad sectoral comparisons—to capture the within-sector heterogeneity that exists at the firm or sub-sector level. Moreover, the large discrepancies in estimated coefficients highlight the limitations of using a single STRI index for highly disaggregated data. At the sub-sectoral level, firm-level trade flows may be driven by contract-specific, firm-level, or intangible-service attributes not captured by national regulatory indices. The results suggest that the STRI, while effective at macro-sectoral levels, may be inappropriate for firm-level empirical models.
The STRI coefficients estimated in this study are largely consistent with the broader empirical literature. Previous research utilizing the STRI as an explanatory variable has yielded a range of estimation results, reflecting the complexity and variability inherent in assessing trade restrictiveness. Further examination highlights the variability of findings across different countries and economic regions. Sample-1 coefficients (-5.62 to -5.06) surpass those reported by Benz and Jaax (2019), who find STRI elasticities of -4.12 for exports and -3.88 for imports. The results also exceed the value (-3.27) reported by Benz et al. (2020). Conversely, Nordås (2023) asserts that the EU’s services trade with India has a strikingly high STRI coefficient of -7.30. Sample-2 results (-4.47 for exports and -3.30 for imports) align more closely with other studies such as Nordås and Rouzet (2017) who identified a noteworthy export coefficient of -1.89 or Chen (2024) who employs a fixed effects model, arriving at estimated coefficients approximately -2 for both imports and exports. Sample-3’s weak results mirror those of Matuszczak (2019), who also find STRI coefficients to be insignificant when firm and country fixed effects are applied. This consistency strengthens the interpretation that STRI’s effectiveness is sensitive to the level of data aggregation. Meanwhile, the calculations in this study, ranging from -5.62 to -3.30, appear to be considerably more negative than those reported in previous studies on Türkiye, where the STRI coefficient typically falls between -1.61 and -1.36 (European Commission, 2016; Dincer and Tekin-Koru, 2020). This discrepancy may indicate a potential overestimation of trade restrictiveness effects or reflect differences in data granularity and model specification.
On the other hand, positive and statistically significant STRI coefficients, although counterintuitive, are common in empirical trade studies. Several potential explanations exist. First, STRI values may not accurately capture the true regulatory barriers faced by specific firms or sub-sectors, and therefore, inconsistent classification of services activities may introduce bias. In addition, in some cases, regulations classified as restrictive might actually facilitate trade by reducing uncertainty or improving service quality, leading to a paradoxical positive coefficient (Francois and Hoekman, 2010). Lastly, when STRI data are utilized at levels finer than they were designed for (e.g., sub-sectors in Sample-3), the index may not meaningfully reflect trade frictions, producing distorted estimates.
The estimates for traditional gravity variables align mostly with expectations in Samples 1 and 2, but become unstable in Sample-3. Bilateral trade in goods shows a consistently positive and significant effect on services imports, supporting theories of complementarity between goods and services trade (Taglioni and Winkler, 2016). This effect is weaker and less consistent in exports. Türkiye’s GDP exhibits positive and significant coefficients across most specifications, as expected from standard gravity theory and confirming the role of economic size in trade generation. Distance is negative and significant in exports and total trade in Samples 1 and 2, but counterintuitively positive in services imports in Sample-1, suggesting possible reverse causality or the role of cross-border digital services. Also, the positive and significant effect on imports is anomalous and may reflect idiosyncratic features of Türkiye’s import structure. Contiguity remains statistically insignificant throughout, reflecting the weaker role of geographic proximity in services trade. The insignificant outcome is not uncommon in services trade due to the less tangible nature of service delivery. Free trade agreements (FTA) show positive and significant coefficients, except in cases where STRI is strongly negative and significant. This outcome is likely, because STRI captures a broader set of regulatory barriers not limited to FTA provisions.
The comparative analysis of the pseudo-R² statistics across the three samples reveals notable differences in the explanatory power of the gravity models, which can be attributed to both the characteristics of the underlying datasets and the structure of the estimated models. In Sample-1, the R² values are consistently high, ranging from 0.81 to 0.99 in models where the STRI coefficient is negative and statistically significant. Even in models where the STRI coefficient is not statistically significant, the R² values remain relatively high, fluctuating between 0.58 and 0.99. This suggests that, although Sample-1 lacks sectoral disaggregation and is constructed from aggregated national-level statistics, the model still captures a substantial portion of the variation in bilateral services trade. The high explanatory power is likely driven by the inclusion of aggregate trade flows and the relatively complete coverage of macroeconomic control variables such as GDP, distance, and FTAs, as well as the use of appropriate fixed effects (e.g., year or country). This highlights that the absence of granular sectoral variation does not necessarily hinder model fit when country-level trends dominate.
In contrast, Sample-2 exhibits a more moderate explanatory performance. In models where the STRI coefficient is negative and significant, R² values lie between 0.69 and 0.78, which is still reasonably robust. However, in models where the STRI coefficient is not significant, the explanatory power drops considerably, with R² values ranging between 0.03 and 0.48. This sharp decline indicates that once the variation captured by STRI diminishes, the remaining model components (e.g., gravity variables and fixed effects) contribute relatively little to explaining trade variation—possibly due to high firm-level heterogeneity and noisier data structures. The results suggest that Sample-2’s microdata offers some granularity but may lack sufficient variation across countries or sectors at the broader classification level to fully explain bilateral trade patterns.
The situation is even more pronounced in Sample-3, where none of the estimated models produce a STRI coefficient that is simultaneously negative and statistically significant. The R² values for Sample-3 range broadly from 0.24 to 0.83, indicating greater volatility in model performance. The generally lower and more dispersed R² values reflect challenges in capturing systematic trade patterns when working with highly disaggregated data, possibly due to several factors (Helpman et al., 2008; Borchert et al., 2014): (i) increasing data sparsity and measurement error at more granular levels, (ii) the mismatch between STRI’s aggregate structure and firm-level heterogeneity, and (iii) challenges in fixed effects estimation when limited observations exist per fixed effect group. Moreover, the lack of significance in the STRI coefficients may signal that the STRI index, originally designed at an aggregate sectoral level, fails to capture regulatory variation meaningfully at the sub-sectoral level. This suggests a mismatch between the granularity of the data and the granularity of the policy variable used.
The results, therefore, demonstrate a clear trade-off between data granularity and model fit. While more aggregated data (Sample-1) may conceal heterogeneity, it delivers strong explanatory power due to reduced noise and better variable coverage. Conversely, more detailed firm-level data (Sample-3) introduces heterogeneity that may be analytically valuable but makes it harder to detect robust empirical relationships, especially when the policy variable (STRI) lacks corresponding sub-sectoral variation. The intermediate performance of Sample-2 further supports this interpretation, offering a balance between granularity and model coherence. These findings emphasize the importance of aligning the level of data aggregation with the level of policy measurement when applying gravity models to services trade.
Overall, the gravity model provides meaningful insights into the determinants of Türkiye’s services trade, especially in Sample-1 and Sample-2. The results demonstrate that the model's explanatory power diminishes with increasing data granularity, as seen in Sample-3. The consistency of STRI’s negative and significant effect in Samples 1 and 2 supports the model’s applicability, while Sample-3’s results point to limitations when aligning trade and regulatory data at a highly disaggregated level.
2. Robustness Checks
We conduct two types of sub-sample analyses based on EU partner countries and trade flows exceeding a threshold of 10 million dollars to validate the robustness of the main estimation results. These alternative estimations presented in Tables A1-A6 of the Appendix aim to assess the sensitivity of our findings across different institutional settings and economically significant trade volumes.
The EU-only sub-sample yields consistent patterns with the results obtained from Sample-1: the STRI coefficient for Turkish import restrictiveness remains significant and negative (-6.91) in the bilateral model with country fixed effects, while the export STRI is also highly significant in the export-only equation with year fixed effects (-9.92). Likewise, the high-volume trade sub-sample (trade flows above 10 million dollars) confirms the robustness of these estimates, with similar coefficients: -6.09 (bilateral trade), -5.40 (exports), and -5.15 (imports). These results confirm that the observed negative relationship between services trade restrictions and bilateral trade persists across more integrated (EU) and economically significant settings.
For Sample-2, the EU sub-sample shows a larger magnitude for the export STRI in the bilateral model under sector fixed effects (-7.12), and a significant import STRI estimate of -4.59 under full fixed effects. However, in the export-only and import-only models, the STRI coefficients are either statistically insignificant or even positive—suggesting some heterogeneity in STRI effects across EU countries or estimation contexts. The results for the high-volume sub-sample are more aligned with the baseline: all STRI coefficients remain negative and statistically significant, ranging from -5.21 to -6.78 depending on the fixed effects structure. These findings highlight the persistence of the STRI-trade relationship even when focusing on core trade flows.
Nonetheless, the robustness checks reveal some exceptions for Sample-3. When restricted to EU countries, the export STRI becomes significant and negative (-2.92) under sector fixed effects. Similarly, in the high-volume sub-sample, the import STRI is negative and significant (-3.85 under sector FE and -3.21 under full FE), suggesting that the effects of trade restrictiveness are more visible in high-volume or more harmonized contexts, even at a finer sectoral level.
In conclusion, the robustness checks confirm the general pattern that services trade restrictiveness—as captured by the STRI—is negatively associated with bilateral services trade. This relationship holds across a variety of model specifications, sample compositions, and estimation contexts, particularly for country-level and broad-sector analyses. The sub-sample analyses reinforce the reliability of the main findings, in line with the empirical literature emphasizing the detrimental effects of regulatory barriers on services trade (e.g., Fontagné et al., 2016; Nordås and Rouzet, 2017).
3. Sectoral Results
This section presents a detailed sector-by-sector analysis of the estimated STRI effects on Türkiye’s services exports and imports, based on Sample-2 (main sectors) and Sample-3 (sub-sectors). The results in Tables A7-A10 of the Appendix are interpreted in light of the existing literature.
The STRI coefficient for transportation services exports is strongly negative and statistically significant, indicating that regulatory barriers reduce Türkiye’s ability to export transportation services. This result is consistent with the findings of Benz and Jaax (2019), who estimate a coefficient of -3.67, and Nordås and Rouzet (2017), who report a coefficient of -1.99. For imports, the STRI coefficient is negative but smaller in magnitude, aligning with the expectation that barriers have a greater impact on exports than on imports. Overall, the findings for transportation services are broadly consistent with previous studies. In the construction sector, STRI coefficients for both exports and imports are statistically insignificant. This mirrors the conclusions of Nordås and Rouzet (2017), who found no significant relationship between STRI and construction services trade. The results suggest that other factors, beyond trade restrictiveness, may be more influential in this sector. The STRI coefficient for exports in insurance and pension services is negative but moderate, indicating that regulatory barriers have a dampening effect on Türkiye’s exports. For imports, however, the coefficient turns positive and insignificant, possibly reflecting high levels of domestic protection and regulatory complexity in insurance markets. The absence of strong effects is in line with the limited empirical focus on this sector in the literature. The STRI variable has a negative but relatively small effect on financial services exports, compared to the much larger effects reported by Nordås (2023) and Hoekman and Shepherd (2021) which are -7.68 and -1.62, respectively. Surprisingly, the import regressions yield positive STRI coefficients, suggesting that Türkiye’s financial sector remains relatively closed to foreign competition. This divergence from theoretical expectations highlights the importance of sector-specific regulatory factors. In the industry of telecommunications, the STRI coefficient for exports is extremely negative and significant, reaching values even larger than those found by Nordås (2023) for EU-India trade (-6.341). This finding confirms the substantial sensitivity of telecommunications and information services exports to regulatory barriers. However, for imports, STRI coefficients are positive, consistent with observations that Türkiye maintains substantial restrictions on foreign providers in this area. STRI coefficients for other business services exports are negative and significant, in line with the general expectation that regulatory barriers hinder service exports. On the import side, results are mixed, with some coefficients turning positive but statistically insignificant, suggesting sectoral heterogeneity. Findings for the personal, cultural and recreational services are also mixed. Some export regressions show negative STRI coefficients, while others produce unexpected positive signs, particularly in imports. The broad and heterogeneous nature of services in this category may partly explain the variability of results across models.
In addition to the broad sectoral analysis, a more granular examination at the sub-sector level is conducted to better capture the heterogeneous effects of regulatory barriers across different service categories. The following subsections present the estimated STRI impacts for each sub-sector, highlighting areas where Türkiye’s services trade is particularly sensitive to regulatory restrictions.
The STRI coefficient for maritime transport exports is strongly negative and statistically significant, supporting previous findings by Nordås and Rouzet (2017). Import-side effects are weaker and often statistically insignificant, suggesting asymmetries in trade barriers’ impacts. Export regressions yield negative and significant STRI effects, confirming the critical role of liberalization for air transport services. However, import coefficients are positive or insignificant, potentially reflecting strong domestic protections in Türkiye’s aviation sector. STRI effects on rail transport exports are negative but relatively weak. Import-side results are insignificant or positive, in line with Türkiye’s limited reliance on foreign rail transport services. Negative and significant STRI coefficients are found for exports, indicating that regulatory barriers constrain Türkiye’s competitiveness in international road transport services. Results for imports vary. The expected negative STRI effect on exports is observed, though import results fluctuate, suggesting some instability across sub-sectors within transport. A strong and negative STRI coefficient is detected for exports, echoing international findings. However, the import coefficient is unexpectedly positive, likely due to domestic barriers against foreign courier providers. Export regressions show an extremely large negative STRI coefficient (-10.25), exceeding the findings by Nordås (2023). The positive STRI coefficient for imports highlights persistent domestic barriers in Türkiye’s telecommunications sector. For computer services, exports are negatively affected by STRI, with a coefficient of -4.54 estimated by Nordås (2023). For imports, positive STRI coefficients suggest that Türkiye’s digital services market remains relatively closed. Both export and import coefficients are negative but smaller than expected in legal and advisory services, compared to Nordås and Rouzet (2017) who reported values around -1.50 and -1.00, respectively. The modest size of coefficients may reflect regulatory complexities not captured fully by STRI indices. In architectural and technical services, exports experience modest negative STRI effects, while import results are mixed, pointing to potential measurement issues or sectoral peculiarities. Significant negative STRI effects are detected on exports of trade-related services, consistent with theory. However, import-side results are less stable. For personal, cultural, recreational services, high variability in STRI coefficients is found across regressions, consistent with the highly diverse nature of services within this category. Lastly, in audiovisual and related services, exports are negatively impacted by STRI, in line with expectations. For imports, positive coefficients emerge, plausibly due to protective measures aimed at preserving national cultural industries.
Taken together, the analysis reveals that STRI significantly impacts Türkiye’s services trade in a number of key sectors, while its influence remains limited or statistically insignificant in others. In both the main and sub-sectoral estimations, transportation-related sectors such as maritime, air, and road transport consistently exhibit a strong and negative relationship with STRI, aligning with existing literature. Similarly, telecommunications and computer services show substantial STRI effects, particularly on exports. Financial services also demonstrate sensitivity to regulatory barriers,
While the majority of empirical studies suggest that higher levels of regulatory restrictiveness, as measured by the STRI, are associated with reduced trade flows, the emergence of statistically significant positive coefficients in some sectors warrants careful interpretation. Similar patterns have been observed in earlier studies such as Nordås and Rouzet (2017) and Hoekman and Shepherd (2021), where specific service categories displayed unexpected signs, potentially due to endogeneity issues or sector-specific dynamics. Consistent with the explanations provided in the earlier discussion of results for the three samples, the occurrence of positive and significant STRI coefficients in certain sectors can be attributed to various factors.
Furthermore, the occurrence of unexpectedly positive coefficients on STRI in certain sectoral gravity model estimations do not necessarily invalidate the underlying empirical claims. Instead, they highlight well-known challenges in measuring the impact of regulatory barriers in services trade and underscore the complexity of modeling such effects at the sectoral level. Several points are worth considering. First, positive STRI coefficients may reflect reverse causality, whereby countries with large and competitive service sectors—particularly in finance, ICT, or professional services—have introduced regulations after establishing strong international trade positions. This is consistent with political economy explanations in which regulation can be a response to rising market activity (Borchert et al., 2014; Miroudot and Cadestin, 2017). Second, the STRI is based on
Following the above analysis incorporating the STRI as a key explanatory variable, we now turn to a focused evaluation of the traditional gravity variables alone. This shift allows for a clearer understanding of the underlying patterns driving services trade independently of regulatory restrictiveness, and helps assess the robustness of the model across different service sectors and subsectors.
Across the main service sectors, bilateral trade in goods and Türkiye’s GDP emerge as the most consistently positive and significant determinants of trade flows. Their effects are more pronounced in transport-related sectors (such as maritime, air, rail, and road transport) and in professional services (such as financial and legal services). The variable of trade in goods is especially strong in transportation sectors, positively associated with both exports and imports. In computer and postal services, however, goods trade shows negative coefficients in some specifications, suggesting sector-specific dynamics. The GDP variable is generally positive across the board, indicating that larger economies trade more services with Türkiye. The distance exhibits the expected negative impact on trade, but the effect is statistically significant mainly in transport and telecommunications sectors. The shared border dummy variable has a positive and significant effect particularly in financial services and some transport sectors, while showing a negative effect in other commercial services and personal, cultural, and recreational services. Free trade agreements significantly boost service exports and imports in most sectors, especially in maritime and air transport. At the subsector level, coefficients show even greater consistency. Maritime, air, and road transport, as well as architectural and engineering services, demonstrate robust positive effects of traditional gravity variables, aligning with theoretical expectations.
The the pseudo-R² values suggest a notable variation in model fit across sectors and subsectors. Higher R² values are observed in subsector analyses (e.g., maritime transport, road transport, air transport), often exceeding 0.90, indicating that traditional gravity variables explain a large share of trade variation in these more narrowly defined categories. Moderate R² values are found in broader service sectors like construction services, financial services, and postal services, suggesting a reasonable explanatory power. Lower R² values (sometimes below 0.20) appear in sectors such as telecommunications, cultural services, and insurance, implying that sector-specific factors beyond traditional gravity variables may play a more important role in these cases. Overall, the subsector-level models outperform the sector-level models in terms of goodness of fit, highlighting the importance of disaggregated analysis when studying services trade flows. Across both major sectors and subsectors, traditional gravity variables—particularly goods trade, GDP, FTAs, and border-sharing—play significant roles in explaining Türkiye’s services trade, even without explicitly controlling for regulatory barriers like STRI. Sub-sectoral models generally offer a better fit, suggesting the benefits of more detailed analyses when designing trade policy interventions.
4. Ad Valorem Equivalents (AVEs)
The AVE calculations are carried out only for sectors where the STRI variable is estimated with a negative and statistically significant coefficient. This ensures that the resulting AVE values are economically meaningful and theoretically consistent. Restricting the calculation to sectors with a properly signed and significant STRI effect helps to avoid potential biases and ensures the robustness of the estimates. The methodology in Equation-2 is applied systematically across all relevant sectors.
A comparative analysis of Türkiye’s exposure to services trade restrictions based on Sample-1 and the microdata (Samples 2 and 3) reveals a highly consistent pattern as shown in Figures 5 and 6, yet with some notable distinctions. Regarding exports, Türkiye faces relatively low AVE rates in both data sets. The minimum AVE rates remain very similar across all samples, ranging between 0.59% and 1.97% over the 2016–2022 period. Similarly, the average AVE rates for exports are closely aligned between the two calculations, fluctuating from 13.68% to 17.35%. The maximum AVE rates exhibit the highest values at 98.30% in the 2016–2002 average, and although there has been a decline over time, they stabilized around 65% in 2022 across both samples. These findings indicate that the level of protection Türkiye encounter in its export markets is moderate and has not changed significantly between two datasets, suggesting that the choice of sample has limited impact on Türkiye’s observed exposure in services exports.
On the other hand, Türkiye’s own application of restrictions on services imports shows a considerably higher degree of protection in both samples, though again, the patterns between two distinct computations are almost identical. The minimum AVE rates in imports range from 13.63% to 39.38% across the years, while the average AVEs are consistently above 50%, reaching up to 65.83% in 2021. Maximum AVE rates in imports are particularly high, exceeding 140% in the earlier periods and remaining elevated throughout. The similarity in results between two the national statistics (MEDAS) and microdata indicates that Türkiye’s restrictive stance on services imports is a robust finding, not sensitive to the specific sample employed.
Comparing the country-level AVE estimates across different samples provides further insights into Türkiye’s services trade policy stance. In particular, when contrasting the results obtained from the national statistic (Sample-1) and the microdata, a clear asymmetry emerges. Sample-1 results — which are based on Türkiye’s actual applied restrictions — reveal significantly higher AVE rates compared to the microdata, where partner countries’ restrictions against Türkiye are considered. Specifically, Türkiye’s own applied AVEs on imports are consistently higher across all years, both in terms of minimum, average, and maximum rates. For example, while the average AVE rates computed from the microdata that Türkiye faces in its exports range around 13–17% depending on the year, its applied AVEs on imports are substantially higher according to the Sample-1, fluctuating around 52–66%. Similarly, even the minimum AVE rates on imports remain notably elevated relative to the minimum barriers Türkiye faces in export markets.
These findings indicate that Türkiye maintains a considerably more protectionist stance in services trade compared to the level of barriers it encounters abroad. While Turkish service exporters benefit from relatively moderate access conditions in partner markets, foreign service providers face much more restrictive conditions when accessing the Turkish market.
In addition to the country-level analysis of Türkiye’s exposure to services trade barriers, a sectoral breakdown of AVEs is calculated using Equation-2 based on the microdata (Figure 7). This sectoral assessment provides deeper insights into the structure and distribution of barriers across different service industries. For Türkiye’s exports, the lowest AVE rates are observed predominantly in sectors such as computer (0.95%), telecommunications (1.12%), and distribution (1.20%), indicating relatively open access in these service categories. In contrast, sectors such as technical services (21.97%), rail transport (7.36%), and transport (35.00%) exhibit significantly higher minimum AVE rates, suggesting the presence of more substantial barriers even in the most favorable markets. The average AVE rates reveal a similar pattern: technical services face the highest average AVE (42.49%), followed by transport (39.83%) and rail transport (23.05%). Meanwhile, sectors such as computer (2.36%) and telecommunications (2.81%) consistently record the lowest average AVE rates. These findings indicate that while Türkiye encounters moderate barriers in technology-related services, it faces much more restrictive conditions in technical and transportation-related sectors. In terms of the maximum AVE rates, the highest barriers are again observed in technical (69.75%) and transport (50.77%) services, whereas the computer sector faces relatively mild maximum barriers (3.40%). This underscores a significant heterogeneity in market access conditions across service sectors, with technical and transport services being particularly sensitive to regulatory barriers abroad.
Turning to Türkiye’s own applied barriers on imports, the sectoral distribution similarly highlights an asymmetrical protection structure. Sectors such as legal, personal, cultural, and recreational services, and telecommunications face relatively high AVE rates, while sectors such as computer and construction are characterized by lower AVEs. Average AVEs in imports mirror the patterns observed in exports, but with generally higher protection levels across almost all sectors. The sectoral AVE results thus complement the earlier country-level findings. First, Türkiye generally faces moderate levels of services trade restrictiveness in exports, with considerable variation across sectors. Second, Türkiye’s own application of restrictions on imports is systematically higher, especially in regulatory-intensive sectors such as legal services, telecommunications, and distribution. Third, sectors such as computer and distribution emerge as areas where both inbound and outbound trade barriers are relatively limited, suggesting that these sectors are comparatively more liberalized.
Overall, the combined country-level and sectoral analyses reveal a persistent asymmetry: while Türkiye encounters relatively moderate restrictions abroad (with notable sectoral exceptions), it imposes significantly higher barriers on services imports, particularly in key infrastructure and regulatory service sectors. This pattern reflects a policy stance that is relatively more inward-oriented, especially in sensitive service industries. These findings highlight the importance of targeted liberalization efforts, especially in sectors where Türkiye both imposes and faces high barriers, in order to enhance its integration into global services markets.
In order to contextualize Türkiye’s AVE estimates for services trade, it is useful to compare them with findings from previous studies. Existing literature provides sector-specific AVE ranges that offer important benchmarks. For example, Guillin (2013) calculates AVEs for Türkiye in the transport sector between 27.86% and 40.16%, in the communication sector between 29.50% and 32.32%, and in the financial services sector between 35.18% and 67.42%. Similarly, in the transportation sector, Fontagné et al. (2016) estimate an AVE range between 0% and 148%, while Benz and Jaax (2019) report a range from 51% to 264%. In the construction sector, the AVE is found to be particularly high, reaching 180.6% according to Fontagné et al., (2016) and Benz (2017). For the finance sector, Benz (2017) identifies the highest AVE rate at 566%, emphasizing the exceptionally restrictive nature of this sector. In the computer services sector, Guillin (2013) reports an AVE rate of 45.59%. Compared to these findings, Türkiye’s sectoral AVE estimates based on national statistics and firm-level microdata in this study reveal relatively moderate barriers for exports (around 15%) but significantly higher protection in imports (averaging around 55?60%). However, the sectoral distribution remains consistent with the broader patterns in the literature: sectors such as transport, technical services, and personal-cultural services display higher AVEs, while sectors like telecommunications and computer services face relatively lower barriers. These comparisons validate the robustness of the current findings and further underline the necessity of sector-specific policy approaches to liberalization, particularly in highly protected sectors such as transport, construction, and financial services.
VII. Conclusion
This study offers significant insights into the methodologies employed in previous research regarding trade in services, framing the discussion through two distinct yet interrelated dimensions. The first dimension concerns the well-documented challenges related to the measurement and completeness of services trade data. The second focuses on the reliability and structure of indicators used to quantify non-tariff barriers in services, particularly the OECD’s Services Trade Restrictiveness Index (STRI). Although related, these two aspects are conceptually distinct: while the former pertains to how trade flows are captured and reported, the latter concerns how regulatory impediments to trade are constructed and interpreted. Our comparative empirical study, centered on the Turkish case, utilizes firm-based panel data with fixed effects in conjunction with the gravity model to explore both issues.
Our analysis reveals that descriptive statistics serve as a pivotal starting point for empirically identifying data issues acknowledged within the existing literature. The use of microdata not only substantiates the concerns regarding the prevalence of missing or incomplete information provided by international organizations but also presents compelling evidence that calls into question the validity of earlier research findings. The estimation results derived from Türkiye’s microdata indicate a significant reduction in the explanatory capacity of the gravity model for services trade. Moreover, a thorough comparison with international databases reveals notable disparities in the estimated Services Trade Restrictiveness Index (STRI) coefficients, which are designed to quantify obstacles to trade in services.
Our methodology sheds light on the reliability of the STRI approach for measuring barriers to services trade. By utilizing microdata, we assess the relationship between the STRI variable and trade—analyzing both exports and imports—across various main and sub-service sectors using the gravity model. Importantly, our findings regarding the limited explanatory power of STRI in certain sectors should not be conflated with the data quality issues outlined earlier. While both affect empirical model performance, they originate from different sources. The former stems from potential measurement or conceptual limitations in the construction of the STRI index itself, whereas the latter concerns the availability, accuracy, and granularity of services trade statistics. We treat these as analytically separate, though empirically intertwined, challenges. Our findings reveal that this relationship holds true only for a select number of sectors, and further, the magnitudes of the effects observed in these sectors diverge from those documented in prior studies. The Average Tariff Equivalents (AVEs) calculated for different countries and sectors support this observation. These inconsistencies may stem from the distinctive characteristics of the newly analyzed dataset, underscoring the inadequacy of the STRI method in thoroughly explaining trade in services.
While it is vital to acknowledge the legitimate constraints surrounding services trade data, the reliance on incomplete information and the miscalculation of trade barriers carry profound implications for the formulation of trade policies. Therefore, we advocate for similar studies to be conducted in other countries whenever feasible. Such initiatives will undoubtedly enhance the robustness of existing datasets and facilitate more accurate the determinants of services trade. Crucially, this would also advance the development of the STRI methodology, a process that entails extensive efforts by international organizations like the OECD. Ultimately, the reliability of trade data is essential for robust testing and, where necessary, the revision of the STRI values computed through rigorous processes. By addressing these challenges, we can foster more effective and informed trade policies, paving the way for a more inclusive and dynamic services sector.
The findings of this study raise several methodological and policy-relevant considerations. The study’s results are broadly consistent with existing empirical literature, especially for Sample-1 and Sample-2. Deviations in Sample-3 underscore the importance of methodological alignment and data consistency in empirical trade research. In other words, the results highlight the critical role of data structure and STRI methodology in shaping empirical estimates of trade restrictiveness. Accordingly, policymakers should interpret STRI-based estimates cautiously, especially when applied at the sub-sectoral level. More granular data may introduce statistical noise and reduce model reliability unless matched with equally granular regulatory indicators. Moreover, the STRI, though useful at macro-sectoral levels, does not fully capture the heterogeneity in how regulatory barriers are experienced at the firm level, nor does it reflect variation at finer sub-sectoral levels. This limitation suggests the need for next-generation STRI-type indicators that are dynamic, firm-responsive, and possibly modular by regulatory component. Efforts to harmonize sectoral definitions and expand STRI coverage could enhance analytical precision.
While the OECD’s STRI remains one of the most widely used tools for quantifying regulatory barriers to services trade, several structural and methodological limitations raise concerns about its reliability and interpretability in empirical applications—particularly in gravity model estimations. One major criticism is that STRI relies heavily on
Another limitation stems from equal weighting across policy dimensions within sectors, which assumes that all types of restrictions (e.g., foreign equity limits, licensing requirements, movement of people) have equivalent trade-distorting effects. This assumption has been challenged by empirical studies suggesting that some barriers have disproportionately larger impacts on trade flows (Miroudot et al., 2013). Moreover, the STRI’s limited temporal frequency (annual updates) and lack of responsiveness to recent regulatory reforms restrict its usefulness for real-time policy evaluation or for capturing rapidly evolving digital services markets.
Unexpected positive coefficients on STRI in gravity model estimations may further indicate measurement error or omitted variable bias, and cast doubt on the index’s explanatory power for sectoral trade flows. As such, policymakers should consider combining STRI with alternative data sources such as the World Bank’s Services Trade Policy Database (STPD), the ECIPE Digital Trade Restrictiveness Index (DTRI), or firm-level surveys that provide micro-level evidence on regulatory burdens and perceived obstacles (Borchert et al., 2014).
To enhance policy relevance, future versions of STRI could incorporate outcome-based indicators, account for sector-specific elasticities, and improve transparency in scoring methodologies. A promising direction involves developing hybrid indices that merge formal regulatory data with real-world firm behavior and market performance, offering a more accurate picture of the barriers that actually matter for trade.
In the final part of the analysis, AVE rates are calculated to evaluate the intensity of trade barriers that Türkiye faces in services exports and imposes in services imports. The results based on the national statistics and microdata indicate that Türkiye encounters relatively moderate barriers in its export markets, with average AVE rates ranging around 15%, whereas the barriers applied by Türkiye on imports are significantly higher, averaging around 55-60% over the period.
Furthermore, a sectoral analysis using two distinct datasets highlights considerable heterogeneity across services sectors. Particularly, sectors such as technical services, transport, and personal cultural services exhibit higher AVE rates compared to others like telecommunications and computer services. When comparing the results from two different datsets, it is evident that Türkiye appears more protectionist from the perspective of Sample-1, suggesting that barrier estimates are sensitive to the sample composition and specification. This finding underlines the importance of data selection in assessing trade policy stances. Overall, the AVE estimates complement the gravity model results by providing an intuitive measure of trade restrictiveness, reinforcing the conclusion that while Türkiye faces notable barriers abroad, it also maintains relatively high levels of protection in its domestic services market.
Taken together, the study’s findings offer insights into two critical sources of variation in services trade research: the limitations of existing trade data infrastructure and the structural properties of widely used regulatory indicators like the STRI. While this study does not claim that STRI is universally mismeasured, the evidence highlights the need for refined policy instruments that more accurately reflect firm-level and sub-sectoral realities. At the same time, better-quality trade data would allow for more robust testing and enhance confidence in policy-relevant modeling exercises.
These findings point to important policy implications. In order to enhance its competitiveness in services exports and to benefit more from international trade agreements, Türkiye should consider gradually reducing barriers in its domestic services market, especially in sectors where domestic protection is disproportionately high. A more liberal domestic environment could not only support innovation and efficiency but also strengthen Türkiye’s negotiating position in bilateral and multilateral trade negotiations.
Tables & Figures
Figure 1.
Türkiye’s Services Trade by Countries (2022, billion dollars)
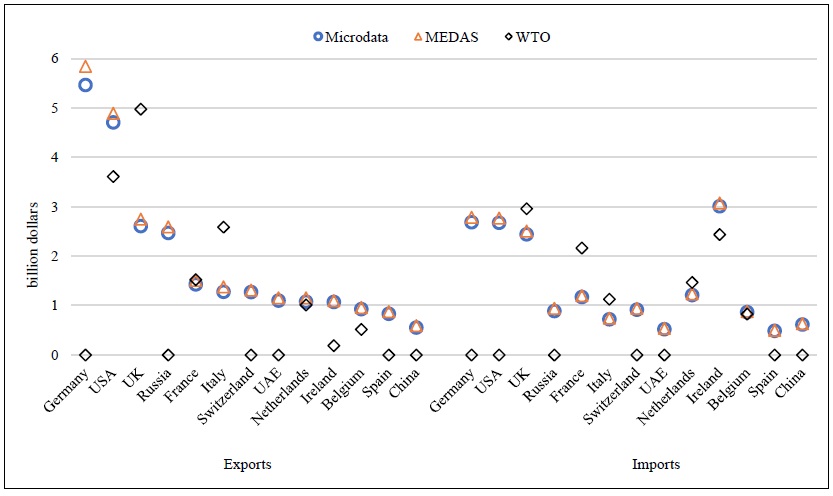
Notes: The data compiled by the authors from TurkStat “International Trade in Services Statistics” (
Figure 2.
Türkiye’s Services Trade by Sectors (2022, billion dollars)
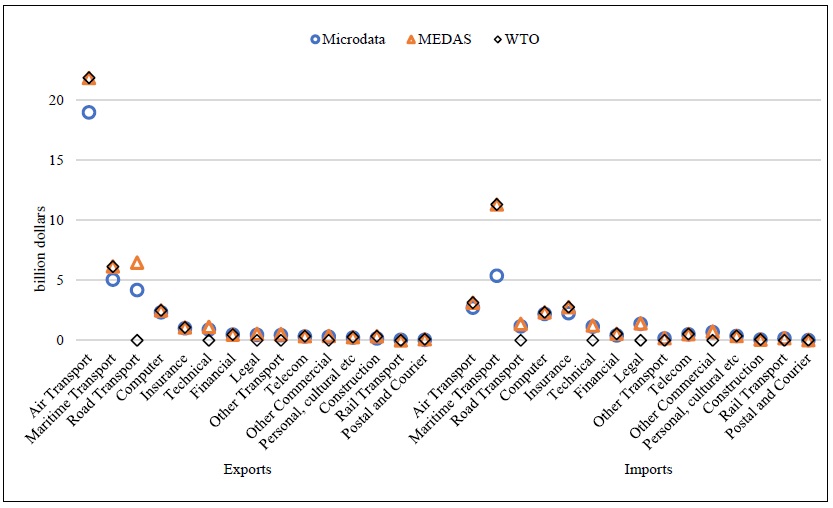
Notes: The data compiled by the authors from TurkStat “International Trade in Services Statistics” (
Figure 3.
Türkiye’s Trade in Services with the USA (2022, million dollars)
Notes: The data compiled by the authors from TurkStat “International Trade in Services Statistics” (
Figure 4.
Türkiye’s Trade in Services with the United Kingdom (2022, million dollars)
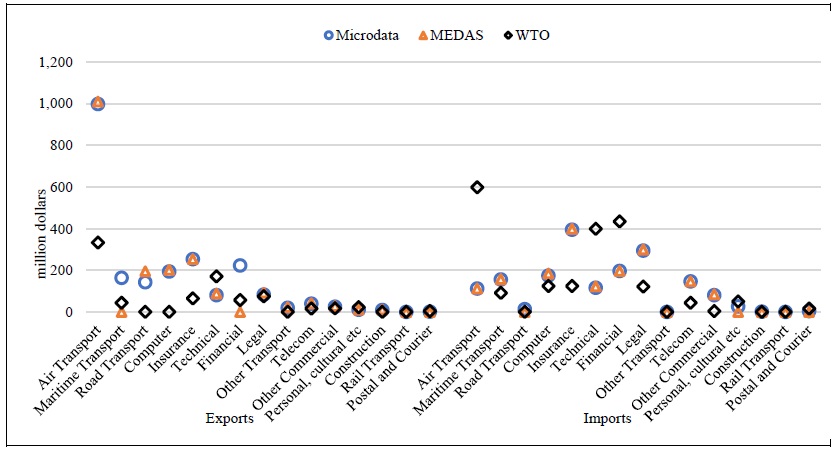
Notes: The data compiled by the authors from TurkStat “International Trade in Services Statistics” (
Table 1.
Services Exports by Sector and Trading Partner (2023, million dollars)
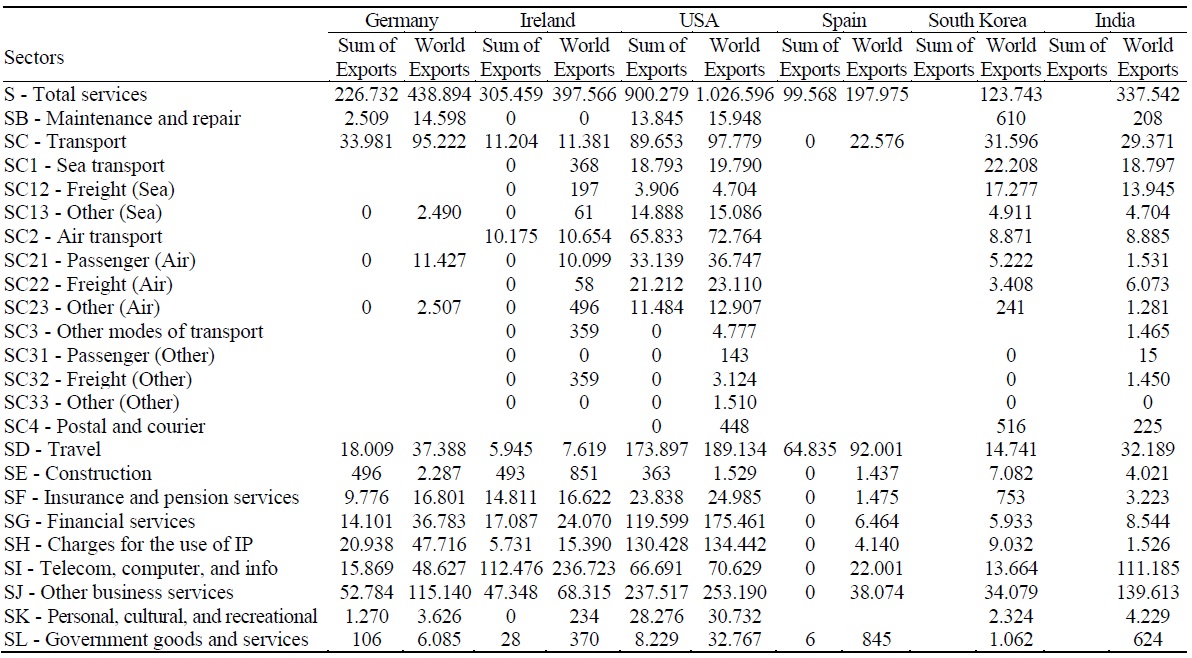
Source: The data compiled by the authors from WTO “Trade in Services Dataset” (
Table 2.
The OECD vs. World Bank Services Trade Restrictiveness Index (STRI)
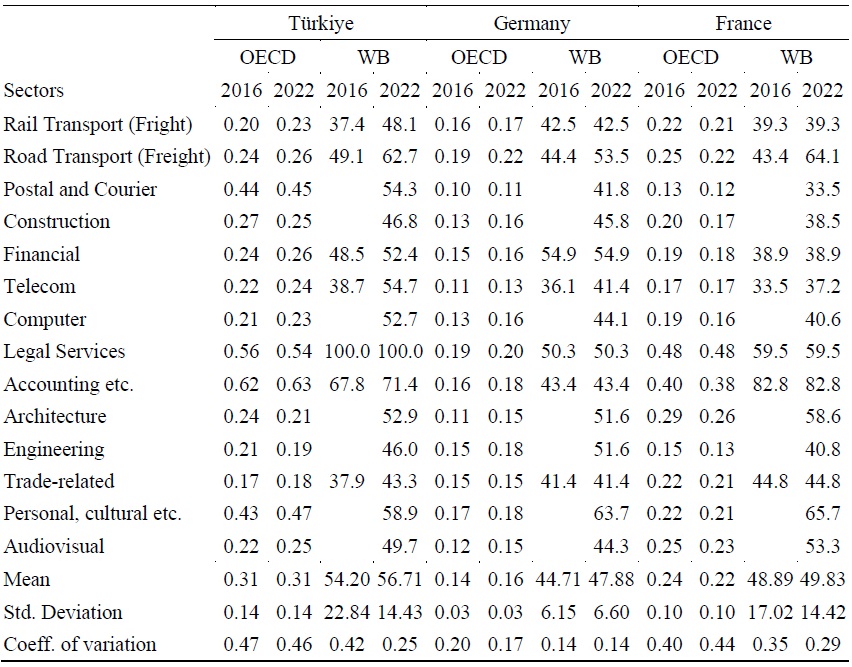
Source: The data compiled by the authors from OECD “Trade in Services Dataset” (
Table 3.
Comparison of the STRI Scores for Selected Countries
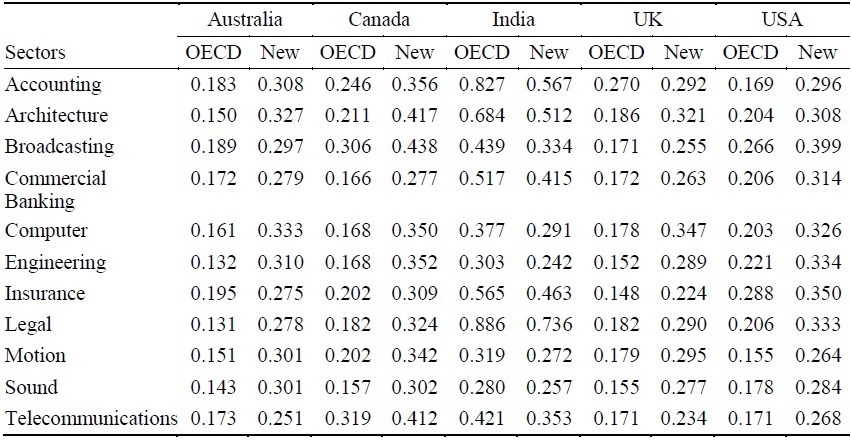
Source: The data compiled by the authors from
Table 4.
Corresponding Table for EBOPS and the OECD-STRI
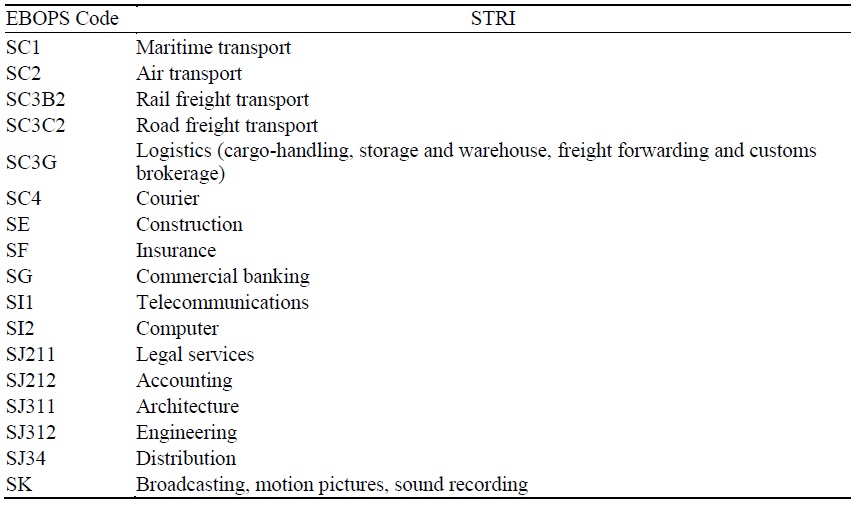
Source: The information compiled by the authors from the OECD “Trade in Services Dataset” (
Table 5.
Descriptive Statistics of the Samples
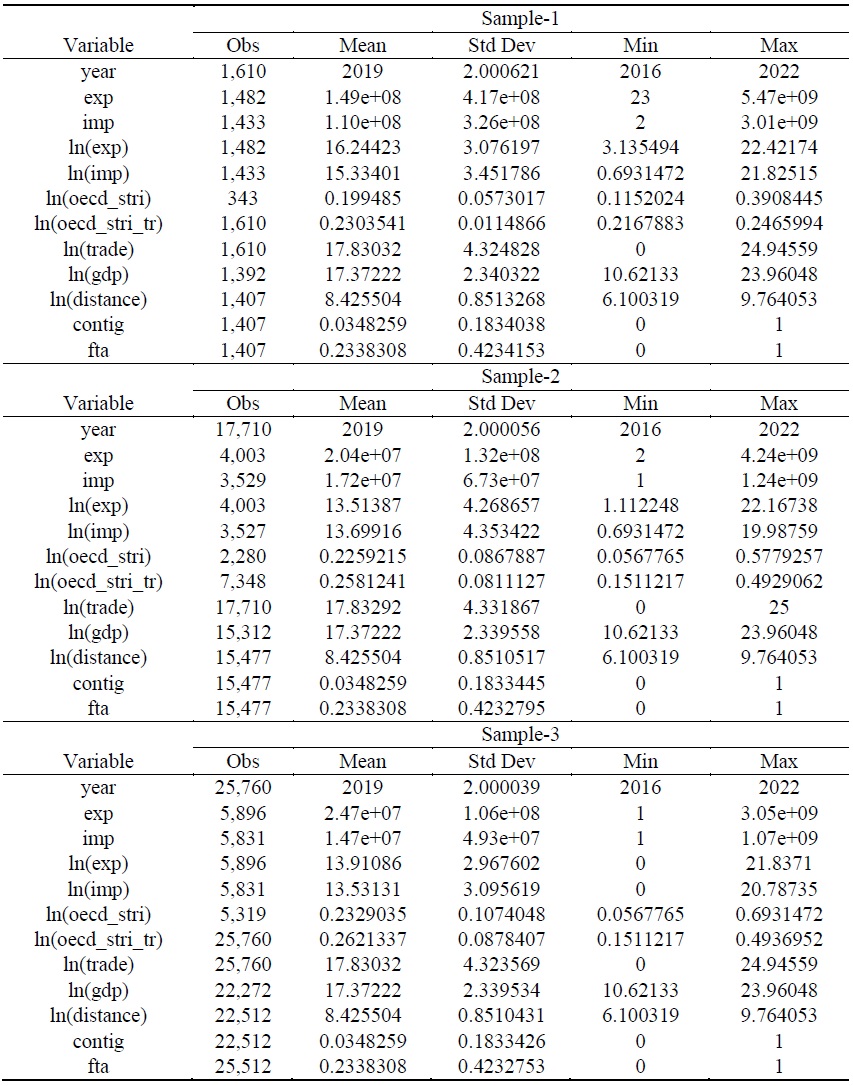
Source: The information compiled by the authors from the Stata calculations.
Table 6.
Estimation Results (Sample-1 from MEDAS)
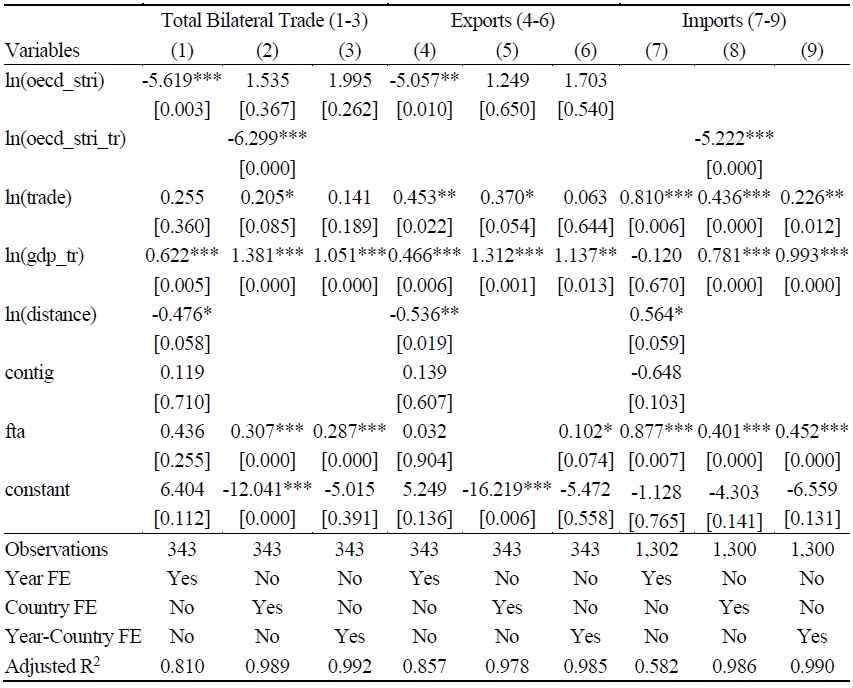
Notes: Robust standard errors in square brackets are clustered at the partner country level. *, **, *** denote significance at the 10%, 5%, and 1% levels, respectively.
Table 7.
Estimation Results (Sample-2 from Microdata for Main Sectors)
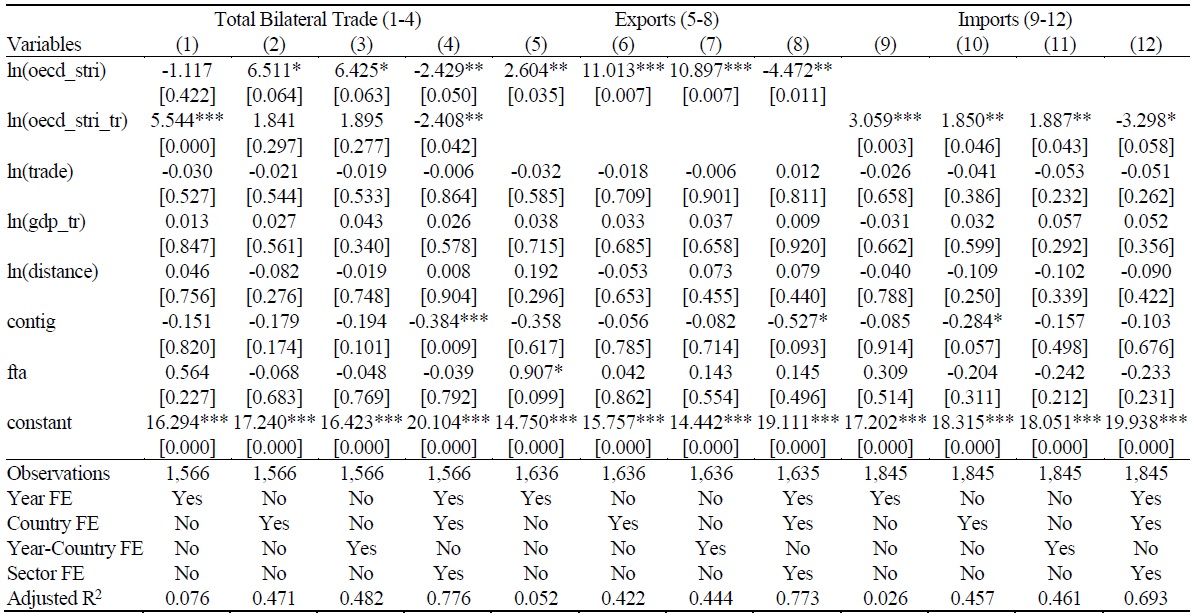
Notes: Robust standard errors in square brackets are clustered at the partner country level. *, **, *** denote significance at the 10%, 5%, and 1% levels, respectively.
Table 8.
Estimation Results (Sample-3 from Microdata for Sub-Sectors)
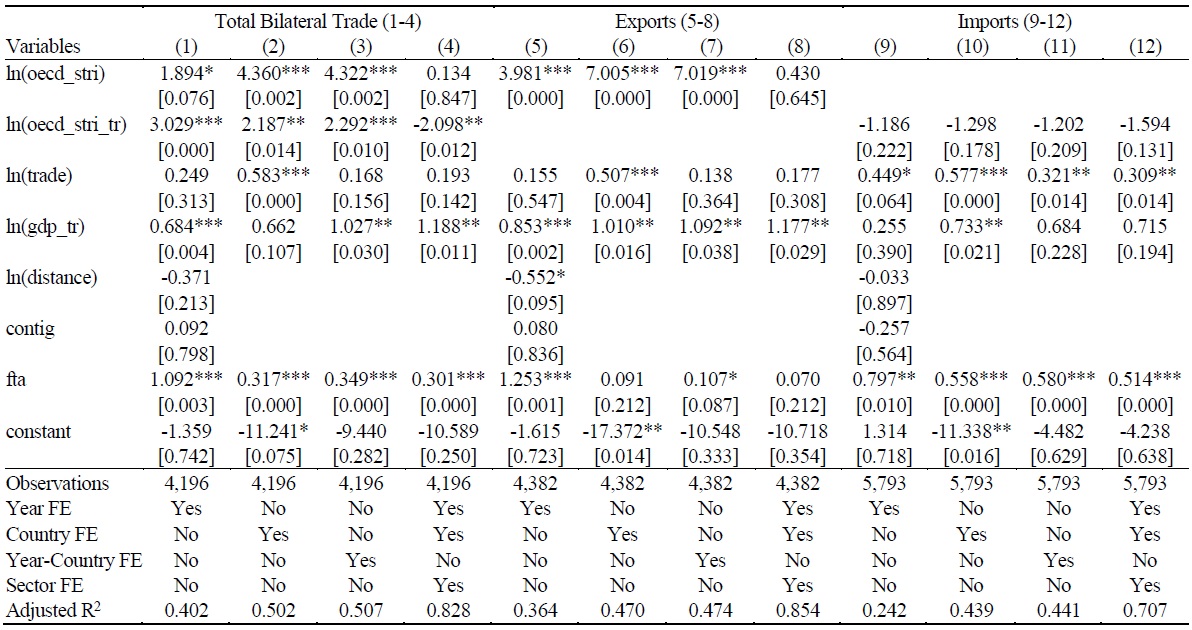
Notes: Robust standard errors in square brackets are clustered at the partner country level. *, **, *** denote significance at the 10%, 5%, and 1% levels, respectively.
Figure 5.
Average Tariff Equivalents (AVEs): Türkiye’s Exposure and Application in Services Trade (2016-2022, Sample-1)
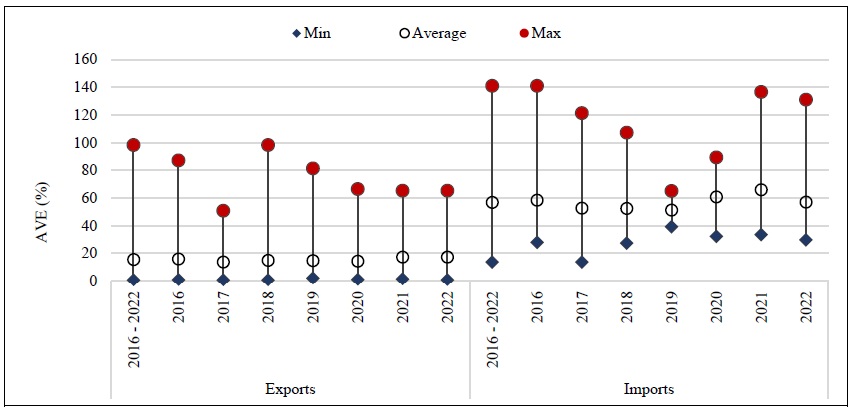
Source: The information compiled by the authors from the Stata calculations.
Figure 6.
Average Tariff Equivalents (AVEs): Türkiye’s Exposure and Application in Services Trade (2016-2022, Microdata)
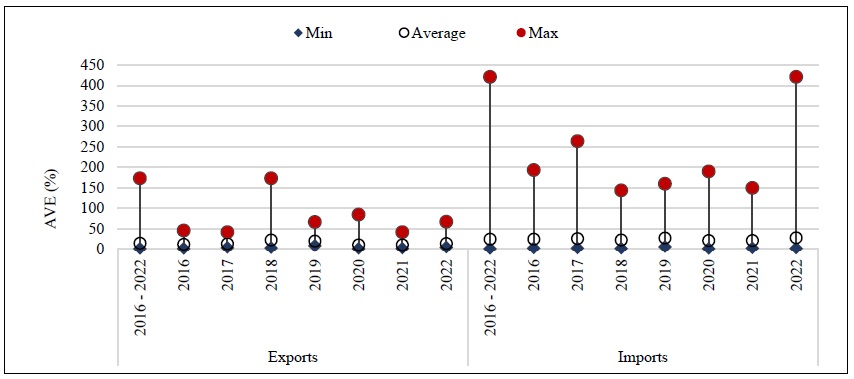
Source: The information compiled by the authors from the Stata calculations.
Figure 7.
Sectoral AVE’s (Exports and Imports)
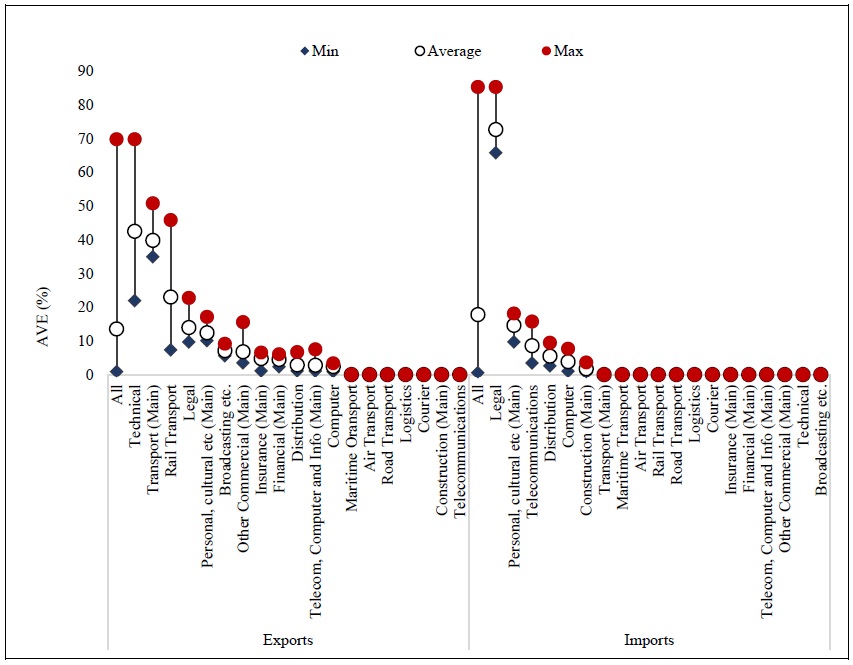
Source: The information compiled by the authors from the Stata calculations.
Table A1.
Robustness Checks for Sample-1 (EU-Only Sub-Sample)
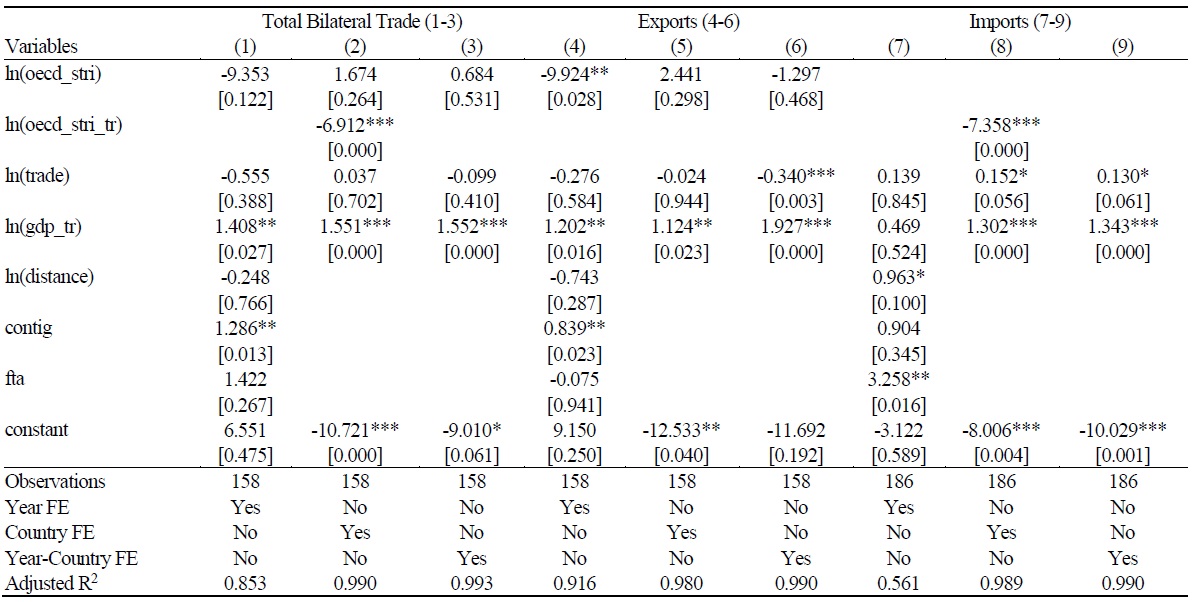
Notes: Robust standard errors in square brackets are clustered at the partner country level. *, **, *** denote significance at the 10%, 5%, and 1% levels, respectively.
Table A2.
Robustness Checks for Sample-1 (High-volume trade sub-sample)
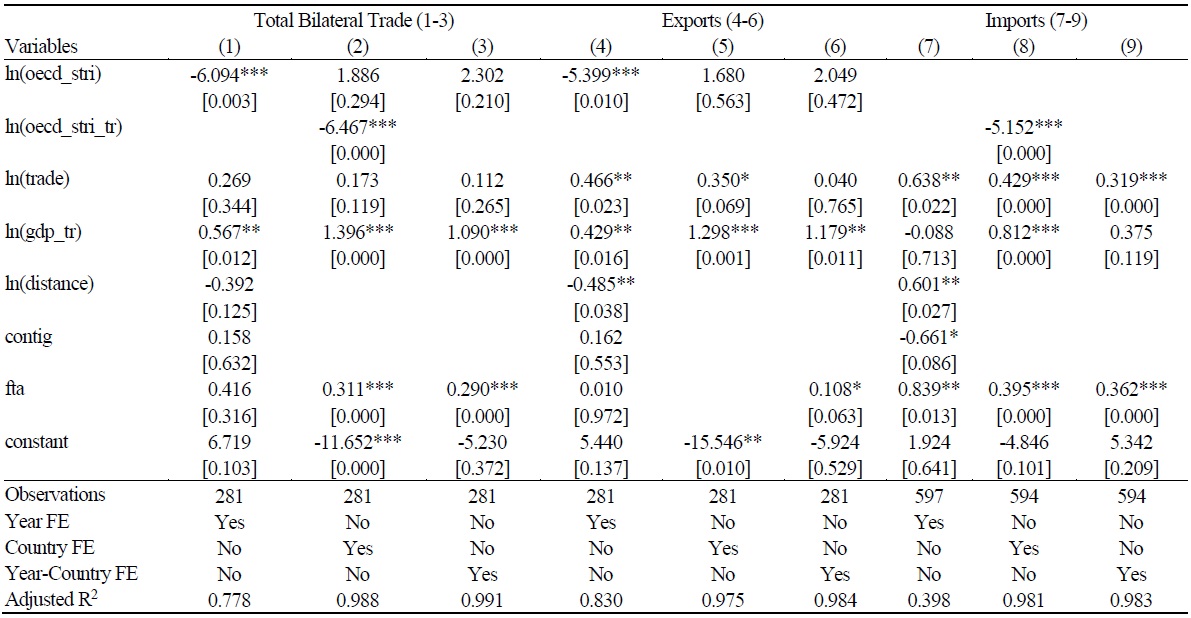
Notes: Robust standard errors in square brackets are clustered at the partner country level. *, **, *** denote significance at the 10%, 5%, and 1% levels, respectively.
Table A3.
Robustness Checks for Sample-2 (EU-Only Sub-Sample)
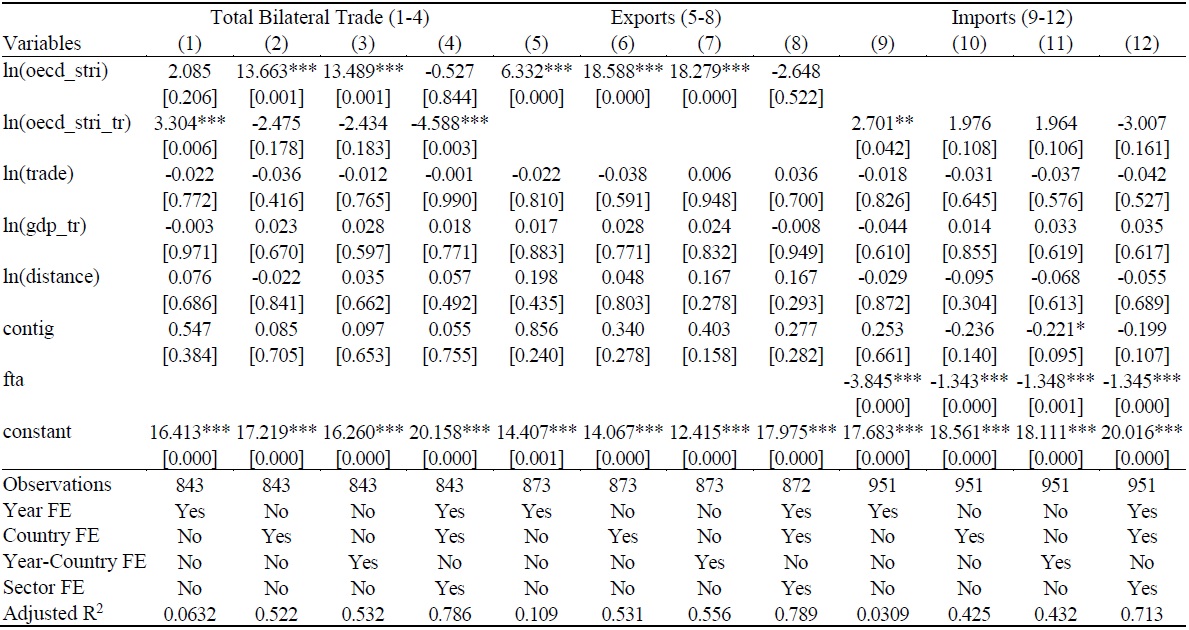
Notes: Robust standard errors in square brackets are clustered at the partner country level. *, **, *** denote significance at the 10%, 5%, and 1% levels, respectively.
Table A4.
Robustness Checks for Sample-2 (High-volume trade sub-sample)
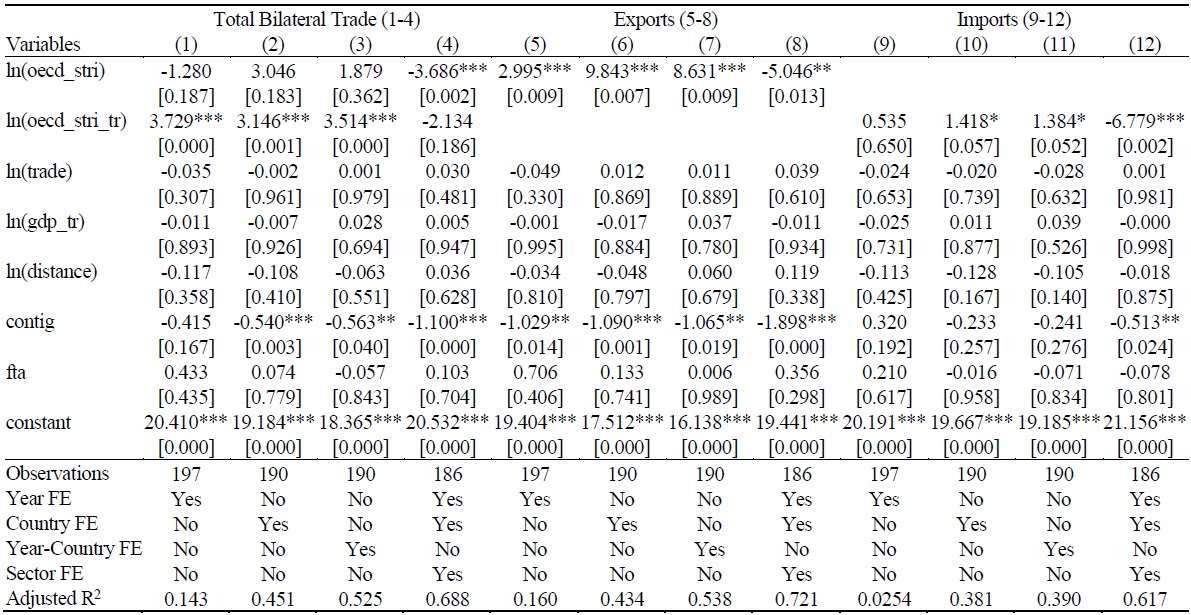
Notes: Robust standard errors in square brackets are clustered at the partner country level. *, **, *** denote significance at the 10%, 5%, and 1% levels, respectively.
Table A5.
Robustness Checks for Sample-2 (EU-Only Sub-Sample)
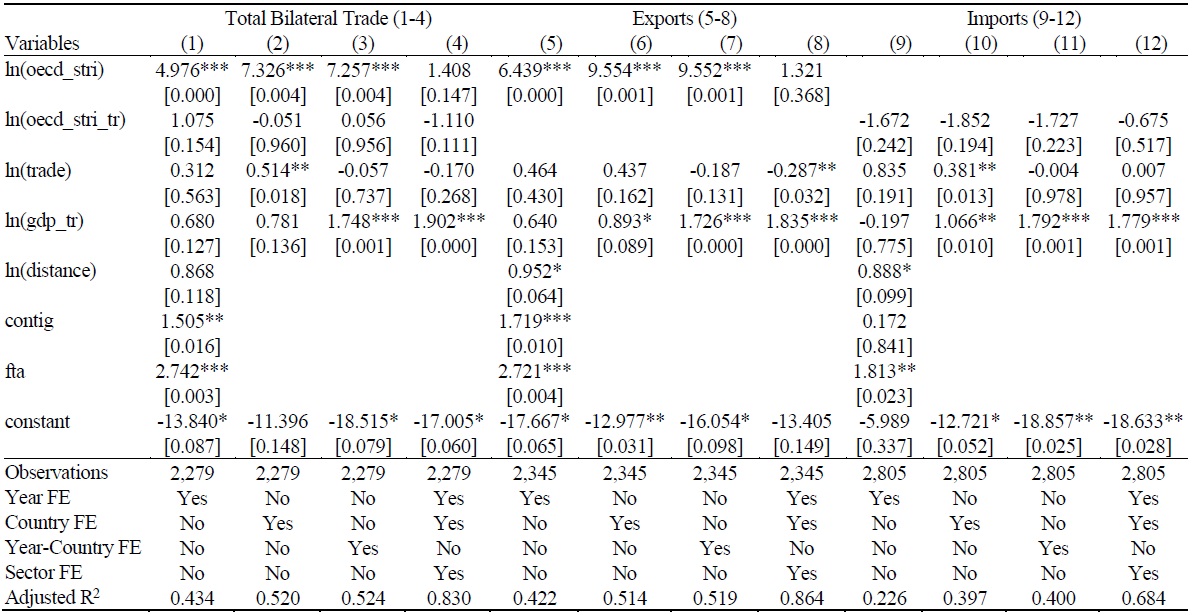
Notes: Robust standard errors in square brackets are clustered at the partner country level. *, **, *** denote significance at the 10%, 5%, and 1% levels, respectively.
Table A6.
Robustness Checks for Sample-2 (High-volume trade sub-sample)
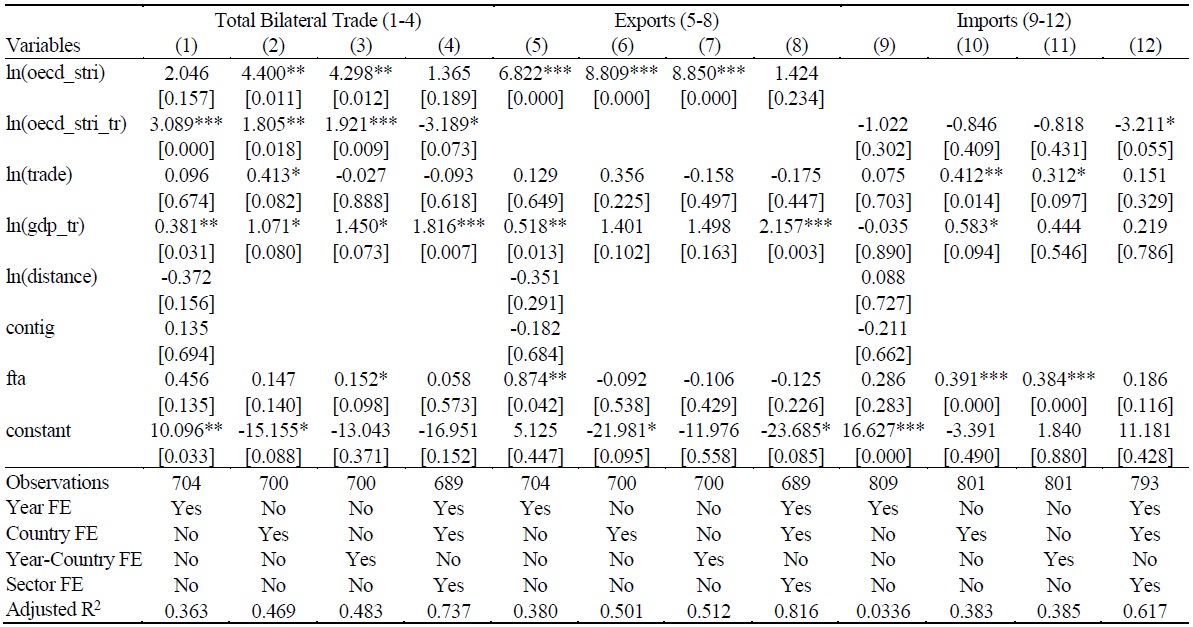
Notes: Robust standard errors in square brackets are clustered at the partner country level. *, **, *** denote significance at the 10%, 5%, and 1% levels, respectively.
Table A7.
Estimation Results for Selected Main Sectors (Exports)
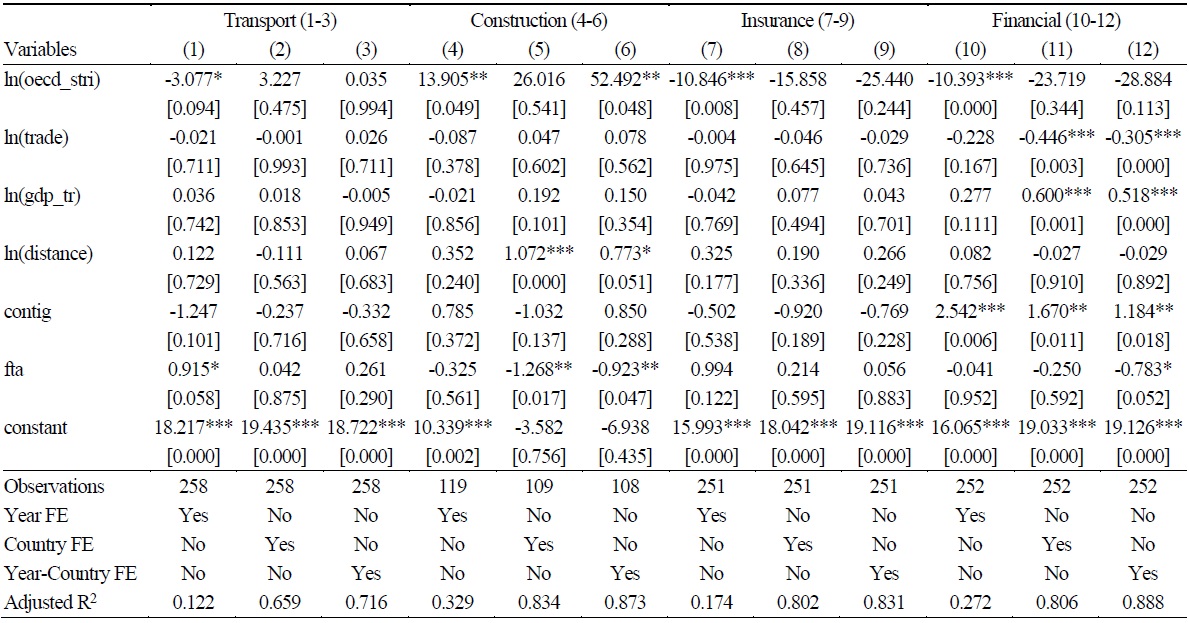
Table A7.
Continued
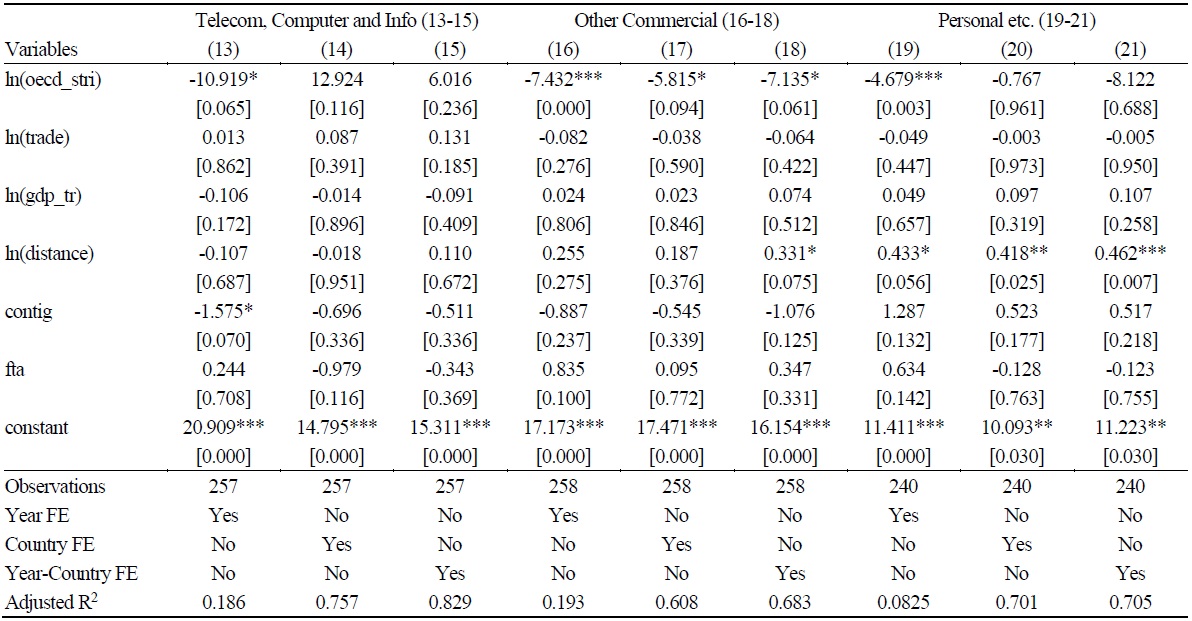
Notes: Robust standard errors in square brackets are clustered at the partner country level. *, **, *** denote significance at the 10%, 5%, and 1% levels, respectively.
Table A8.
Estimation Results for Selected Main Sectors (Imports)
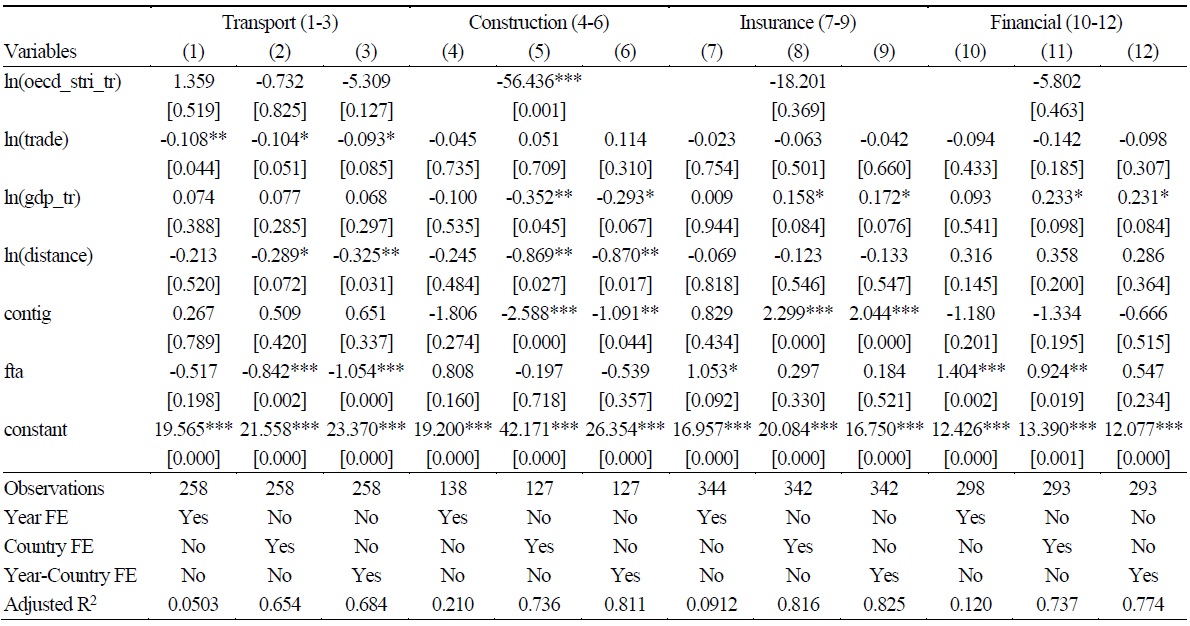
Table A8.
Continued
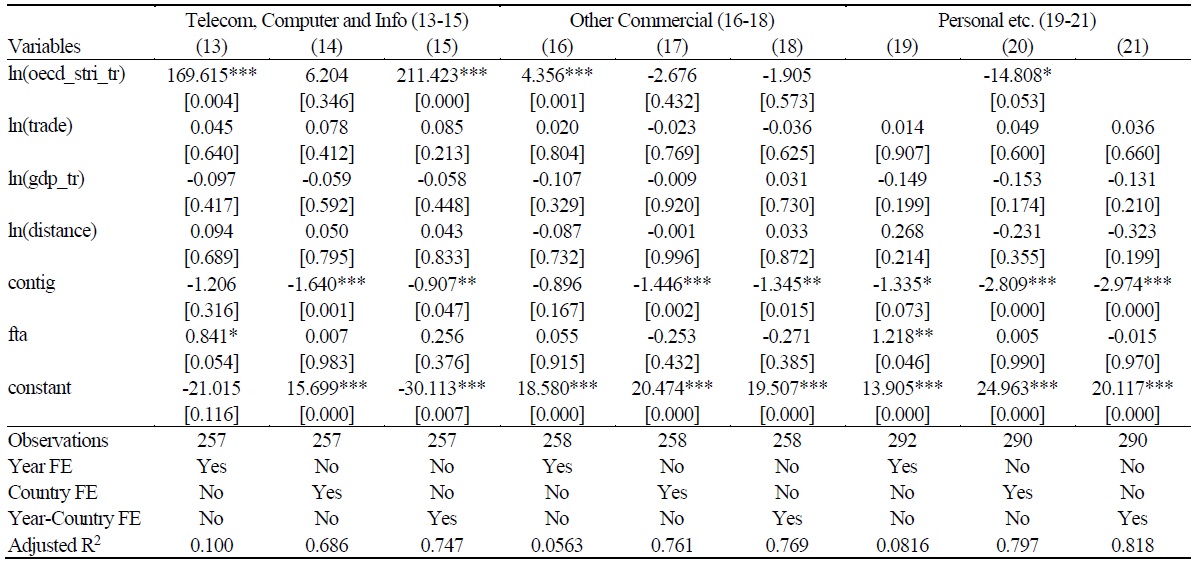
Notes: Robust standard errors in square brackets are clustered at the partner country level. *, **, *** denote significance at the 10%, 5%, and 1% levels, respectively.
Table A9.
Estimation Results for Selected Sub-Sectors (Exports)
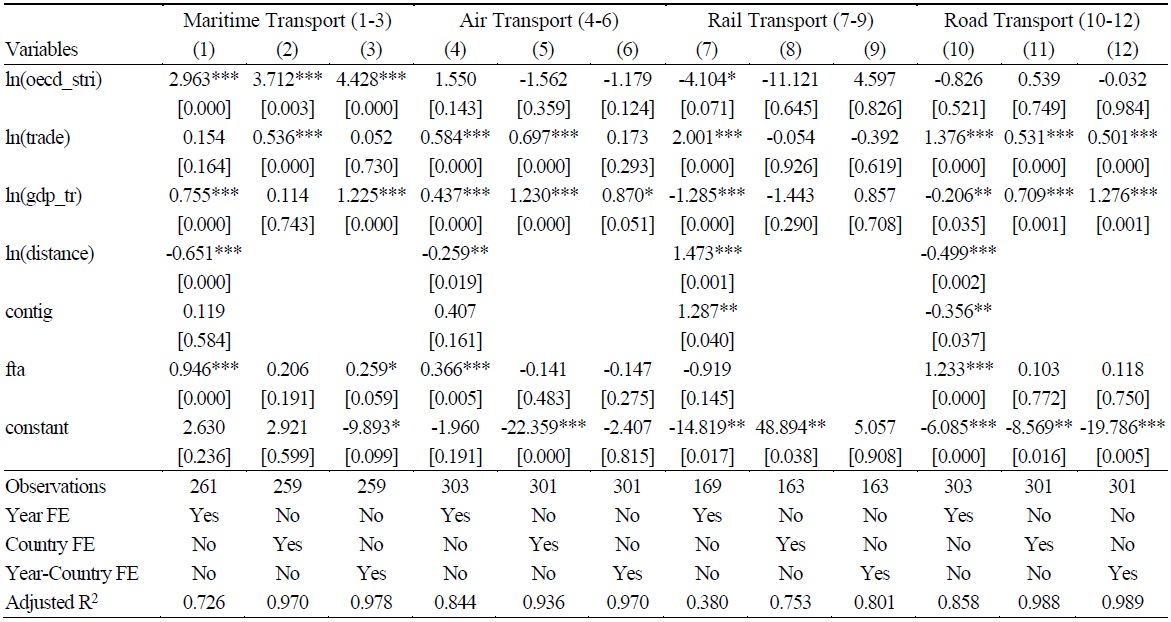
Table A9.
Continued
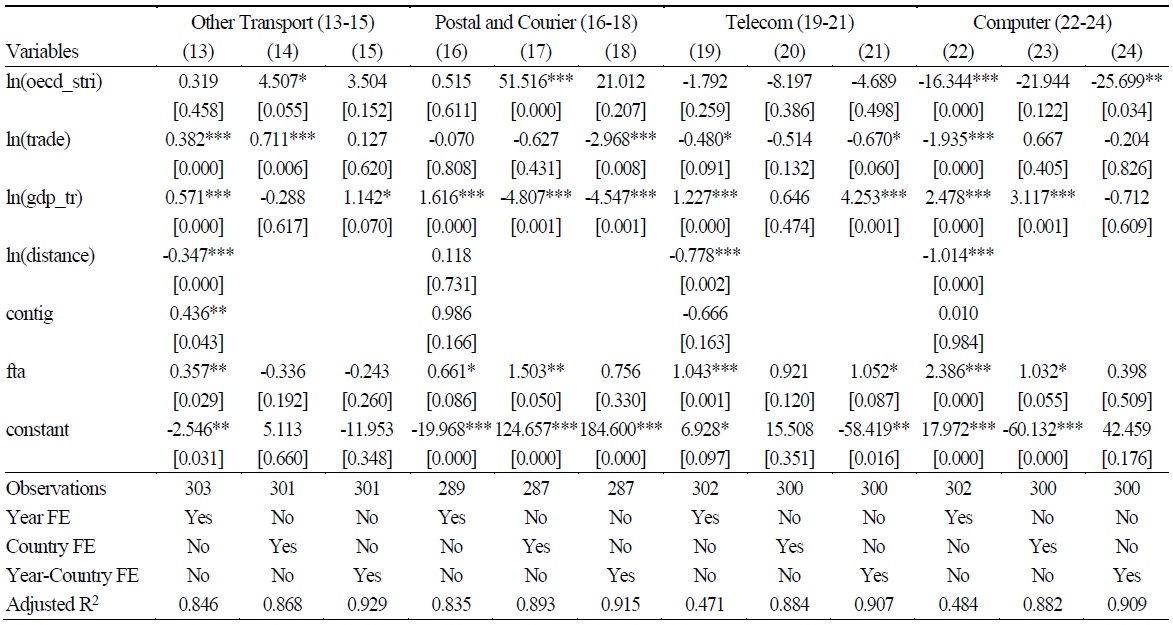
Table A9.
Continued
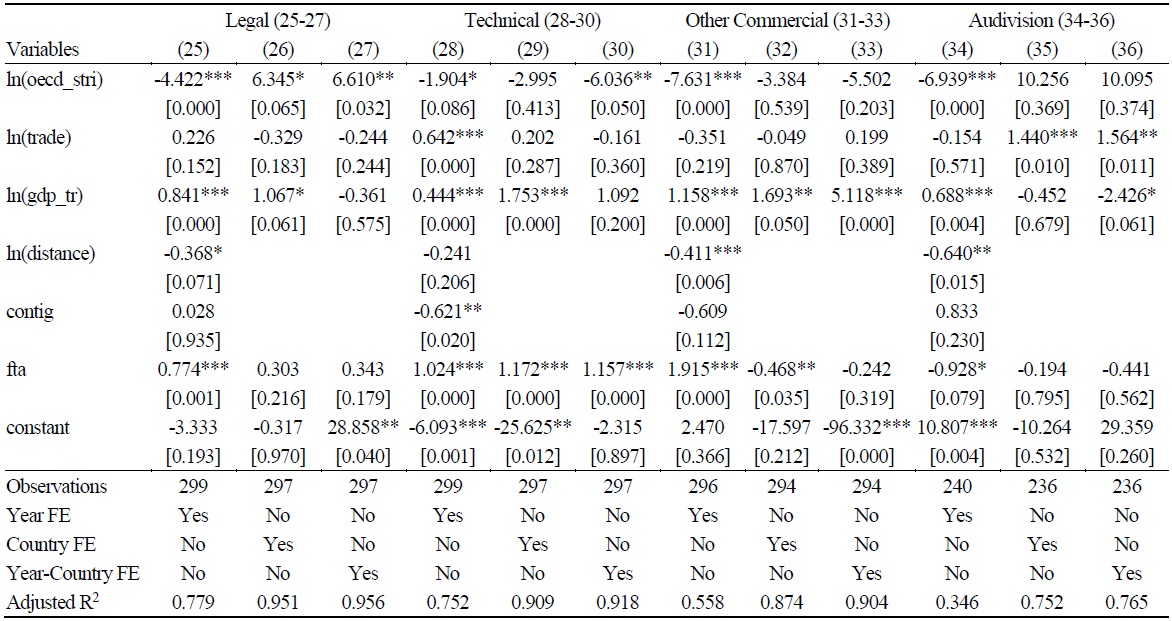
Notes: Robust standard errors in square brackets are clustered at the partner country level. *, **, *** denote significance at the 10%, 5%, and 1% levels, respectively.
Table A10.
Estimation Results for Selected Sub-Sectors (Imports)
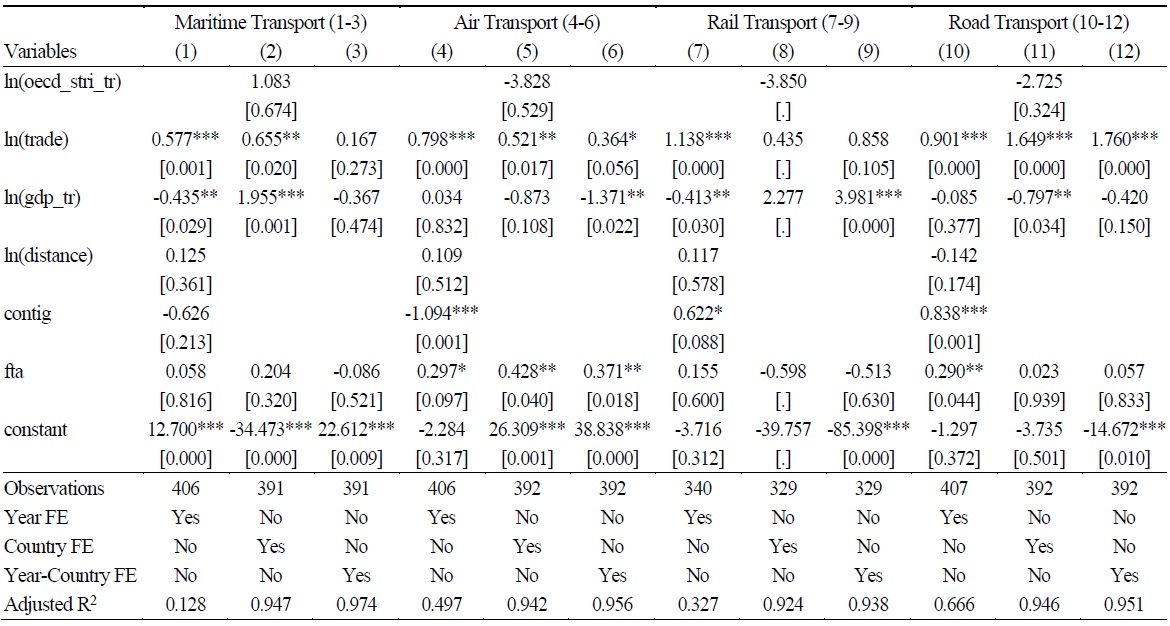
Table A10.
Continued
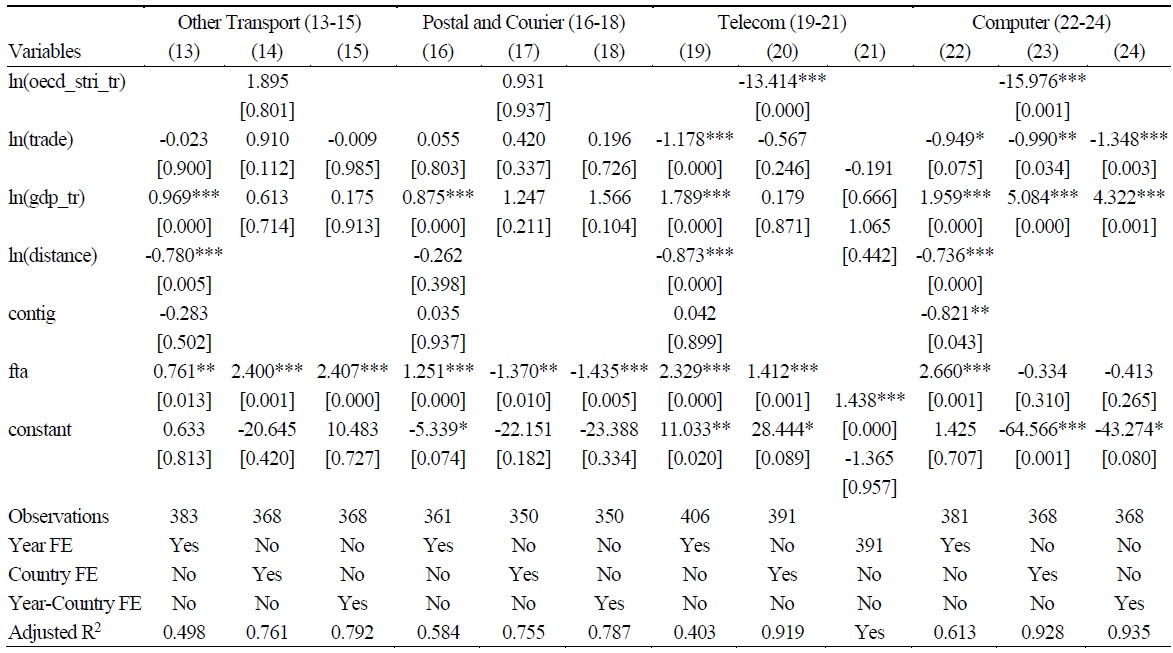
Table A10.
Continued
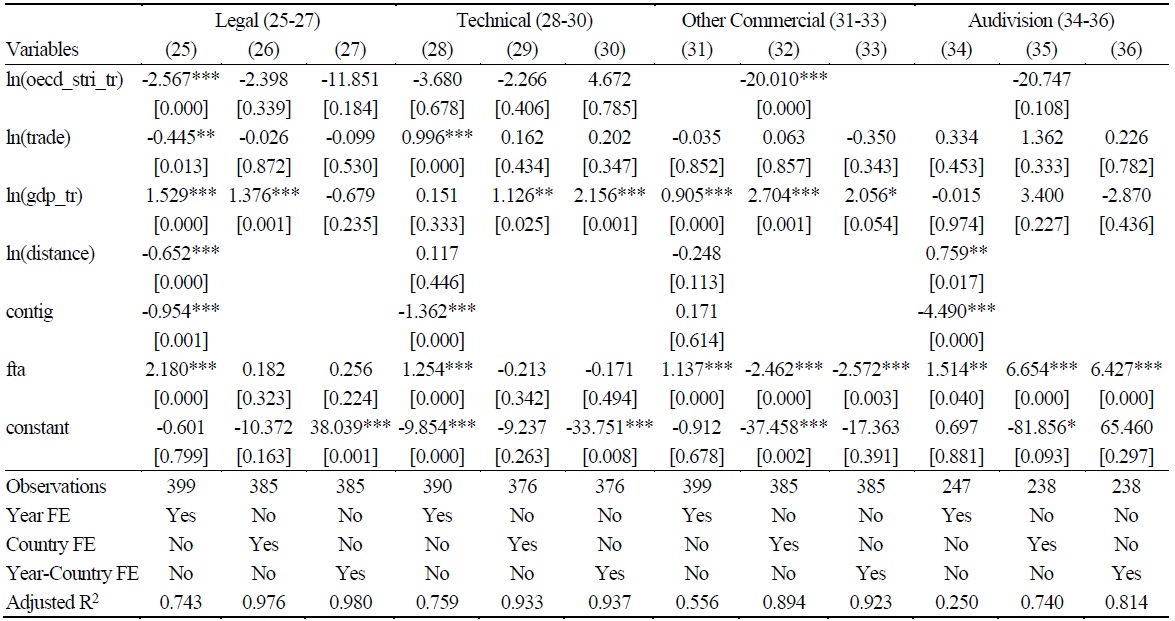
Notes: Robust standard errors in square brackets are clustered at the partner country level. *, **, *** denote significance at the 10%, 5%, and 1% levels, respectively.
References
-
Benz, S. 2017. “Services trade costs: Tariff equivalents of services trade restrictions using gravity estimation.” Paris: OECD Publishing. doi:
https://doi.org/10.1787/18166873 - Benz, S. and A. Jaax. 2019. “Quantifying the costs of regulatory barriers to trade in services: New estimates of ad valorem equivalents based on the OECD STRI.” Global Trade Analysis Project Conference Papers. Purdue University, Center for Global Trade Analysis.
-
Benz, S. and A. Jaax. 2020. “Services trade costs in the United States: A simulation based on the OECD Services Trade Restrictiveness Index.” Paris: OECD Publishing. doi:
https://doi.org/10.1787/706b87c1-en -
Benz, S., Ferencz, J., and H.K. Nordås. 2020. “Regulatory barriers to trade in services: A new database and composite indices.”
The World Economy , vol. 43, no. 11, pp. 2860-2879. doi:https://doi.org/10.1111/twec.13032 
-
Benz, S., Rouzet, D., and F. Spinelli. 2020. “Firm heterogeneity in services trade: Micro‐level evidence from eight OECD countries.”
The World Economy , vol. 43, no. 11, pp. 2905-2931. doi:https://doi.org/10.1111/twec.13031
-
Beverelli, C., Fiorini, M., and B. Hoekman. 2017. “Services trade policy and manufacturing productivity: The role of institutions.”
Journal of International Economics , vol. 104, pp. 166-182. doi:https://doi.org/10.1016/j.jinteco.2016.11.001
-
Borchert, I., Gootiiz, B., and A. Matto. 2014. “Policy barriers to international trade in services: evidence from a new database.”
The World Bank Economic Review , vol. 28, no. 1, pp. 162-188. doi:https://doi.org/10.1093/wber/lht017
-
Chen, W. C. 2024. “The impacts of policy restrictions on trade in services.”
Applied Economics , pp. 1-16.https://doi.org/10.1080/00036846.2024.2381835 -
Dincer, N. N. and A. Tekin-Koru. 2020. “The effect of border barriers to services trade on goods trade.”
The World Economy , vol. 42, no. 8, pp. 2093-2118. doi:https://doi.org/10.1111/twec.12944
-
European Commission. 2016. “Study of the EU-Turkey Bilateral Preferential Trade Framework, Including the Customs Union, and an Assessment of Its Possible Enhancement.”
Final Report .https://ec.europa.eu/smart-regulation/impact/ia_carried_out/docs/ia_2016/turkey_anx6_en.pdf (accessed on April 26, 2025) - Ferracane, M. F., Nordås, H.K., and M. G. Grosso. 2018. “Services Trade Restrictiveness Index (STRI): The Trade Effect of Regulatory Differences.” WTO Staff Working Paper ERSD-2018-03.
-
Fontagné, L., C. Mitaritonna and J. Signoret. 2016. “Estimated tariff equivalents of services NTMs.” Working Papers, HAL.
https://EconPapers.repec.org/RePEc:hal:wpaper:hal-01476543 (accessed on April 26, 2025) -
Francois, J. and B. Hoekman 2010. “Services trade and policy.”
Journal of Economic Literature , vol. 48, no. 3, pp. 642-692. doi:https://doi.org/10.1257/jel.48.3.642
- Grosso, M. G. and B. Shepherd. 2008. “Towards the development of a services trade restrictiveness index (STRI) for professional services.” APEC-IDRC Conference on Competition Policy Issues in Services Sectors. Lima, Peru: APEC.
-
Grosso, M. G., Gonzales, F., Miroudot, S., and D. Rouzet. 2015. “Services Trade Restrictiveness Index (STRI): Scoring and Weighting Methodology.” OECD Trade Policy Papers No. 177, OECD Publishing, Paris. doi:
https://doi.org/10.1787/5js7n8wbtk9r-en -
Gootiiz, B., and A. Mattoo. 2017. “Services in the Trans-Pacific Partnership: What would be lost? World Bank Policy Research Working Paper No. 7964.” doi:
https://doi.org/10.54648/trad2017031 -
Guillin, A. 2013. “Assessment of tariff equivalents for services considering the zero flows.”
World Trade Review , vol. 12, no. 3, pp. 549-575. doi:https://doi.org/10.1017/S1474745612000559
-
Gupta, P., J. Maryam, Sasmal, S., and S. Singh. 2020. “Improving the OECD Services Trade Restrictiveness Index.” Indian Institute of Foreign Trade. Delhi: Centre for WTO Studies.
https://wtocentre.iift.ac.in/workingpaper/WorkingPaper58.pdf (21 December 2024) -
Helpman, E., Melitz, M. J., and Y. Rubinstein. 2008. “Estimating trade flows: Trading partners and trading volumes.”
Quarterly Journal of Economics , vol. 123, no. 2, pp. 441-487. doi:https://doi.org/10.1162/qjec.2008.123.2.441
-
Hoekman, B. and B. Shepherd. 2021. “Services trade policies and economic integration: new evidence for developing countries.”
World Trade Review , vol. 20, no. 1, pp. 115-134.https://doi.org/10.1017/S1474745620000439
-
Kox, H. and H. K. Nordås. 2007. “Services trade and domestic regulation.” OECD Trade Policy Working Paper No. 49. OECD Publishing. doi:
http://dx.doi.org/10.1787/154365452587 - Matuszczak, Ł. 2019. “What are the Determinants of International Trade in Services?: Evidence from Firm-Level Data for Poland.” University of Warsaw, Faculty of Economic Sciences.
-
Miroudot, S., Sauvage, J., and B. Shepherd. 2013. “Measuring the cost of international trade in services.”
World Trade Review , vol. 12, no. 4, pp. 719-735. doi:https://doi.org/10.1017/S1474745613000049
-
Miroudot, S. and C. Cadestin. 2017. “Services in global value chains: From inputs to value-creating activities.” OECD Trade Policy Papers No. 197. doi:
https://doi.org/10.1787/465f0d8b-en -
Miroudot, S. and B. Shepherd. 2015. “Regional trade agreements and trade costs in services.” EUI RSCAS.
https://hdl.handle.net/1814/37759 (24 December 2024) -
Nordås, H. K. 2016. “Services Trade Restrictiveness Index (STRI): The Trade Effect of Regulatory Differences.” Paris: OECD Publishing. doi:
http://dx.doi.org/10.1787/5jlz9z022plp-en -
Nordås, H. K. 2023. “Services in the India-EU free trade agreement.” International Economics, vol. 176, no. 100460, pp. 1-23. doi:
https://doi.org/10.1016/j.inteco.2023.100460 -
Nordås, H. K. and D. Rouzet. 2017. “The impact of services trade restrictiveness on trade flows.” The World Economy, vol. 40, no. 6, pp. 1155-1183. doi:
https://doi.org/10.1111/twec.12424
-
Rouzet, D., Benz, S., and F. Spinelli. 2017. “Trading firms and trading costs in services: Firm-level analysis.” Paris: OECD Publishing. doi:
https://doi.org/10.1787/18166873 -
Shepherd, B. 2020. “Quantifying trade law: New perspectives on the services trade restrictiveness index.”
Trade, Law & Development , vol. 12, no. 270. -
Taglioni, D. and D. Winkler. 2016.
Making Global Value Chains Work for Development . Washington, DC: World Bank (Trade and Development Series). doi:https://doi.org/10.1596/978-1-4648-0157-0 -
Walsh, K. 2008. “Trade in Services: Does Gravity Hold?”
Journal of World Trade , vol. 42, no, 2, pp. 315-334. doi:https://doi.org/10.54648/trad2008014