

- EAER>
- Journal Archive>
- Contents>
- articleView
Contents
Citation
| No | Title |
|---|
Article View
East Asian Economic Review Vol. 29, No. 3, 2025. pp. 271-302.
DOI https://dx.doi.org/10.11644/KIEP.EAER.2025.29.3.450
Number of citation : 0View
104
Download
81
Trade Policies and the Shadow Economy: The Nexus of Tariffs, Non-Tariff Barriers and Trade Freedom in N-11 Countries
|
|
Sakarya University |
|---|---|
|
|
Army Institute of Business Administration |
|
|
University of Chittagong |
|
|
University of Chittagong |
|
|
University of Florida |
|
|
Bangladesh Institute of Governance and Management (BIGM) |
|
|
Stamford University Bangladesh |

Abstract
The shadow economy (SE), which is hard to define and even harder to tackle, is posing a serious challenge in emerging countries. The study examines the impact of tariff (TAR) and non-tariff (NTAR) barriers on SE in N-11 countries. Additionally, it investigates the role of market signaling factors, specifically trade freedom (TFR)’s impact on SE. Employing the method of moments quantile regression (MMQR) and mean group estimation techniques, the study analyzes panel data from 2000 to 2020. The empirical findings demonstrate that increases in TAR barriers significantly contribute to an increase in SE activities. Conversely, NTAR regulations and enhanced trade freedom substantially reduce the magnitude of informal economic activities. These results highlight the importance of non-tariff measures and trade liberalization in reducing informality and fostering a formal economy. The study offers practical insights for policymakers, economic planners, and international organizations in designing trade policies that encourage formal participation while limiting shadow economy activities.
JEL Classification: E00, O11, E69
Keywords
Shadow Economy, Informal Economy, Tariff, Non-tariff, Trade Freedom
I. Introduction
The shadow economy (SE), encompassing unregistered economic activities, exists in every country worldwide, although its size varies significantly across regions (Schneider and Enste, 2000). On average, SE accounts for 31.9% of global GDP, with some countries experiencing a larger informal sector than others (Medina and Schneider, 2018). In the Next Eleven (N-11) countries, the SE captures a substantial portion of GDP, posing economic challenges by undermining tax revenues, distorting economic policies, and hindering sustainable development. Understanding the factors contributing to SE growth is crucial, as it provides insights into regulatory inefficiencies and economic vulnerabilities. Among these factors, trade policies—specifically tariffs (TAR), non-tariff measures (NTAR), and trade freedom (TFR)—are deeply interconnected and play a pivotal role in shaping the dynamics of SE (Eilat and Zinnes, 2002; Medina and Schneider, 2018; Schneider and Enste, 2000) which motivates this study.
SE presents both opportunities and challenges for economic development. While it offers short-term benefits such as promoting entrepreneurship and income distribution, it poses long-term risks by undermining sustainable growth and policy effectiveness (Eilat and Zinnes, 2002). However, with targeted institutional and regulatory reforms, countries can gradually transition towards a more formal economy, balancing the benefits while mitigating the drawbacks of informal economic activities (Schneider and Enste, 2000). The complexities of tariffs, NTAR measures, and TFR within the N-11 emerging markets create significant governance challenges in managing the shadow economy. High tariffs are known to induce behaviors such as export under-invoicing, strengthening SE by encouraging illegal trade, and other unregulated activities (Biswas, 2012; Farzanegan, 2009). Bureaucratic inefficiencies in NTAR barriers can further increase informal trade appeal (Pohit and Taneja, 2003). Conversely, reductions in these barriers are generally associated with a decrease in the SE, attributed to enhancements in economic freedom and market transparency (Freytag et al., 2023; Amir and Gökmenoğlu, 2023).
This study investigates the impact of trade-related policies on the shadow economy in N-11 countries using panel data from 2000 to 2020. The study employs the Method of Moments Quantile Regression (MMQR) and mean group estimation techniques to capture the heterogeneous effects of tariffs (TAR), non-tariff measures (NTAR), and trade freedom (TFR) on the informal economy across different economic contexts. The empirical findings suggest that higher tariffs are associated with a significant expansion of SE, as businesses seek to evade the high costs imposed by trade restrictions. In contrast, well-structured non-tariff measures, such as regulatory procedures and quality standards, have a mitigating effect by enhancing transparency and reducing incentives for informal economic activities. Additionally, greater trade freedom advances formalization by lowering market entry barriers and reducing bureaucratic inefficiencies, encouraging firms to comply with formal economic structures. The results underscore the critical role of regulatory quality and enforcement mechanisms in shaping economic behaviors, demonstrating that trade liberalization if accompanied by strong institutional frameworks, can effectively curb informality.
Existing studies have extensively examined factors such as taxation, regulatory burdens, and institutional quality as key drivers of the shadow economy (Ali and Bohara, 2017; Buehen and Schneider, 2009; Nguyen and Thanh, 2020a; Gërxhani and Cichocki, 2023; Mazhar and Jafri, 2017; Owolabi et al., 2022; Nguyen and Thanh, 2020b; Torgler and Schneider, 2009). For example, Nguyen and Duong (2022) and Kogler et al. (2022) explore how tax policies, corruption control, and institutional quality interact with SE, while Gordon and Li (2009) and Hajilee and Niroomand (2019) emphasize the nuanced impacts of fiscal policies and trade regulations. Higher tax rates and burdensome regulations often push economic activities underground, leading to a larger informal sector (Dreher and Schneider, 2010; Friedman et al., 2000; Johnson et al., 1998), whereas regulatory discretion and corruption further exacerbate this trend (Dreher and Schneider, 2010; Loayza, 1996). Additionally, better institutional quality—characterized by the efficient rule of law and governance—has been shown to reduce the shadow economy by improving the business environment and minimizing tax evasion incentives (D’Hernoncourt and Meon, 2012; Williams, 2013; Williams and Schneider, 2016). However, no single study comprehensively examines the impact of tariffs, non-tariff barriers, and trade freedom on the shadow economy, particularly in the Next Eleven (N-11) countries. Understanding the influence of trade policies is crucial, as they directly impact market openness and regulatory costs, potentially driving economic activities into informality. This study aims to fill this gap by analyzing the effects of TAR, NTAR measures, and TFR on SE in N-11 countries, answering key research questions: (1) What is the impact of tariffs on SE? (2) How do non-tariff measures influence informal economic activities? (3) To what extent does trade liberalization contribute to reducing the SE?
The findings of this research have important implications for policymakers, economic planners, and international organizations. First, understanding the impact of trade policies—such as TAR, NTAR measures, and TFR—on SE can help design regulatory frameworks that promote formal economic participation while minimizing informality. Adjusting trade policies can strike a balance between economic openness and regulatory enforcement, promoting sustainable development. Second, the study underscores the importance of trade procedures to reduce bureaucratic inefficiencies that often push businesses into informality. Simplifying regulations and lowering compliance costs can enhance market access and encourage formalization. Third, the research offers valuable insights for international organizations and development agencies supporting emerging economies like the N-11 countries. Tailored, datadriven policy interventions can help align trade policies with regional economic needs, improve institutional quality, and build economic resilience. Ultimately, this study provides a strategic roadmap for enhancing transparency, reducing informality, and fostering inclusive economic growth.
The rest of the paper is structured as follows: Section II reviews the relevant literature and research gaps; Section III describes the data and methodology; Section IV presents the empirical results; Section V discusses policy implications; and Section VI concludes with key findings and future research directions.
II. Literature Review
1. Non-Tariff and Shadow Economy
Non-Tariff (NTAR) measures and the shadow economy (SE) are critical aspects of global trade and economic policy that significantly affect international business and development. Several studies have found a significant relationship between NTAR measures and the expansion of the SE. Ferrantino (2006), De Melo and Nicita (2018), and Cingano et al. (2016) all identified that stringent NTAR measures tend to push businesses, particularly smaller enterprises, into informal markets driven by the high cost of compliance with trade regulations. These studies consistently highlight the role of NTAR measures in increasing SE activities, particularly in countries with weak governance structures.
Conversely, some authors found a more complex or negating relationship. Schneider and Enste (2000) suggest that NTAR measures, when properly enforced with strong institutional support, do not necessarily lead to an expansion of the SE. In fact, in certain developed countries with robust legal systems, NTAR measures might reduce informal activities by strengthening regulatory compliance. Similarly, Cadot and Gourdon (2014) argue that well-designed NTAR measures can improve market transparency and reduce the incentives for businesses to engage in informal trade, challenging the notion that NTAR measures universally enhancing SE.
2. Shadow Economy and Tax
The relationship between tax revenue and the shadow economy (SE) has been widely examined across different regions, revealing both shared and unique insights. Nguyen and Duong (2022) employed a Bayesian linear regression model to explore how tax revenue and corruption control vary among BRICS nations, identifying an inverted U-shaped correlation between tax revenue and SE and mentioning the negative impact of foreign direct investment and specific economic sectors. Similarly, Buszko (2022), utilizing a Multiple Indicators Multiple Causes (MIMIC) model, highlighted the role of income, living conditions, taxes, and the macroeconomic environment in the growth of the SE in Poland and Lithuania. In line with these findings, Ulvidienė et al. (2023), using the ARDL model and ECM, analyzed Lithuania's tax structure from 2002 to 2022, showing that the corporate sector significantly outpaced GDP growth, contributing notably to state revenue. Their study also indicates that tax revenues expanded by 19% beyond the tax base, suggesting a shrinking SE, with pronounced seasonality in tax revenues, particularly in corporate profit taxes, which displayed more consistency than excise taxes. Cross-country studies further emphasize the connection between SE and tax competitiveness. For instance, Tiutiunyk et al. (2022), along with Mazurenko et al. (2023), found that informal economic activity diminishes tax competitiveness, with strategic tax measures potentially enhancing tax competition. Meanwhile, Safuan et al. (2022), using cointegration and ARDL tests, uncovered a long-term relationship between financial development and tax evasion in Indonesia, providing insights for mitigating tax evasion.
On a broader socio-economic scale, Gamal (2022) observed a positive impact of the SE on Malaysia’s economic growth, while Kogler et al. (2022) highlighted a correlation between trust, power, and tax compliance across national borders, with lower trust and power linked to larger SE. Furthermore, studies by Abuamsha and Shumali (2022) and Gnangnon (2023) connected the growth of SE to challenges in tax reform, particularly in emerging nations.
Additionally, digitization has proven to be an effective tool for discouraging tax evasion, particularly in lower-corruption environments, as found by Yamen et al. (2022). Lastly, correlation-regression analysis by Tiutiunyk et al. (2023) pointed to Estonia's highly competitive tax structure, while Nikulin (2023) and Ivcheva (2023) addressed the drivers of informal employment in Poland and Bulgaria, respectively, highlighting administrative obstacles and tax morality as key factors. These studies collectively underscore the complex and varied dynamics of the SE and its implications for tax systems across different economic and regulatory environments.
3. Tariff and Shadow Economy
The relationship between TAR and the informal economy, particularly black-market operations, has been extensively explored in developing nations, yielding both consistent and varied insights. Biswas (2012) investigated how high TAR leads to export under-invoicing, prompting importers and exporters to manipulate trade figures, which in turn contributes to the rise of underground foreign exchange markets. Biswas and Marjit (2007) extended this examination, showing that preferential trade agreements tend to initially stimulate illegal capital flight, while non-preferential trade more openly facilitates such activities. Similarly, Sheikh (1976) supported these observations, demonstrating through a geometrical model how trade restrictions foster black market creation for foreign exchange, with risk premiums driving up prices beyond those of legal markets. Further supporting these findings, Farzanegan (2009) applied a MIMIC model to Iran, revealing that higher TAR drives illegal trade but can be mitigated by trade openness, better education, and strict anti-smuggling penalties. Buehn and Eichler (2011) similarly found that trade taxes and black-market premiums increase trade mis-invoicing but emphasized that severe financial penalties can effectively reduce such practices.
On a broader scale, Gordon and Li (2009) focused on tax systems in developing countries, suggesting that inflation control and protection for capital-intensive industries can help offset tax distortions caused by different sectoral tax rates. Their findings suggest that introducing multinational corporations into previously untaxed sectors can enhance tax revenues. Together, these studies illustrate the complex interaction between TAR, informal economic activity, and black-market operations, providing insights into policy approaches that could reduce these issues in developing countries.
4. Shadow Economy and Economic Freedom
The connection between the shadow economy (SE) and various forms of freedom, particularly economic and political, has been examined through numerous studies, offering both consistent and divergent insights. Freytag et al. (2023) and Amir and Gökmenoğlu (2023) found that increases in economic freedom, along with improvements in institutional quality and trade openness, contribute to a reduction in SE. Both studies highlight the importance of legal structures and economic policies in shrinking the size of informal economies. Similarly, D’Agostino et al. (2023) observed that individual components of the economic freedom index, such as trade and business freedom, play a key role in reducing shadow activities.
On the other hand, Asongu (2013) presented a more complex scenario, showing that while liberalization policies benefit semi-formal financial sectors, they also contribute to the growth of informal and non-formal sectors, which negatively impact the formal financial sector. In a similar vein, Goel et al. (2019) found that trade openness and larger government size reduce shadow economic activity, but factors like inflation and prosperity did not show a significant influence, demonstrating a more nuanced relationship.
In contrast, Nguyen et al. (2021) and MuellerLanger (2012) highlighted mixed effects. Nguyen et al. (2021) noted that trade openness and institutional quality, particularly corruption control and political stability, initially reduce the SE in the short term, though the long-term effects are more varied. Likewise, MuellerLanger (2012) argued that the impact of parallel TFR on global well-being depends on trade costs—when costs are low, the effects are beneficial, but moderate costs can lead to negative outcomes.
Other factors influencing SE have been explored by Siddik et al. (2021) and Fedajev et al. (2022). Siddik et al. (2021) emphasized that various freedoms, such as regulation, fiscal, and business freedom, along with government integrity, exert a strong negative impact on the SE, while UEM acts as a driving force behind its expansion. Meanwhile, Fedajev et al. (2022) observed that in transition economies, higher income levels and political stability reduce the size of the SE, although market openness and higher tax burdens can enlarge it.
Lastly, Khanna (2021) found a positive relationship between trade volume and informality in BRICS nations, although the effect of trade liberalization on informality was minimal. Similarly, Nguyen et al. (2019) and Abu Alfoul et al. (2022) explored the broader implications of SE, linking its growth to higher greenhouse gas emissions and stressing the importance of strong institutional frameworks to curb underground economic activities. These studies collectively highlight the intricate and varied impacts of freedom, trade, and institutional factors on the SE across different contexts.
5. Shadow Economy and Government Spending
Many scholarly studies have explored the complex relationship between government spending (GOS) and the shadow economy (SE), offering various perspectives across different regions. Nguyen et al. (2022) and Vo et al. (2023) found that increases in GOS and fiscal imbalances are linked to the expansion of the SE, highlighting how budget deficits and weak anti-corruption measures contribute to this growth. In a similar vein, Mrabet et al. (2023) noted that in the Syrian context, government fiscal intervention is crucial for post-conflict recovery, although reducing such expenditures may have more harmful effects on growth than expanding them. However, Huynh and Nguyen (2019), studying 24 developing Asian countries, discovered a more nuanced relationship: while GOS tends to reduce SE, taxation fuels its growth. Supporting this, Cooray et al. (2017) also found that corruption worsens public debt by reducing tax revenues in economies with large informal sectors.
The current research does not fully explore how TAR, NTAR measures, and TFR affect SE in N11 countries, which have their own specific challenges. Additionally, the long-term effects of trade liberalization on these informal economies are not well understood, and this study aims to fill that gap.
6. Overview of N-11 Countries
The Next Eleven (N-11) countries—Bangladesh, Egypt, Indonesia, Iran, Mexico, Nigeria, Pakistan, Philippines, South Korea, Turkey, and Vietnam—are emerging economies with substantial growth potential and strategic importance in the global economic landscape. The selection of N-11 countries follows the Next Eleven classification by Goldman Sachs, which includes nations with emerging market characteristics and growth potential. While most selected countries are lower- or middle-income countries with high-level informality, South Korea is retained as a high-income country due to its developmental transition and historical presence of an informal sector (Medina and Schneider, 2018). Table 1 provides a comprehensive analysis of their key economic and social indicators, with a particular focus on tariff structures and the shadow economy (SE). The analysis covers critical metrics such as GDP growth rate, per capita income, literacy rate, life expectancy, poverty rate, and child mortality. These indicators reflect both economic development and social challenges faced by the N-11 nations, offering valuable insights for policymakers and development planners. A crucial aspect of this analysis is understanding the trade policies of these countries, particularly tariff and non-tariff barriers. Both tariffs and non-tariff barriers (quotas and regulatory measures) influence the cost of imported goods and services, affecting domestic markets and international competitiveness.
Tariff rates vary significantly across N-11 countries, with some nations implementing high tariff barriers to protect domestic industries while others have adopted more liberal trade policies. Higher tariffs often lead to unintended economic consequences such as an increase in smuggling, tax evasion, and under-invoicing, contributing to the expansion of the shadow economy. Countries like Nigeria and Pakistan, which have relatively high tariffs, have experienced a surge in informal economic activities, whereas nations like South Korea and Turkey, with lower tariff barriers and trade liberalization policies, have witnessed reduced informal market activities and enhanced economic transparency. The shadow economy presents significant challenges for policymakers in N-11 countries. According to Table 1, the size of SE remains substantial in many of these countries, often ranging between 10% to 40% of GDP. The persistence of a large informal sector can undermine tax revenue collection, distort economic policies, and hinder long-term growth prospects. Countries with high TAR rates and weak regulatory frameworks, such as Bangladesh and Nigeria, tend to have larger SE compared to those with stronger institutions and lower trade barriers. The data for Table 1 have been sourced from the World Bank for GDP growth, per capita GDP, poverty rates, and tariff rates; the World Health Organization for life expectancy; the United Nations Educational, Scientific and Cultural Organization for literacy rates; and the International Monetary Fund for shadow economy estimates (Medina and Schneider, 2018; WHO, 2024; World Bank, n.d.-c).
III. Data & Methodology
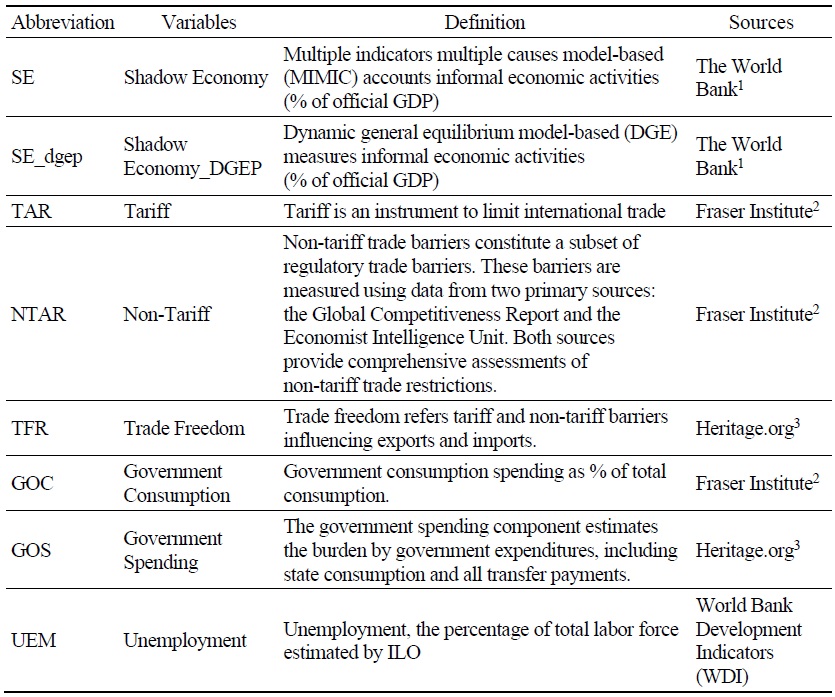
The study analyzes how tariff (TAR) and non-tariff (NTAR) influence the shadow economy (SE). In this investigation, SE is used as a dependent variable. On the other hand, TAR and NTAR are independent variables, while the TFR is a moderating variable. As control variables, government consumption (GOC), government spending (GOS), and unemployment (UEM) are used in the study. The data from 2000 to 2020 were collected from different sources, as reported in Table 2. Due to higher UEM rate and SE practices in developing countries, the study focuses on N-11 countries, which are emerging countries.
Table 3 presents the descriptive statistics of key variables, including the shadow economy (SE), tariffs (TAR), non-tariff measures (NTAR), and trade freedom (TFR). The mean value of the shadow economy, measured by the MIMIC approach, is 31.006, with a standard deviation of 11.148, indicating moderate variability in the size of the informal sector across the sampled countries. Similarly, the SE measured by the DGEP method averages 28.904, with a standard deviation of 10.921, reflecting consistent but slightly lower estimates of informality. The mean tariff rate (TAR) is 6.555, with a relatively low standard deviation of 1.288, suggesting minimal variation in trade policies across countries. In contrast, non-tariff measures (NTAR) exhibit a mean of 5.170 and a standard deviation of 1.593, implying a somewhat higher dispersion in regulatory trade restrictions. Trade freedom (TFR) has an average value of 66.952 and a standard deviation of 13.988, highlighting substantial differences in trade liberalization across the sample. These descriptive statistics underscore the economic diversity and the varying degrees of regulatory and economic challenges faced by the N-11 countries. Additionally, the Jarque-Bera test indicates that the data is not normally distributed. As a result, the Pooled Ordinary Least Squares (OLS), fixed effects, and random effects models are unable to provide efficient and unbiased estimates (Wooldridge, 2010). Our analysis of the Pooled OLS, fixed effects, and random effects models reveals that most variables are insignificant due to the non-normal distribution of the data. In contrast, the Method of Moments Quantile Regression (MMQR) identifies a significant causal relationship between the variables.
The correlation matrix in Table 4 highlights key relationships among the variables. The shadow economy (SE and SE_dgep) is positively correlated with tariff rates (TAR), indicating that higher trade barriers may drive informality. Conversely, trade freedom (TFR) is negatively correlated with SE, suggesting that greater openness helps reduce informal activities. Non-tariff measures (NTAR) show a weaker correlation, implying a limited direct impact. Additionally, government consumption (GOC) and government spending (GOS) are negatively correlated with SE, while unemployment (UEM) is positively correlated, reflecting the link between economic conditions and informality.
1. Theoretical Framework:
The theoretical model in this study assumes that the shadow economy (SE) is influenced by trade-related policies such as tariffs (TAR), non-tariff barriers (NTAR), and trade freedom (TFR), along with several control variables like government spending (GOS), government consumption (GOC), and unemployment (UEM). The hypotheses in this study are based on the established economic theories of regulation and informality. According to the “escape hypothesis” (Loayza, 1996), firms move to the informal sector when formal participation becomes too costly due to taxes, trade barriers, or complex regulations. Therefore, higher tariffs raise import costs and compliance burdens, leading firms to operate informally to remain competitive—supporting Hypothesis 1.
In contrast, non-tariff barriers (e.g., product standards and transparency measures) can either increase informality (if they are complex or arbitrary) or reduce it (if they enhance predictability and reduce rent-seeking). We hypothesize that well-structured NTARs reduce informality, assuming they improve market governance—supporting Hypothesis 2. Trade freedom reflects how open and predictable a country’s trade environment is. Following the institutional quality literature (North, 1990), increased trade openness lowers entry barriers and promotes formalization by raising the cost of non-compliance and increasing returns to formal participation—supporting Hypothesis 3.


Where
2. Econometric Strategy
Addressing the issue of cross-sectional dependence (CSD) in panel data is crucial for ensuring the accuracy of statistical estimation. Pesaran (2007) emphasizes the importance of conducting tests to prevent overestimation in cases of moderate CSD. Basak and Das (2018) outline types of CSD, while Baltagi and Pesaran (2007) point out spatial effects, spillover effects, and unobservable common factors as key sources of dependence. In the presence of CSD, the pooled OLS cannot produce efficient results.
These research contributions emphasize the need to address sectional dependence for trustworthy empirical findings. The following equation is used for the crosssectional dependency test:
Where  were calculated by using the Augmented Dickey-Fuller (ADF) regression.
In the presence of CSD, second-generation unit root tests are applied to the study. Pesaran (2007) highlights the significance of employing tests along with procedures that address CSD issues before selecting the method. Similarly, Moon and Perron (2004) further advocate for unit root tests tailored for panels with factors tackling panels and offering alternative approaches for different panel structures. Palm et al. (2011) analyzed the crucial role of using panel unit root tests that take into consideration CSD and also stressed the importance of acknowledging CSD, especially when testing homogeneity constraints in nonstationary panels. The equations are given below:
where,

where, ΔZ
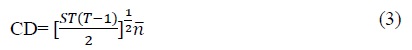
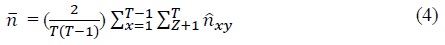
The Cointegration test identifies the long-term equilibrium connections among nonstationary data. Beck (1992) critically examines the cointegration methodology, suggesting that a single equation error correction model is more suitable when there are theories. Additionally, Perman (1991) provides an overview of cointegration theory, focusing on its application to the relationship between durable consumption and disposable income, along with summarizing its key aspects, practicality, applicability, and limitations. Moreover, Ssekuma (2011) delves into three cointegration testing methods: the Engle-Granger two-step procedure, Phillips Ouliaris residualbased tests, and Johansens multivariate technique. While Ssekuma (2011) notes inconsistencies in results across these methods, he recommends Johansen's approach for its ability to detect cointegrating relationships if they exist. Furthermore, Chen et al. (2009) introduce cointegration testing as a tool for monitoring processes and demonstrate its effectiveness in process monitoring and fault diagnosis within an industrial distillation unit. The following equations are used for the cointegration test:
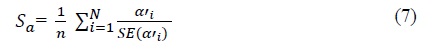
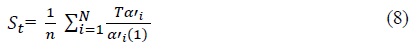
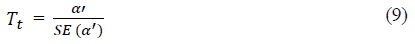

These types of statistics comprise group mean statistics (Sa, St) and panel mean statistics (Tt, Ta). Sa and St statistics are used for the cointegration test in each section, while Tt and Ta’s statistics are used for cointegration in panel data.
3. Method of Moments Quantile Regression
The Method of Moments Quantile Regression (MMQR) is used to find complex relationships. It is applied in various fields such as economics, environmental science, finance, or accounting to identify relationships between variables. It is a powerful tool for estimating quantile regressions. MMQR method is used to examine the determinants affecting energy transition and environment quality, considering data that are not normally distributed (Bakhsh et al., 2024). Hunter and Lange (2000) and Firpo et al. (2019) contributed to the development of MMQR.
The method is a useful tool for panel data analysis as it takes endogeneity, autocorrelation, and cross-sectional dependency into account (Yang et al., 2024; Alhassan et al., 2020; Alsaleh et al., 2024), which is capable of processing various forms of data and assists researchers in understanding multi-dimensional phenomena (Yan et al., 2022).
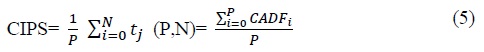
IV. CSD & CIPS Result
Table 5 presents the results of cross-sectional dependency tests for key economic variables where the findings indicate significant cross-sectional dependence for SE, SE_Dgep, NTAR, TFR, and GOC, as evidenced by their high CSD-test statistics and significant p-values (0.000). These results suggest that economic factors influencing the shadow economy and trade policies exhibit strong interdependencies across countries, likely due to shared regional policies and economic linkages. Conversely, tariffs (TAR), government spending (GOS), and unemployment (UEM) do not show significant cross-sectional dependence, implying that these variables may be influenced more by domestic factors than by international spillovers. Addressing cross-sectional dependence is crucial to ensure the robustness of econometric models and avoid biased estimates in policy analysis, as emphasized by Pesaran (2015) and Bloom et al. (2015).
Table 6 reports the results of unit root tests used to examine the stationarity of key variables, including the shadow economy (SE), tariffs (TAR), non-tariff (NTAR) measures, and trade freedom (TFR). The Im, Pesaran, and Shin (IPS) and Augmented Dickey-Fuller (ADF) tests show that the variables are nonstationary at levels but achieve stationarity after first differencing. For example, SE's test statistic changes from -1.85 at a level to -3.62 (p<0.01) after differencing, while tariffs shift from -2.12 to -3.89 (p<0.01). These results confirm the necessity of differencing to prevent spurious regression outcomes. Ensuring stationarity is crucial for reliable analysis, as nonstationary data may lead to incorrect conclusions. The findings indicate the need for cointegration techniques to explore long-term relationships between trade policies and the shadow economy. The importance of addressing unit roots for valid statistical analysis is supported by Phillips and Perron (1988) and Dickey and Fuller (1979), while Pesaran (2015) and Choi (2001) emphasize the role of differencing in achieving stationarity in panel data.
V. Result & Discussion
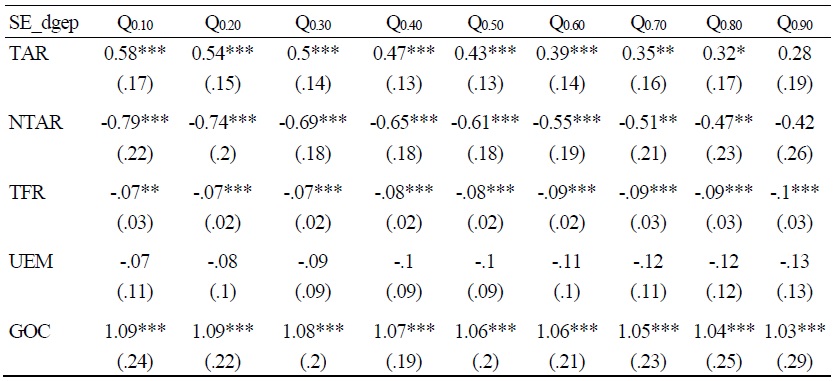
Table 7 presents the results estimating the impact of trade-related policies on the shadow economy (SE) across quantiles. The results indicate that tariff rates (TAR) have a significant positive impact on the SE, with coefficients ranging from 0.28 (p<0.01) at the lower quantile to 0.58 (p<0.01) at the upper quantile, suggesting that higher tariffs increase informality. The findings suggest that at lower quantiles, SE prevails at a lower rate, and TAR has a more robust and significant impact compared to higher quantiles. When SE is at a lower level, an increase in TAR leads to a substantial rise in SE. Conversely, when SE is more pronounced, TAR remains significant, but its impact diminishes in intensity.
These findings align with Johnson et al. (1998), who argue that elevated tariff barriers incentivize businesses to operate informally to avoid regulatory costs. Conversely, non-tariff measures (NTAR) exhibit a negative relationship with SE, with coefficients between -0.42 and -0.79 (p<0.01), indicating their effectiveness in curbing informality by enhancing regulatory compliance, consistent with De Melo and Nicita (2018). Trade freedom (TFR) demonstrates a significant negative impact across all quantiles, ranging from -0.07 to -0.10 (p<0.01), supporting the findings of Freytag et al. (2022), which highlight the role of trade liberalization in reducing informality by lowering entry barriers and enhancing institutional efficiency.
For TAR and NTAR, when quantile level increases, the significance level decreases. Higher TAR leads to an increase in SE activities. The magnitude of the coefficient decreases as the quantile level increases, implying that while TAR consistently leads to higher informality, the strength of this effect diminishes in economies where SE prevails at higher level. On the other hand, NTAR has significant negative influence on SE, suggesting that well-structured NTAR can reduce SE by enhancing market efficiency and regulatory compliance. At lower quantiles (Q 0.10, Q 0.20, Q 0.30), the effect of non-tariffs is more pronounced with larger negative coefficient. At higher quantiles (Q 0.80, Q 0.90) while the negative effect of NTAR remains statistically significant at lower magnitude. Both TAR and NTAR have robust effects on SE when informal economy exists at a lower level. On the contrary, TAR and NTAR effect diminish with larger SE activities. Similarly, TFR shows a negative relationship with the SE across all quantiles. At lower quantiles (Q 0.10 to Q 0.40) the negative impact of trade freedom is relatively stronger than the higher quantiles (Q 0.70 and Q 0.90). While the negative relationship between TFR and SE persists, the effect weakens slightly. Unemployment does not show any significant effect on SE; however, government consumption is significant at 1% level in all quantiles. Government consumption shows a consistently positive and highly significant effect across all quantiles, with coefficients ranging from 1.03 to 1.09. This strong and stable relationship implies that higher government spending is associated with a larger SE, regardless of its initial size.
1. Robustness: Mean Group Estimation
While the Method of Moments Quantile Regression (MMQR) is an advanced econometric technique, it does have limitations in capturing long-term relationships. To address this, our study also utilizes Mean Group Estimation (MGE), which is specifically designed to handle long-term relationships and can account for heterogeneous dynamics across groups (Pesaran et al., 1999). Table 8 shows the results of the Mean Group (MG) estimation technique, capturing the long-run impact of trade policies on the shadow economy across countries. The results reveal that tariffs maintain a strong positive influence on informality. This finding supports Biswas (2012), who found that increased tariff rates correlate with export under-invoicing and informal trade practices. In contrast, NTAR measures continue to show a significant negative impact, indicating their potential to deter informal activities through improved enforcement, consistent with the observations of Pohit and Taneja (2003). The negative effect of TFR remains consistent, highlighting that greater trade openness facilitates formalization, aligning with Amir and Gökmenoğlu (2023), who emphasize that trade liberalization enhances economic formalization and regulatory transparency.
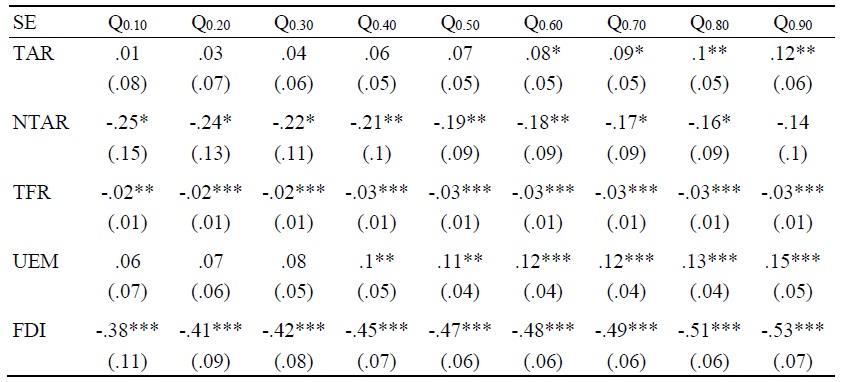
2. Robustness: Different Set of Control Variables- FDI
Table 9 presents robustness checks incorporating Foreign Direct Investment (FDI) as a control variable. FDI plays a crucial role in driving economic development (Borensztein et al., 1998). It not only boosts productivity but also facilitates the diffusion of technology (Javorcik, 2004). Therefore, FDI is a key factor to consider when examining the shadow economy (SE). The impact of tariffs still remains positive but varies in significance across quantiles, while NTAR and TFR continue to exhibit negative relationships, reinforcing the robustness of earlier findings. In addition, the inclusion of FDI further underscores the role of investment in reducing economic informality. The results suggest that FDI negatively impacts the shadow economy across all quantiles, with coefficients ranging from -0.38 to -0.53 (p<0.01), indicating that higher FDI inflows reduce informality by creating formal employment opportunities and strengthening institutions. This finding aligns with Nguyen and Duong (2022), who demonstrated the role of FDI in fostering formal economic growth in developing economies.
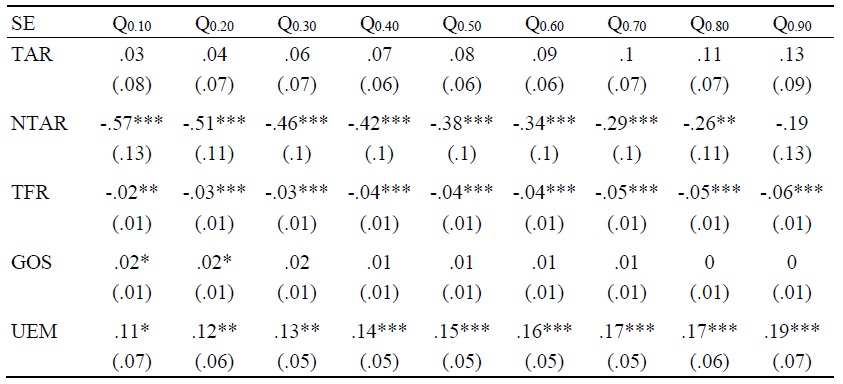
3. Robustness by Alternative of SE
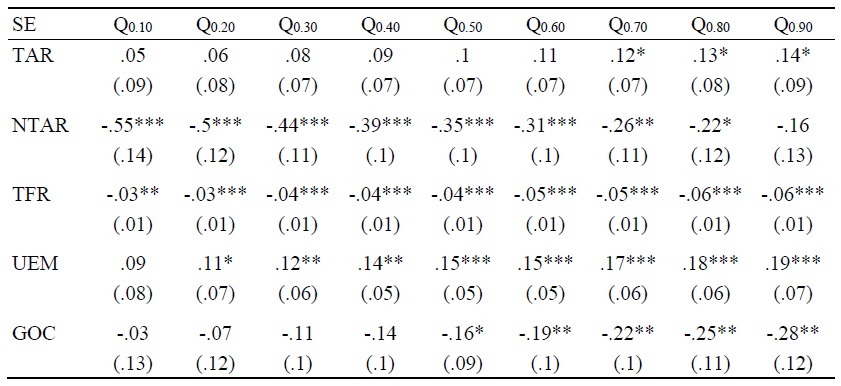
Table 10 reports the regression analysis including government spending (GOS) and unemployment (UEM) as additional explanatory variables, with SE by MIMIC approach. In this case, NTAR and TFR significantly reduce SE activities. Furthermore, the findings reveal that unemployment has a positive and significant effect on the shadow economy, with coefficients ranging from 0.11 to 0.19 (p<0.01), indicating that higher unemployment rates push individuals toward informal employment. This is in line with Loayza (1996), who found that labor market conditions play a crucial role in driving informality. Government spending, on the other hand, shows a small but significant negative impact, suggesting that increased public investment can reduce informality by improving social safety nets and public services, consistent with the findings of Cooray et al. (2017).
4. Robustness by the Alternative of SE, Including GOC
Table 11 presents the final regression model incorporating all control variables, with MIMIC estimated SE. The results confirm the earlier findings, with tariffs continuing to positively influence SE, while NTAR and TFR consistently exhibit negative relationships. The inclusion of government consumption (GOC) further highlights its mitigating effect on informality, with coefficients ranging from -0.15 to -0.22 (p<0.01), indicating that efficient public sector management helps curb informal activities. These findings align with Torgler and Schneider (2009), who argue that public sector efficiency and fiscal policies are critical in addressing informality. Overall, the results validate the robustness of the proposed model and emphasize the importance of trade policies and government interventions in influencing the shadow economy.
5. Summary of the Result
The observed relationships between trade policies and the shadow economy can be explained through several underlying mechanisms. Higher tariffs create an economic incentive for firms to evade compliance costs by shifting operations to the informal sector, where regulatory scrutiny and tax burdens are lower. This transition occurs as firms seek to maintain competitiveness and profitability in an environment where formal sector participation becomes costly and bureaucratically complex. On the other hand, well-implemented non-tariff measures (NTAR) enhance regulatory clarity and reduce transaction costs, which promotes trust and encourages firms to comply with formal economic regulations. Trade freedom plays a crucial role by reducing barriers to market entry and providing firms with greater access to international markets, creating an environment where formal participation is more attractive than operating in the informal sector.
Furthermore, the influence of macroeconomic factors such as foreign direct investment (FDI) and government spending (GOS) further clarifies these relationships. Increased FDI inflows introduce modern business practices, stricter compliance requirements, and greater competition, all of which deter informal activities by raising the opportunity cost of remaining unregistered. Similarly, effective government spending provides essential public goods and social safety nets, reducing economic uncertainty and making formal business operations more viable. Unemployment, however, acts as a driver of informality, as individuals facing limited formal employment opportunities often resort to informal work for livelihood. These findings are convincing as they align with economic theories on regulatory compliance, market competition, and institutional development, offering a logical framework for understanding how policy interventions can influence informality.
VI. Conclusion
This study analyzed the impact of trade-related policies—tariff (TAR) and non-tariff (NTAR) barriers—on the shadow economy (SE) in N-11 countries using the Method of Moments Quantile Regression (MMQR). The findings confirm that higher TAR exacerbates informality by increasing the cost of operation in the formal sector. In contrast, well-structured NTAR measures help mitigate informal economic activities by enhancing regulatory efficiency. Additionally, greater trade freedom (TFR) is also associated with a reduction in SE activities, highlighting the role of market openness in fostering formal economic growth.
These results are closely linked to today’s global and regional trade challenges. Many countries are adopting protectionist trade policies like higher tariffs and stricter regulatory rules, often in response to geopolitical tensions, supply chain disruptions, and domestic economic pressures. Although these policies aim to protect domestic industries, our findings suggest that they may unintentionally expand SE by making participation in the formal sector more costly. Many regions, including several N-11 countries, are actively participating in trade liberalization efforts such as the Regional Comprehensive Economic Partnership (RCEP) and the African Continental Free Trade Area (AfCFTA). These agreements aim to reduce trade barriers and make trade rules more consistent across countries, which supports our finding that improving non-tariff policies and promoting trade openness can help reduce informality. This suggests that well-designed trade agreements can be effective tools not only for boosting trade and investment but also for encouraging formal sector growth and improving the tax collection system. This highlights the need for policymakers to carefully consider the broader consequences of raising trade barriers.
For example, this is particularly relevant in the context of the U.S. trade policy shift under the Trump administration in 2025, which involved significant tariff increases and triggered retaliatory actions globally. Our findings suggest that such protectionist moves, while aimed at defending domestic industries, may unintentionally push economic activity into the informal sector, undermining tax systems and formal employment. As many emerging economies face similar pressures to protect domestic industries, it is important to design trade policies carefully to avoid unintended consequences. Non-tariff reforms and trade openness, if implemented effectively, can help reduce informality and support a stronger, more transparent economy.
The study's findings have important policy implications. Policymakers should focus on balancing trade policies to minimize the unintended consequences of tariffs while promoting regulatory frameworks that encourage formal business operations. Strengthening institutions and simplifying compliance procedures can further facilitate the transition from informality to formality. Additionally, fostering a transparent and competitive business environment will support economic integration and reduce incentives for informal activities. While this study provides valuable insights, it has certain limitations. The focus on N-11 countries limits the generalizability of the findings to other regions with different economic and institutional contexts. Furthermore, the study primarily considers trade-related variables, and future research could incorporate additional factors, such as technological advancements and sociopolitical influences, to provide a more comprehensive understanding of shadow economy dynamics. Expanding the analysis to other emerging economies could further validate the findings and offer broader policy recommendations.
Tables & Figures
Table 1.
Overview of N-11 Countries
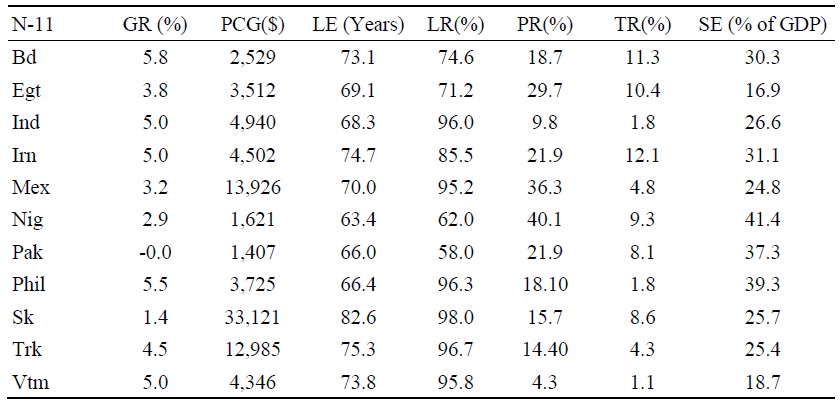
Note: N-11= N-11 countries; GR= Growth rate; PCG= per capita gdp; LE= life expectancy; LR= literacy rate; PR= poverty rate; TR= Tariff rate(applied weighted mean); SE= size of the shadow economy; Bd= Bangladesh; Egt= Egypt; Ind= Indonesia; Irn= Iran; Mex= Mexico; Nig= Nigeria; Pak= Pakistan; Phil=Philippines; Sk= South Korea; Trk= Turkey; Vtm= Vietnam.
Table 2.
Data Definition
Note: 1
Table 3.
Descriptive Statistics
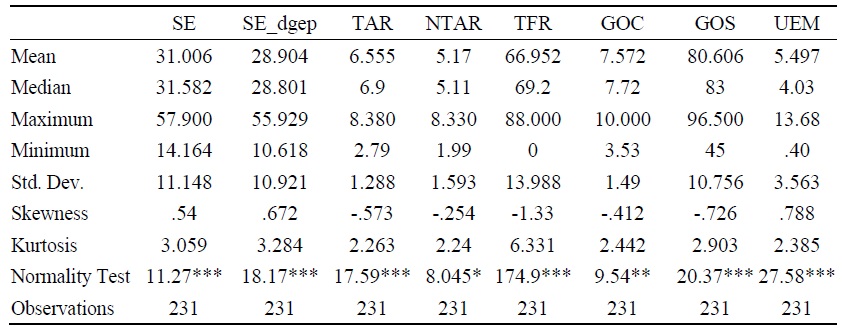
Note: *** at 1% level of significance, ** at 5% level of significance, * at 10% level of significance.
Source: Author’s calculation
Table 4.
Correlation Matrix
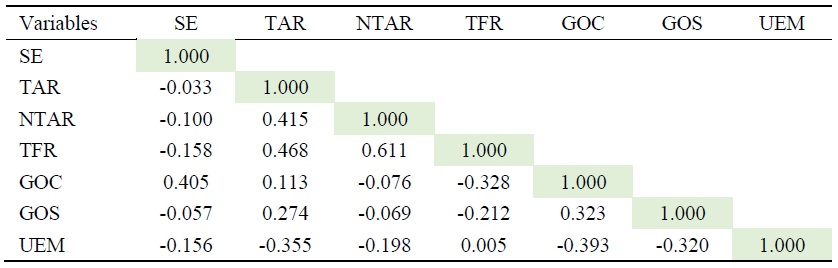
Table 5.
Result of Cross-Sectional Dependency (CSD)
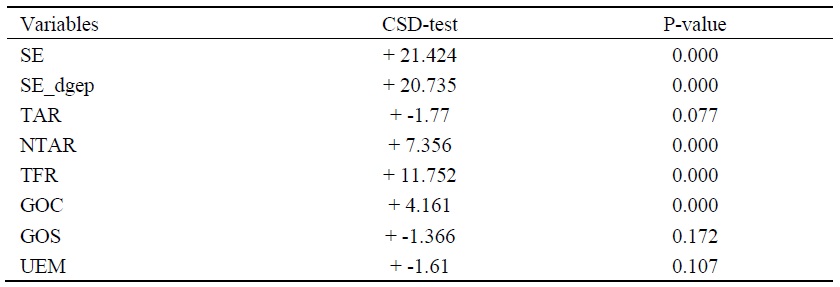
Source: Author’s calculation
Table 6.
CIPS and CADF Results
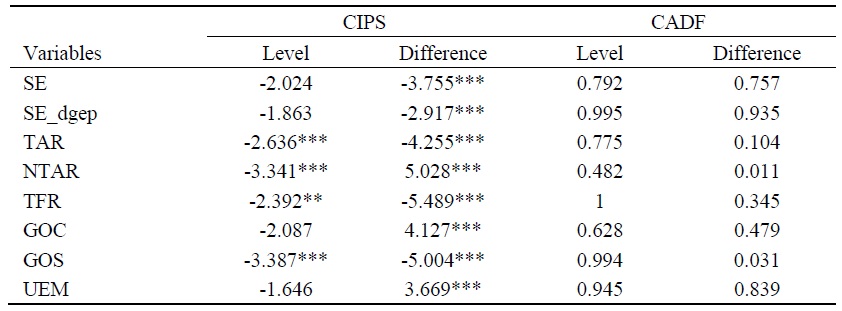
Note: *** at 1% level of significance, ** at 5% level of significance, * at 10% level of significance.
Source: Author’s calculation
Table 7.
MMQR Result
Note: Standard errors are in parentheses. *** p<.01, ** p<.05, * p<.1
Table 8.
Mean Group Estimation Result
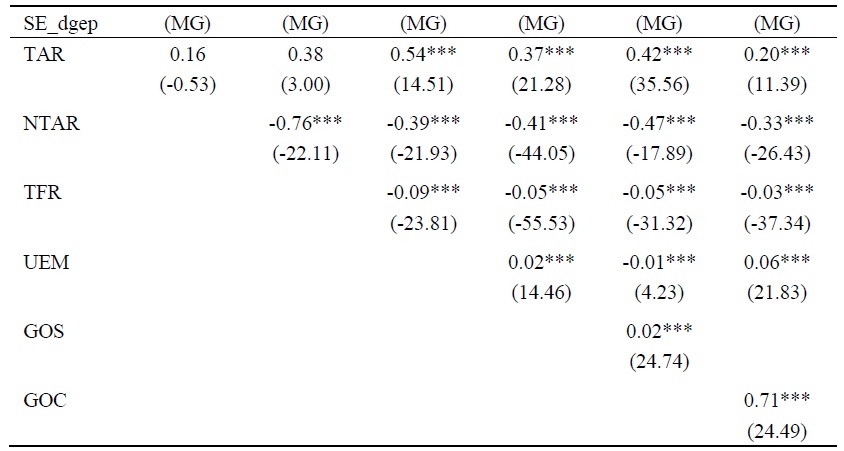
Note: T-Stat is in parentheses. *** p<.01, ** p<.05, * p<.1
Table 9.
Robustness of MMQR Result (Alternative SE)
Note: Standard errors are in parentheses. *** p<.01, ** p<.05, * p<.1
Table 10.
Robustness of MMQR Result (Alternative Control Variables)
Note: Standard errors are in parentheses. *** p<.01, ** p<.05, * p<.1
Table 11.
Robustness of MMQR Result (Alternative of SE and Control Variables)
Note: Standard errors are in parentheses. *** p<.01, ** p<.05, * p<.1
References
-
Abu Alfoul, M. N., Khatatbeh, I. N. and F. Jamaani. 2022. “What Determines the Shadow Economy? An Extreme Bounds Analysis.”
Sustainability , vol. 14, no. 10.https://doi.org/10.3390/su14105761 
-
Abuamsha, M. K. and S. Shumali. 2022. “Shadow economy in Palestinian territories using currency demand approach.”
Journal of Economics, Finance and Administrative Science , vol. 27, no. 54, pp. 364-375.
-
Alhassan, A., Usman, O., Ike, G. N. and S. A. Sarkodie. 2020. “Impact assessment of trade on environmental performance: Accounting for the role of government integrity and economic development in 79 countries.”
Heliyon , vol. 6, no. 9.https://doi.org/10.1016/j.heliyon.2020.e05046 -
Ali, M. and A. K. Bohara. 2017. “How Does FDI Respond to the Size of Shadow Economy: An Empirical Analysis under a Gravity Model Setting.”
International Economic Journal , vol. 31, no. 2, pp. 159-178.https://doi.org/10.1080/10168737.2017.1314533
-
Alsaleh, M., Abdul-Rahim, A. S., Liu, R. and Q. Sun. 2024. “Nature of property rights and motivation for blue growth: An empirical evidence from the fisheries industry.”
Natural Resources Forum , vol. 48, no. 1, pp. 184-210.https://doi.org/10.1111/1477-8947.12317
-
Amir, A. and K. Gökmenoğlu. 2023. “Analyzing the Drivers of the Shadow Economy for the Case of the CESEE Region.”
Ekonomický Časopis , vol. 71, no. 2, pp. 155-181.https://doi.org/10.31577/ekoncas.2023.02.04
-
Asongu, S. 2015. “Liberalization and financial sector competition: A critical contribution to the empirics with an African assessment.”
South African Journal of Economics , vol. 83, no. 3, pp. 425-451.
-
Bakhsh, S., Zhang, W., Ali, K. and M. Anas. 2024. “Energy transition and environmental stability prospects for OECD economies: The prominence role of environmental governance, and economic complexity: Does the geopolitical risk matter?”
Journal of Environmental Management , vol. 354.https://doi.org/10.1016/j.jenvman.2024.120358
-
Baltagi, B. H. and M. H. Pesaran. 2007. “Heterogeneity and cross section dependence in panel data models: theory and applications introduction.”
Journal of Applied Econometrics . vol. 22, no. 2, pp. 229-232.
-
Basak, G. K. and S. Das. 2018. “Understanding cross-sectional dependence in panel data [Data set].”
https://doi.org/10.48550/arXiv.1804.08326 -
Beck, N. 1992. “The methodology of cointegration.”
Political Analysis , vol. 4, pp. 237-247.
-
Biswas, A. K. 2012. “Import tariff led export under-invoicing: A paradox.”
Journal of International Trade and Economic Development , vol. 21, no. 3, pp. 347-360.
-
Biswas, A. K. and S. Marjit. 2007. “Preferential trade and mis-invoicing: Some analytical implications.”
International Review of Economics and Finance , vol. 16, no. 1, pp. 130-138.https://doi.org/10.1016/j.iref.2005.01.001
-
Biswas, A. K., Farzanegan, M. R. and M. Thum. 2012. “Pollution, shadow economy and corruption: Theory and evidence.”
Ecological Economics , vol. 75, pp. 114-125.https://doi.org/10.1016/j.ecolecon.2012.01.007
- Bloom, D. E., Kuhn, M. and K. Prettner. 2015. “The Contribution of Female Health to Economic Development.” NBER Working Paper Series, no. 21411. National Bureau of Economic Research.
-
Borensztein, E., De Gregorio, J. and J.-W. Lee. 1998. “How Does Foreign Direct Investment Affect Economic Growth?”
Journal of International Economics , vol. 45, no. 1, pp. 115-135.https://doi.org/10.1016/S0022-1996(97)00033-0
-
Buehen, A. and F. Schneider. 2009. “Corruption and the Shadow Economy: A Structural Equation Model Approach.”
IZA Discussion Papers , no. 4182. IZA Institute of Labor Economics.https://docs.iza.org/dp4182.pdf -
Buehn, A. and S. Eichler. 2011. “Trade Misinvoicing: The Dark Side of World Trade.”
World Economy , vol. 34, no. 8, pp. 1263-1287.https://doi.org/10.1111/j.1467-9701.2011.01375.x
-
Buszko, A. 2022. “Factors Fostering Shadow Economy Performance in Poland and Lithuania during 2000-2019.”
Engineering Economics , vol. 33, no. 1, pp. 4-12.https://doi.org/10.5755/j01.ee.33.1.24944
-
Cadot, O. and J. Gourdon. 2014. “Assessing the price-raising effect of Non-Tariff measures in Africa.”
Journal of African Economies , vol. 23, no. 4, pp. 425-463.
-
Chen, Q., Kruger, U. and A. Y. Leung. 2009. “Cointegration testing method for monitoring nonstationary processes.”
Industrial and Engineering Chemistry Research , vol. 48, no. 7, pp. 3533-3543.
-
Choi, I. 2001. “Unit root tests for panel data.”
Journal of International Money and Finance , vol. 20, no. 2, pp. 249-272.https://doi.org/10.1016/S0261-5606(00)00048-6
-
Cingano, F., Leonardi, M., Messina, J. and G. Pica. 2016. “Employment protection legislation, capital investment and access to credit: evidence from Italy.”
Economic Journal , vol. 126, no. 595, pp. 1798-1822.
-
Cooray, A., Dzhumashev, R. and F. Schneider. 2017. “How Does Corruption Affect Public Debt? An Empirical Analysis.”
World Development , vol. 90, pp. 115-127.https://doi.org/10.1016/j.worlddev.2016.08.020
-
D’Agostino, E., De Benedetto, M. A. and G. Sobbrio. 2023. “Does the economic freedom hinder the underground economy? Evidence from a cross-country analysis.”
Economia Politica , vol. 40, no. 1, pp. 319-341.https://doi.org/10.1007/s40888-022-00288-2
-
D’Hernoncourt, J. and P.-G. Méon. 2012. “The not so dark side of trust: Does trust increase the size of the shadow economy?”
Journal of Economic Behavior and Organization , vol. 81, no. 1, pp. 97-121.https://doi.org/10.1016/j.jebo.2011.09.010
-
De Melo, J. and A. Nicita. 2018. “Chapter 1: Non-Tariff Measures Scope and Overview.” In De Melo, J. and A. Nicita. (eds.)
Non-Tariff Measures: Economic Assessment and Policy Options for Development . UNCTAD. -
Dickey, D. A. and W. A. Fuller. 1979. “Distribution of the estimators for autoregressive time series with a unit root.”
Journal of the American Statistical Association , vol. 74, no. 366, pp. 427-431.https://doi.org/10.2307/2286348
-
Dreher, A. and F. Schneider. 2010. “Corruption and the shadow economy: An empirical analysis.”
Public Choice , vol. 144, no. 1-2, pp. 215-238.https://doi.org/10.1007/s11127-009-9513-0
-
Eilat, Y. and C. Zinnes. 2002. “The shadow economy in transition countries: Friend or foe? A policy perspective.”
World Development , vol. 30, no. 7, pp. 1233-1254.https://doi.org/10.1016/S0305-750X(02)00036-0
-
Farzanegan, M. R. 2009. “Illegal trade in the Iranian economy: Evidence from a structural model.”
European Journal of Political Economy , vol. 25, no. 4, pp. 489-507.
-
Fedajev, A., Veličković, M., Nikolić, R., Cogoljević, M. and R. Remeikienė. 2022. “Factors of the shadow economy in market and transition economies during the post-crisis period: is there a difference?”
Engineering Economics , vol. 33, no. 3, pp. 246-263.https://doi.org/10.5755/j01.ee.33.3.28417
- Ferrantino, M. J. 2006. “Quantifying the trade and economic effects of NTAR measures.” OECD Trade Policy Papers, no. 28. OECD Publishing.
-
Firpo, S., Galvao, A. F., Pinto, C., Poirier, A. and G. Sanromán. 2019. “GMM quantile regression.” June 24. The Central Bank of Uruguay.
https://www.bcu.gub.uy/Comunicaciones/Jornadas%20de%20Economa/SANROMAN_GRACIELA_2019_6271.pdf (accessed January 15, 2025) -
Freytag, A., Schneider, F. and S. E. Spiegel. 2022. “The influence of economic freedom on the shadow economy in developed and developing countries.”
Economists’ Voice , vol. 19, no. 2, pp. 205-227.https://doi.org/10.1515/ev-2022-0008
-
Friedman, E., Johnson, S., Kaufmann, D. and P. Zoido-Lobaton. 2000. “Dodging the grabbing hand: The determinants of unofficial activity in 69 countries.”
Journal of Public Economics , vol. 76, no. 3, pp. 459-493.https://doi.org/10.1016/S0047-2727(99)00093-6
-
Gamal, A. A. M. 2022. “Shadow economy and selected macroeconomic variables affecting economic growth in Malaysia.”
Montenegrin Journal of Economics , vol. 18, no. 2.https://doi.org/10.14254/1800-5845/2022.18-2.2
-
Gërxhani, K. and S. Cichocki. 2023. “Formal and informal institutions: Understanding the shadow economy in transition countries.”
Journal of Institutional Economics , vol. 19, no. 5, pp. 656-672.https://doi.org/10.1017/S1744137422000522
-
Gnangnon, S. K. 2023. “Effect of the shadow economy on tax reform in developing countries.”
Economies , vol. 11, no. 3.https://doi.org/10.3390/economies11030096
-
Goel, R. K., Saunoris, J. W. and F. Schneider. 2019. “Drivers of the underground economy for over a century: a long term look for the United States.”
Quarterly Review of Economics and Finance , vol. 71, pp. 95-106.
-
Gordon, R. and W. Li. 2009. “Tax structures in developing countries: many puzzles and a possible explanation.”
Journal of Public Economics , vol. 93, no. 7-8, pp. 855-866.
-
Hajilee, M. and F. Niroomand. 2019. “On the link between financial market inclusion and trade openness: an asymmetric analysis.”
Economic Analysis and Policy , vol. 62, pp. 373-381.https://doi.org/10.1016/j.eap.2018.10.001
-
Hunter, D. R. and K. L. Lange. 2000. “Quantile regression via an MM algorithm.”
Journal of Computational and Graphical Statistics , vol. 9, pp. 60-77.https://api.semanticscholar.org/CorpusID:120096435
-
Huynh, C. M. and T. L. Nguyen. 2019. “Fiscal policy and shadow economy in Asian developing countries: does corruption matter?”
Empirical Economics , vol. 59, no. 4, pp. 1745-1761.https://doi.org/10.1007/s00181-019-01700-w
-
Ivcheva, R. 2023. “Modeling the shadow economy. Why does the Bulgarian carry out undeclared employment?”
Economic Alternatives , vol. 4, pp. 856-866. -
Javorcik, B. S. 2004. “Does Foreign Direct Investment Increase the Productivity of Domestic Firms? In Search of Spillovers Through Backward Linkages.”
American Economic Review , vol. 94, no. 3. pp. 605-627.https://doi.org/10.1257/0002828041464605
-
Johnson, S., Kaufmann, D. and P. Zoido-Lobatón. 1998. “Regulatory discretion and the unofficial economy.”
American Economic Review , vol. 88, no. 2, pp. 387-392. -
Khanna, P. 2021. “Impact of trade liberalisation on the informal sector—A study for the BRICS.”
Indian Journal of Labour Economics , vol. 64, no. 1, pp. 101-113.https://doi.org/10.1007/s41027-020-00299-2
-
Kogler, C., Olsen, J., Kirchler, E., Batrancea, L. M. and A. Nichita. 2022. “Perceptions of trust and power are associated with tax compliance: a cross-cultural study.”
Economic and Political Studies , vol. 11, no. 3, pp. 365-381.https://doi.org/10.1080/20954816.2022.2130501
-
Li, R., Hu, S. and Q. Wang. 2024. “Reexamining the impact of natural resource rent and corruption control on environmental quality: Evidence from carbon emissions and ecological footprint in 152 countries.”
Natural Resources Forum , vol. 48, no. 2, pp. 636-660.https://doi.org/10.1111/1477-8947.12391
-
Loayza, N. V. 1996. “The economics of the informal sector: A simple model and some empirical evidence from Latin America.”
Carnegie-Rochester Conference Series on Public Policy , vol. 45, pp. 129-162.https://doi.org/10.1016/S0167-2231(96)00021-8
-
Machado, J. A. F. and J. M. C. Santos Silva. 2019. “Quantiles via moments.”
Journal of Econometrics , vol. 213, no. 1, pp. 145-173.https://doi.org/10.1016/j.jeconom.2019.04.009
-
Mazhar, U. and J. Jafri. 2017. “Can the shadow economy undermine the effect of political stability on inflation? Empirical evidence.”
Journal of Applied Economics , vol. 20, no. 2, pp. 395-420.https://doi.org/10.1016/S1514-0326(17)30018-1
-
Mazurenko, O., Tiutiunyk, I., Cherba, V., Artyukhov, A. and Y. Yehorova. 2023. “Shadow tax evasion and its impact on the competitiveness of the country’s tax system.”
Public and Municipal Finance , vol. 12, no. 2, pp. 129-142.https://doi.org/10.21511/pmf.12(2).2023.11
-
Mazurenko, O., Tiutiunyk, I., Grytsyshen, D., Daňo, F., Artyukhov, A. and R. Rehak. 2023. “Good governance: role in the coherence of tax competition and shadow economy.”
Problems and Perspectives in Management , vol. 21, no. 4, pp. 757-770.
- Medina, L. and F. Schneider. 2018. “Shadow economies around the world: What did we learn over the last 20 years.” IMF Working Papers, no. 2018/17. International Monetary Fund.
-
Moon, H. R. and B. Perron. 2004. “Testing for a unit root in panels with dynamic factors.”
Journal of Econometrics , vol. 122, no. 1, pp. 81-126.
-
Mrabet, Z., Alsamara, M., Mimouni, K. and A. Shikh Ebid. 2023. “Can government expenditure help reconstruct the Syrian economy in the post-conflict period? Evidence from the SVAR and nonlinear ARDL models.”
Applied Economics , vol. 55, no. 56, pp. 6661-6675.https://doi.org/10.1080/00036846.2023.2165615
-
Mueller‐Langer, F. 2012. “Parallel Trade and its Ambiguous Effects on Global Welfare.”
Review of International Economics , vol. 20, no. 1, pp. 177-185.https://doi.org/10.1111/j.1467-9396.2011.01016.x
-
Nguyen, C. P., Thanh, S. D., Schinckus, C., Bensemann, J. and L. T. Thanh. 2019. “Global Emissions: A New Contribution from the Shadow Economy.”
International Journal of Energy Economics and Policy , vol. 9, no. 3, pp. 320-337.https://doi.org/10.32479/ijeep.7244
-
Nguyen, C. P. and S. D. Thanh. 2020a. “Financial Development and the Shadow Economy: A Multi-Dimensional Analysis.”
Economic Analysis and Policy , vol. 67, pp. 37-54.https://doi.org/10.1016/j.eap.2020.05.002
-
Nguyen, C. P. and S. D. Thanh. 2020b. “Exports and the shadow economy: Non-linear effects.”
Journal of International Trade and Economic Development , vol. 29, no. 7.https://doi.org/10.1080/09638199.2020.1759676 -
Nguyen, C. P., Schinckus, C. and S. D. Thanh. 2021. “What are the drivers of shadow economy? A further evidence of economic integration and institutional quality.”
Journal of International Trade and Economic Development , vol. 30, no. 1, pp. 47-67.https://doi.org/10.1080/09638199.2020.1799428
-
Nguyen, P. V, Vo, D. H., Tran, T. P.-K. and N. P. Tran. 2022. “Public spending and informal economy in the Asian countries.”
Cogent Economics and Finance , vol. 10, no. 1.https://doi.org/10.1080/23322039.2022.2101220 -
Nguyen, V. D. and T. H. M. Duong. 2022. “Corruption, shadow economy, FDI, and tax revenue in BRICS: A Bayesian approach.”
Montenegrin Journal of Economics , vol. 18, no. 2. pp. 85-94.https://doi.org/10.14254/1800-5845/2022.18-2.8 -
Nikulin, D. 2023. “Driving forces of informal employment: An empirical study based on Polish enterprise data.”
Entrepreneurial Business and Economics Review , vol. 11, no. 3, pp. 93-106.https://doi.org/10.15678/eber.2023.110306
-
North, D. C. 1990.
Institutions, Institutional Change and Economic Performance . Cambridge University Press. -
Owolabi, A. O., Berdiev, A. N. and J. W. Saunoris. 2022. “Is the shadow economy procyclical or countercyclical over the business cycle? International evidence.”
Quarterly Review of Economics and Finance , vol. 84, pp. 257-270.https://doi.org/10.1016/j.qref.2022.01.017
-
Palm, F. C., Smeekes S. and J.-P. Urbain. 2011. “Cross-sectional dependence robust block bootstrap panel unit root tests.”
Journal of Econometrics , vol. 163, no. 1, pp. 85-104.
-
Perman, R. 1991. “Cointegration: an introduction to the literature.”
Journal of Economic Studies , vol. 18, no. 3.
-
Pesaran M. H. 2006. “Estimation and inference in large heterogeneous panels with a multifactor error structure.”
Econometrica , vol. 74, no. 4, pp. 967-1012.https://doi.org/10.1111/j.1468-0262.2006.00692.x
-
Pesaran M. H. 2007. “A simple panel unit root test in the presence of cross‐section dependence.”
Journal of Applied Econometrics , vol. 22, no. 2, pp. 265-312.
-
Pesaran M. H. 2015. “Testing weak cross-sectional dependence in large panels.”
Econometric Reviews , vol. 34, no. 6-10, pp. 1089-1117.https://doi.org/10.1080/07474938.2014.956623
-
Pesaran, M. H., Shin Y. and R. P. Smith. 1999. “Pooled mean group estimation of dynamic heterogeneous panels.”
Journal of the American Statistical Association , vol. 94, no. 446, pp. 621-634.https://doi.org/10.1080/01621459.1999.10474156
-
Phillips P. C. B. and P. Perron. 1988. “Testing for a unit root in time series regression.”
Biometrika , vol. 75, no. 2, pp. 335-346.https://doi.org/10.2307/2336182
-
Pohit S. and N. Taneja. 2003. “India’s informal trade with Bangladesh: A qualitative assessment.”
World Economy , vol. 26, no. 8, pp. 1187-1214.https://doi.org/10.1111/1467-9701.00568
-
Safuan, S., Habibullah M. S. and E. A. Sugandi. 2022. “Eradicating tax evasion in Indonesia through financial sector development.”
Cogent Economics and Finance , vol. 10, no. 1.https://doi.org/10.1080/23322039.2022.2114167
-
Schneider, F. and D. H. Enste. 2000. “Shadow economies: Size, causes, and consequences.”
Journal of Economic Literature , vol. 38, no. 1, pp. 77-114.
-
Sheikh, M. A. 1976. “Black market for foreign exchange, capital flows and smuggling.”
Journal of Development Economics , vol. 3, no. 1, pp. 9-26.
-
Siddik, M. N. A., Kabiraj, S., Hosen M. E. and M. F. Miah. 2021. “Impacts of Political Stability on Shadow Economy: Evidence from Bay of Bengal Initiative for Multi-sectoral Technical and Economic Cooperation Countries.”
Vision: The Journal of Business Perspective , vol. 26, no. 2, pp. 221-231.https://doi.org/10.1177/0972262920988387
- Ssekuma, R. 2011. “A study of cointegration models with applications [Thesis, University of South Africa].” UNISA Institutional Repository.
-
Tiutiunyk І., Mazurenko О., Spodin, S., Volynets, R. and M. Hladkovskyi. 2022. “The nexus between international tax competitiveness and the shadow economy: A cross-countries analysis.”
Financial and Credit Activity: Problems of Theory and Practice , vol. 1, no. 42, pp. 196-205.https://doi.org/10.55643/fcaptp.1.42.2022.3703
-
Tiutiunyk, I., Taranenko, V., Mazurenko, O., Artyukhov, A. and Y. Yehorova. 2023. “International tax competition as an element of the country’s marketing strategy.”
Innovative Marketing , vol. 19, no. 4, pp. 297-309.http://dx.doi.org/10.21511/im.19(4).2023.24
-
Torgler, B. and F. Schneider. 2009. “The impact of tax morale and institutional quality on the shadow economy.”
Journal of Economic Psychology , vol. 30, no. 2, pp. 228-245.https://doi.org/10.1016/j.joep.2008.08.004
-
Ulvidienė, E., Meškauskaitė, I., Stavytskyy, A. and V. R. Giedraitis. 2023. “An Investigation of the Influence of Economic Growth on Taxes in Lithuania.”
Ekonomika , vol. 102, no. 1, pp. 41-59.https://doi.org/10.15388/Ekon.2023.102.1.3
-
Vo, D. H., Tran, N. P., Tran, T. P.-K., Le, Q. T.-T. and P. V. Nguyen. 2023. “Government expenditure, budget deficit and shadow economy.”
Journal of Economic Policy Reform , vol. 26, no. 4, pp. 442-460.https://doi.org/10.1080/17487870.2023.2268250
-
WHO. 2024. “Neonatal mortality rate (0 to 27 days) per 1000 live births (SDG 3.2.2) [Data set].” Retrieved January 21, 2025.
https://www.who.int/data/gho/data -
Williams, C. C. 2013. “Beyond the formal economy: Evaluating the level of employment in informal sector enterprises in global perspective.”
Journal of Developmental Entrepreneurship , vol. 18, no. 4.https://doi.org/10.1142/S1084946713500271 -
Williams, C. C. and F. Schneider. 2016.
Measuring the Global Shadow Economy: The Prevalence of Informal Work and Labour . Edward Elgar Publishing. -
Wooldridge, J. M. 2010.
Econometric Analysis of Cross Section and Panal Data . MIT Press. -
World Bank. (n.d.-a) “Country Profiles [2024, Data set].”
https://pip.worldbank.org/countryprofiles/BGD (accessed January 21, 2025) -
World Bank. (n.d.-b) “The World Bank in Bangladesh.” World Bank Group.
https://www.worldbank.org/en/country/bangladesh/overview (accessed January 16, 2024) -
World Bank. (n.d.-c) “World Bank Open Data [Data set].” World Bank Group.
https://data.worldbank.org -
Yamen, A., Coskun, A. and H. Mersni. 2022. “Digitalization and tax evasion: the moderation effect of corruption.”
Economic Research-Ekonomska Istrazivanja , vol. 36, no. 2.https://doi.org/10.1080/1331677x.2022.2142634 -
Yan, Y., Zhou, J., Zhou, S., Rao, D., Zhou, J. and Z. Fareed. 2022. “Investigating the Role of Education, Foreign Investment, and Economic Development for Sustainable Environment in BRI Countries: Application of Method of Movements Quantile Regression.”
Frontiers in Environmental Science , vol. 10(April), pp. 1-12.https://doi.org/10.3389/fenvs.2022.874275 -
Yang, M., Magazzino, C., Awosusi, A. A. and N. Abdulloev. 2024. “Determinants of Load capacity factor in BRICS countries: A panel data analysis.”
Natural Resources Forum , vol. 48, no. 2, pp. 525-548.https://doi.org/10.1111/1477-8947.12331