

- EAER>
- Journal Archive>
- Contents>
- articleView
Contents
Citation
| No | Title |
|---|
Article View
East Asian Economic Review Vol. 29, No. 3, 2025. pp. 371-393.
DOI https://dx.doi.org/10.11644/KIEP.EAER.2025.29.3.453
Number of citation : 0View
53
Download
50
Temperature Change and Central Banks’ Policy: Evidence from the ASEAN+3 Countries
|
|
University of Crete |
|---|

Abstract
This study investigates the impact of temperature shocks on prices and output for the ASEAN+3 countries, using annual data for the 1990-2023 period. Based on the panel SVAR framework, the empirical evidence indicates that temperature shocks, which can be considered as negative supply shocks, lead to output contraction and cause inflationary pressures. When the sample is split into two subgroups, namely the ten ASEAN countries and the +3 advanced economies, similar findings are derived. These effects seem to be quite persistent as they last for several years after the initial shock. Moreover, the results imply that temperature shocks initiate expansionary fiscal policies, which are of greater magnitude in the case of the +3 economies. For these three countries, a temperature shock also triggers a rather temporary expansionary monetary policy. The discussion that follows indicates that the monetary authorities of the region may have a role to play in dealing with the adverse effects of climate change. The use of new financial tools, such as green bonds and green loans, could be a solution. However, their use should be prudent because of the potential risks they bear.
JEL Classification: C33, E58, Q54
Keywords
ASEAN+3, Panel SVAR, Temperature Shock, Inflationary Pressures, Output Contraction
I. Introduction
Ever since the beginning of the industrial revolution, human intervention in the physical environment and the exploitation of natural resources have been promoting economic growth and improving the quality of life for the global population. On the negative side, this human behavior has been affecting a continuous and dramatic environmental degradation (continuous increases in greenhouse gas emissions, deforestation, air and water pollution, etc.), the culmination of which is global warming and climate change. The Intergovernmental Panel on Climate Change (IPCC) estimates that global temperatures have risen by around one degree Celsius since 1850, while this increase could exceed four degrees Celsius by the end of the 21st century. Furthermore, scientific research indicates that this increasing trend may be accelerated by tipping points and non-linearities, making predictions for the future quite difficult (IPCC, 2018). In general, there is a consensus among scientists that global warming is expected to worsen in the coming years. This will negatively affect ecosystems, water resources, food production and human settlements and, thus, will jeopardize the prospects of global economy and human society in general. Also, these effects seem to be more severe for poorer and underdeveloped countries.
Regarding the economic impact of climate change, most relevant scientific studies focus on the effects of climate-related variables on economic growth and welfare (see,
The present study contributes to the scientific literature in several ways. Firstly, it focuses on a panel consisting of the ASEAN+31 countries for a period that exceeds 30 years and explores the impact of temperature changes on output and inflation, as well as on government expenditure and broad money supply. To the best of our knowledge, this is the first study that attempts to determine the effects of climate change on the macroeconomic variables for these countries. Furthermore, two subgroups are also considered: the ten ASEAN countries and the +3 economies, namely China, Japan and the Republic of Korea. The reason is that there are substantial differences between these two subgroups, not only in terms of adopted monetary policy framework, economic structure and institutions, but also in terms of climate change exposure. Additionally, the +3 countries are the most highly developed and industrialized economies in Southeast Asia, which implies that their contribution to climate change is comparatively higher. On the other hand, due to their economic resources, it is quite easier for these economies to finance the transition to a ‘greener’ economy.
The motivation for the selection of the specific countries stems from the fact that the impact of extreme weather due to climate change is increasing in the region of Southeast Asia, ruining lives and contracting output.
Secondly, regarding the econometric methodology adopted, this study has implemented first- and second-generation panel unit root tests, along with the advanced panel SVAR methodology with the appropriate identification restrictions. In brief, the empirical evidence suggests that a temperature shock that lowers labour productivity will lead to output contraction, and it will boost inflationary pressures, and that these two effects will be quite persistent. The results also imply that a temperature shock triggers expansionary fiscal policies. This latter effect seems to be greater in magnitude and more persistent in the case of the +3 economies. Furthermore, it is only in the subgroup of the +3 economies that a temperature shock also triggers an expansionary monetary policy. However, this effect is rather temporary as it lasts for only one year after the initial shock.
The rest of the paper is organized as follows. Section II illustrates the econometric methodology, while section III describes the data and analyzes the empirical results. Section IV provides a discussion regarding the ways that monetary authorities should react when inflationary pressures are generated due to temperature changes. The last section provides some concluding remarks.
1)The Association of Southeast Asian Nations (ASEAN) was formed in 1967 as a political and economic union that currently consists of 10 countries, namely Brunei Darussalam, Cambodia, Indonesia, Lao PDR, Malaysia, Myanmar, the Philippines, Singapore, Thailand and Viet Nam. The +3 countries are China, Japan and the Republic of Korea. The evolving economic cooperation between the ASEAN and the +3 countries began in 1997 to promote cooperation towards the longterm goal of creating an East Asian Community.
2)
3)
II. Econometric Methodology
1. Unit Root and Cross-sectional Dependence Tests
Initially, each series has been tested for unit roots. In the panel data framework, the theoretical literature provides two generations of tests. The most common firstgeneration tests, which assume cross-sectional independence, are the Breitung and the Levin, Lin and Chu (LLC) tests that investigate common unit roots (Breitung, 2001; Levin et al., 2002), and the Im, Pesaran and Shin (IPS) test that explores individual unit roots (Im et al., 2003). However, cross-sectional independence is a strong assumption and whether it does not hold, the results of these tests may be inaccurate. Thus, we test for cross-sectional dependence using four tests: the LM test of Breusch and Pagan (1980), the scaled LM and CD tests of Pesaran (2004), and the biascorrected scaled LM test of Baltagi et al. (2012). As shown in the next section, cross-sectional independence is rejected for each series. Thus, cross-sectional dependence should be taken into consideration in the analysis.
Regarding the second-generation unit root tests, which allow for cross-sectional dependence, three tests have also been employed. The first one is the PANIC test developed by Bai and Ng (2004) and is based on a factor model and allows one or more common factors and idiosyncratic components to drive the data. Since there is no prior knowledge regarding the stationarity or not of these elements, non-stationarity can arise from common factors, idiosyncratic components or both. For example, for a single common factor, the data generating process for a series

where  and the idiosyncratic error components,
  are obtained. To test for a unit root in
  one can use the
  the following pooled test statistic has been proposed:
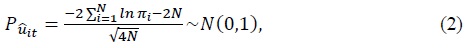
where
The second test proposed by Pesaran (2007) extends the ADF test in a panel framework. In particular, the cross-sectionally augmented Dickey–Fuller (CADF) equation is the following:

where  is the cross-section mean. Initially, Equation (3) is estimated for each cross unit, and then, the

The truncated version of the CIPS test statistic, CIPS*, has also been developed to counter the influence of possible extreme outcomes that may occur in the case of a small
2. Panel SVAR Modeling
As shown in the next section, all series included in the current analysis are stationary. Therefore, the panel structural vector autoregression (PSVAR) model developed by Pedroni (2013) is highly suited to explore the effects of temperature shocks on inflation, output and other basic macroeconomic variables. This model requires a specific ordering of the variables under examination and, thus, it is quite appropriate for the current analysis as several past studies have provided standard variable ordering regarding the responses of inflation and output to shocks (see,
In brief, let the following panel be assumed:

where 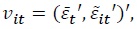 where
where  are
are

where 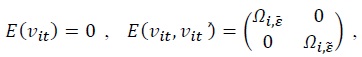
The first step for the estimation of the PSVAR model is to compute the time effects,  and then to use them together with Δ
 and
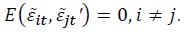
and  the appropriate identifying restrictions (either short- or long-run) combined with the reduced form estimates can be used to obtain the structural shock estimates for
  The third step is to compute the diagonal elements of the loading matrix,
  for each individual cross-unit
  and to an idiosyncratic shock,
  are derived, where
  The sample distribution of estimated impulse responses can be used to compute the median and the confidence interval quantiles.
In the case of PSVAR model, there exists a contemporaneous relation among the variables included. Thus, it is crucial to select the appropriate identification restrictions when estimating this model. Pedroni (2013) indicates that the long-run identification restrictions proposed by Blanchard and Quah (1989) are suitable only when the series under investigation follow unit root processes, even after time effects have been removed. In contrast, when the series are stationary, as it is the case in this study, the short-run Cholesky identification restrictions constitute the suitable scheme.
Regarding variable selection, the current study follows the analysis of Mukherjee and Ouattara (2021) and employs a five-variable model consisting of temperature change (as a proxy for climate change), government expenditure as a percentage of GDP, real GDP, prices and percentage changes in money supply. The choice of these endogenous variables has also taken into consideration the existing literature regarding the responses of inflation to economic policy shocks (see,
III. Data and Empirical Results
1. Data
The dataset is comprised of annual data for the 1990-2023 period, for thirteen countries of Southeast Asia, namely the ten ASEAN countries: Brunei Darussalam, Cambodia, Indonesia, Lao PDR, Malaysia, Myanmar, the Philippines, Singapore, Thailand and Viet Nam, as well as the +3 economies: China, Japan and the Republic of Korea. Regarding the climate change variable, it has been proxied by the surface temperature percentage changes (Temp). These data have been obtained from the Climate Change Indicators (CCI) database of the International Monetary Fund (IMF) for all countries except Singapore, for which the IMF database has several missing values. For this reason, the data for this country have been obtained from the Climate Change Knowledge portal of the World Bank.
Data for the general government total expenditure as a percentage of the GDP (G) have been obtained from the World Economic Outlook database of the IMF for all sample countries. However, for some countries, the IMF database begins after 1990: for Cambodia in 1996, for Indonesia in 1993, for the Republic of Korea in 1995, for Lao PDR in 2000, for Myanmar in 1998, for Thailand in 1995 and for Viet Nam in 2010. The G series has been completed using official data from the World Development Indicators (WDI) database of the World Bank for Indonesia, Republic of Korea and Thailand, as well as from the Asian Development Bank for Cambodia, Lao PDR, Myanmar and Viet Nam.
Regarding real output (GDP), the data used in this study refer to PPP-adjusted real GDP in USD and have been obtained from the WDI database of the World Bank. As far as prices are concerned, the GDP deflator (GDPdf) has been used, while the respective data have been collected from the WDI database of the World Bank. Note that this index is preferable than the consumer price index (CPI) because it is more accurate, as it includes all goods and services. On the other hand, the CPI covers the price fluctuations of a specific basket of goods, and for this reason is quite restrictive.
Finally, regarding money supply, the percentage changes of broad money (M) have been used, while the respective data have been obtained from the WDI database of the World Bank. As in the case of G, for some countries, this database is incomplete because it either begins after 1990 (for Brunei Darussalam in 2000, for Cambodia in 1994 and for Viet Nam in 1996), or it stops before 2023 (for Lao PDR in 2010). The M series has been completed using official data from IMF staff reports for Brunei Darussalam and from the Asian Development Bank for the rest of the countries. Data for GDP and GDPdf have been transformed into natural logarithms, while the descriptive statistics of all variables are reported in Table 1.4
2. Unit Root and Cross-sectional Dependence Test Results
The test results for the three first-generation tests, LLC, Breitung and IPS, are reported in Table 2. As shown in this table, the unit root hypothesis is rejected for all the series under consideration, at the 5 percent level of significance. However, as noted above, these results assume independence among cross units, which is a quite strong assumption. Thus, each series has been tested for cross-sectional dependence, and the results are presented in Table 3. As shown in this table, the null hypothesis of cross-sectional independence is rejected for all variables, at the 5 percent level of significance. Following this evidence, each series has been tested for a unit root, using the three second-generation tests that assume cross-sectional dependence. The results of the PANIC test (Bai and Ng, 2004) are reported in Table 4 and indicate that for each series the unit root hypothesis is rejected for both the common factor and the idiosyncratic elements. The CIPS and CIPS* statistics of Pesaran (2007) in Table 5 also imply stationarity for all series. Finally, the results of the test of Palm et al. (2011) in Table 6 show evidence of stationarity for Temp, G and M, while the series of output and prices seem to have a unit root. Overall, the above findings provide evidence of stationarity for all the variables used in the current empirical analysis.5
3. PSVAR Results and Impulse Responses
Since the above tests have shown evidence of stationarity for all variables, the PSVAR model described in Equation (5) has been estimated for the group of the ASEAN+3 countries, as well as for the two subgroups of the ASEAN countries and the +3 economies. As already mentioned, all series are stationary and, hence, the short-run Cholesky identification restrictions is the suitable scheme to identify the shocks. The next step in the analysis is to determine the lag structure of the PSVAR model. Since the dataset consists of annual observations, the maximum lag has been set equal to 4, which roughly corresponds to a political cycle. Then, the general to specific procedure (GTOS) has been implemented. This procedure suggests an optimal laglength that equals 2 for the group of ASEAN+3 countries, as well as for the two subgroups considered in the analysis. Therefore, a PSVAR(2) model has been adopted.
Figure 1 presents the impulse responses of the macroeconomic variables to a temperature shock, along with the 25% and 75% confidence intervals, for the group of the ASEAN+3 countries. In general, a temperature shock tends to lower labour productivity and, thus, it can be considered as a negative supply shock which both generates inflationary pressures and decreases output. The graphs in the first row of Figure 1 provide a depiction of a composite shock, whereas the ones in the second and third rows provide a depiction of a common shock and an idiosyncratic shock, respectively. As shown in the figure, a temperature shock contracts output, while it boosts inflationary pressures. What is important is that these effects seem to be persistent as they do not diminish over time. Moreover, the evidence implies that a temperature shock triggers an expansionary fiscal policy which is also quite persistent as it seems to last for several years after the initial shock. This is an expected result that reflects the immediate use of fiscal tools by governments as standard tools to counterbalance the economic damage caused by temperature shocks. Of course, such policy interventions should be characterized with prudence because they are quite costly.6 On the other hand, a temperature shock does not seem to trigger an expansionary monetary policy for the full group of the ASEAN+3 countries.7
Moving on to the impulse responses for the subgroup of the ten ASEAN countries, which are reported in Figure 2, a temperature shock reduces output and generates inflationary pressures, as in the case of the full sample, while it does not trigger any expansionary monetary policy. However, for this group of countries that is mainly consists of emerging economies, the expansionary fiscal policy that is triggered by a temperature shock seems to be smaller in magnitude (in relation to the full sample) and is fading out only a few years after the initial shock. Regarding the impulse responses for the subgroup of the wealthy and developed +3 economies, which is presented in figure 3, a temperature shock (or, in other words, a negative supply shock) contracts output and boosts inflationary pressures, as in the cases of the ASEAN+3 countries and the ten ASEAN economies. However, probably due the availability of resources in China, Japan and the Republic of Korea, the expansionary fiscal policy that is triggered by a temperature shock is quite persistent, as it is not diminishing in the periods following the initial shock. Finally, for this subgroup of countries, there is evidence that a temperature shock also causes an expansionary monetary policy, which seems to be temporary since it lasts only a year after the initial shock.
The above empirical evidence seems to be quite similar to that of existing studies regarding the effects of a temperature shock to output and inflation (see,
4)For saving space, the descriptive statistics of the two subgroups, namely the ASEAN countries and +3 economies, are not reported in the paper but are available under request.
5)The unit root and the cross-sectional dependence tests have also been implemented for the two subgroups of the analysis, namely the ASEAN countries and the +3 economies. These results, which are not reported in the paper but are available under request, also imply stationarity and cross-sectional dependence for each series.
6)Governments can obtain these resources through taxation or borrowing. However, the use of these means should be cautious because if this is not the case, as economic theory suggests, the economy may be destabilized.
7)
IV. Central Banks’ Reaction and Policy Implications
In general, the above findings indicate that temperature shocks, which essentially work as negative supply shocks, generate output contraction and inflationary pressures in the countries of Southeast Asia. These findings, which seem to be persistent over several years, can be explained in several ways. Temperature changes, as well as climate changes in general, affect agricultural production negatively by reducing or destroying crops production, thus bringing about food shortages as well as problems in the global distribution of food crops. This impact leads, in turn, to price increases due to excess demand. Of course, these effects can be quite severe when agricultural production comprises a large share of a country’s output, as is the case for most of the thirteen ASEAN+3 countries. Furthermore, when it comes to economies that are food exporters, a temperature shock, and the subsequent reduction in productivity, may reduce the quality of agricultural exports and create inflationary pressures to global food prices (Gassebner et al., 2010; Jones and Olken, 2010). At the same time, temperature changes also affect energy demand, in the sense that hotter or cooler weather conditions potentially increase the demand for energy. This problem is intensified when temperature shocks reduce the productive efficiency of the energy infrastructure. In this case, the energy supply may not be able to satisfy demand and, as a result, prices increase.
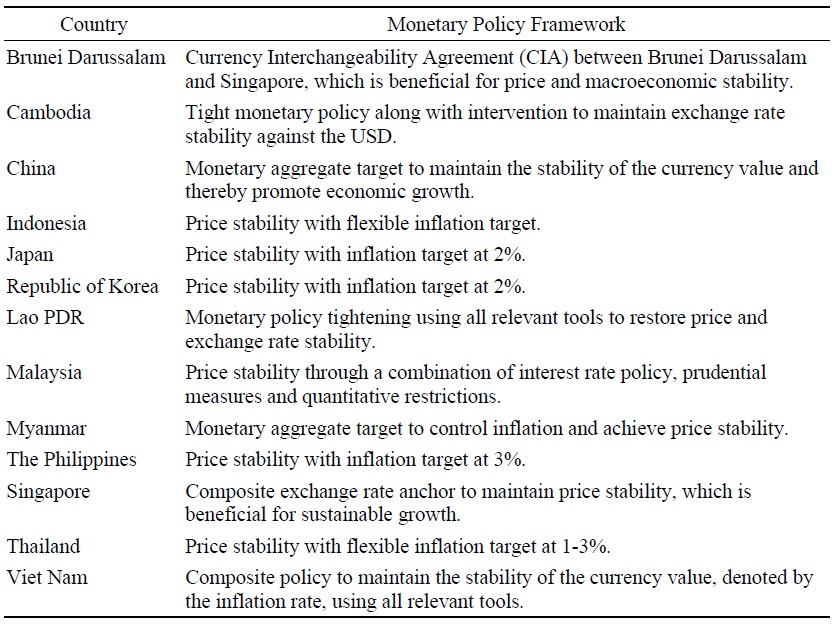
The crucial issue that arises from the above discussion concerns the way that central banks react in an economic environment where both inflationary pressures and output contraction are present. As shown in Table 7, the monetary policy framework adopted by the central banks of most of the ASEAN+3 countries aims, implicitly or explicitly, at price stability as a means to secure macroeconomic stability and, therefore, to promote economic growth. However, it is important to notice that there is an issue of heterogeneity regarding monetary policy frameworks because in some of the countries in the region there is no inflation targeting rule and/or the monetary policy is not independent from government’s decisions. Usually, the notable Taylor rule is being used by central banks to react in cases of high inflation. Moreover, as several empirical studies indicate, the Taylor principle derived from this rule implies that interest rate responses to inflation changes exceed one-to-one (see,
The scenario of output recession and high inflation due to temperature shocks, which has been empirically shown in this study, weakens the ability of central banks to respond appropriately. So far, there is no theoretical rule or principle and only suggestions can be made. For example, a central bank with dual mandate,
However, it is essential for monetary authorities to understand the root cause of inflation so as to respond by adopting suitable tools. If this is not the case, large forecast errors may emerge, leading to the use of unsuitable policy measures bearing irreversible effects. Even though temperature shocks are generally recognized as negative supply shocks, Mukherjee and Ouattara (2021) point out that unlike other supply shocks, which are easily identified, temperature shocks are ‘silent’ and evolve gradually. Furthermore, Breitenfellner et al. (2019) point out that climate variables (
Boneva et al. (2022) review several ways in which central banks could respond to climate change. Maybe, the most important one is the promotion of green financing by ‘encouraging’ commercial banks and other financial institutions to channel funds to investments that accelerate the transition to a low carbon economy. Parallel to this effort, ‘green’ quantitative easing programs have also been suggested. As proposed by Schoenmaker (2021), central banks should purchase assets from low-carbon emitting companies and not from high-carbon emitters. However, a major criticism of such programs is based on the view that central banks may find themselves interfering with industrial policy.
Focusing on the ASEAN+3 countries, their monetary authorities seem to have fully realized that the traditional response to inflationary pressures (
8)A similar path is followed by the Fed, where policy objectives are to promote maximum employment, maintain stable prices and moderate long-term interest rates.
9)The ABMI was established in 2003 by the ASEAN+3 countries as a consequence of the 1997 Asian financial crisis. Initially, this institution aimed at creating regional markets where assets denominated in regional currencies could be floated. In the recent years, it promotes local currency bonds for green projects.
V. Concluding Remarks
The present study explores the effects of temperature shocks, which can be considered as negative supply shocks, on prices, output, as well as on government expenditure and broad money supply, for a sample that consists of the ASEAN+3 countries and covers a period of more than 30 years. The analysis is extended to two subgroups, namely the ten ASEAN countries and the advanced +3 economies. The underlying reason for this sample split is the substantial differences between these two country-groups in terms of economic structure, institutions and climate change exposure. The empirical evidence obtained by the implementation of panel unit root tests and PSVAR analysis suggests that, for each of the three country-groups considered in the analysis, temperature shocks lead to output contraction and, at the same time, cause inflationary pressures. These two effects seem to last for several years after the initial shock. On the other hand, temperature shocks trigger expansionary fiscal policies, which are greater in magnitude and more persistent in the case of the +3 economies. Moreover, for China, Japan and the Republic of Korea, a temperature shock also causes a rather temporary expansionary monetary policy. This study also discusses possible ways in which monetary authorities can deal with inflation when the latter is induced by temperature changes.
These findings, along with the discussion that followed, point out that when the root cause of inflation is temperature shocks, the implementation of the traditional monetary tools could make things worse and lead to irreversible effects. This finding is of high importance because the countries of Southeast Asia belong to a region that is quite vulnerable to the effects of climate change; sea levels are rising and natural hazards are intensifying, deteriorating the quality of life for people that live in densely populated areas and coastal zones and are highly dependent on agriculture. As Sentian et al. (2022) show, there are connections between climate change and the monsoonal seasonal changes observed in surface temperatures and precipitation. Using two alternative climate change scenarios that project future greenhouse gas concentrations in the atmosphere, these authors also indicate that future temperatures are projected to increase, while precipitation is projected to decrease. Therefore, it is essential for the monetary authorities of Southeast Asian countries to focus on the effects of temperature changes and incorporate them into their policy objectives.
Therefore, it is important to understand that the role of central banks and regulatory authorities is crucial in the promotion of a robust green finance ecosystem, especially when market forces follow a different path. Fortunately, the central banks of the ASEAN+3 countries have come to terms with the need to encourage commercial banks to offer lower interest rates for environmentally beneficial investments. In addition, the issuance of green bonds is growing rapidly during the last decade, and this trend is expected to continue in order to moderate the risks brought about by climate change. Along with green bonds, green loans have also been developed as another form of green finance for underpinning the transition to a green economy. However, as pointed out by Chantana et al. (2025), both tools carry potential risks (greenwashing in the case of green bonds, and ‘stranded assets’ in the case of green loans) and should be used with prudence.
Tables & Figures
Table 1.
Descriptive Statistics of the Variables of the Panel
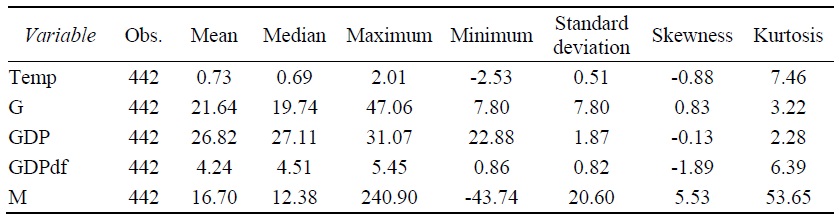
Source: Author’s own calculations.
Table 2.
First-generation Panel Unit Root Tests
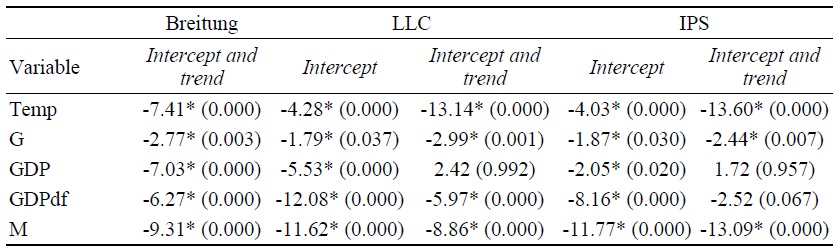
Notes: The null hypothesis for all three tests is the unit root hypothesis, while numbers in parentheses are
Source: Author’s own estimations.
Table 3.
Cross-sectional Dependence Tests

Notes: Numbers in parentheses are
Source: Author’s own estimations.
Table 4.
Panel Unit Root Test in Idiosyncratic and Common Components (PANIC)
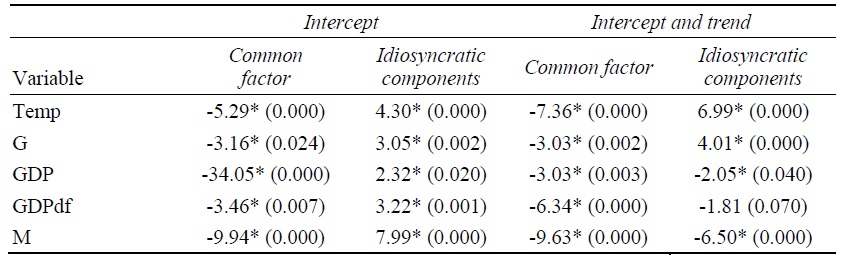
Notes: The null hypothesis is the non-stationarity hypothesis. Numbers in parentheses are
Source: Author’s own estimations.
Table 5.
Panel Unit Root Test with Cross-sectional Dependence (CIPS)
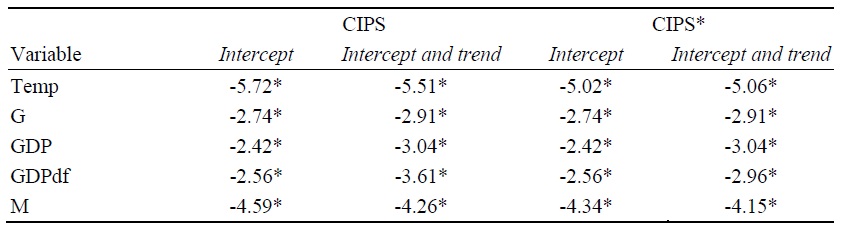
Notes: The null hypothesis is the unit root hypothesis. The 5% critical values for both tests are -2.28 (intercept) and -2.80 (intercept and trend).
Source: Author’s own estimations.
Table 6.
Bootstrap Panel Unit Root Test with Cross-sectional Dependence
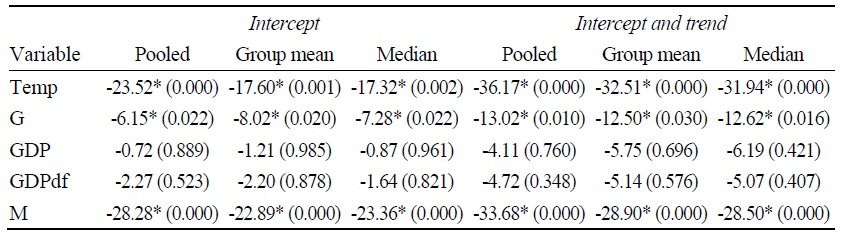
Notes: The null hypothesis is the unit root hypothesis. The test was performed using 10,000 bootstrap replications. Numbers in parentheses are
Source: Author’s own estimations.
Figure 1.
Impulse Responses to Temperature Shocks
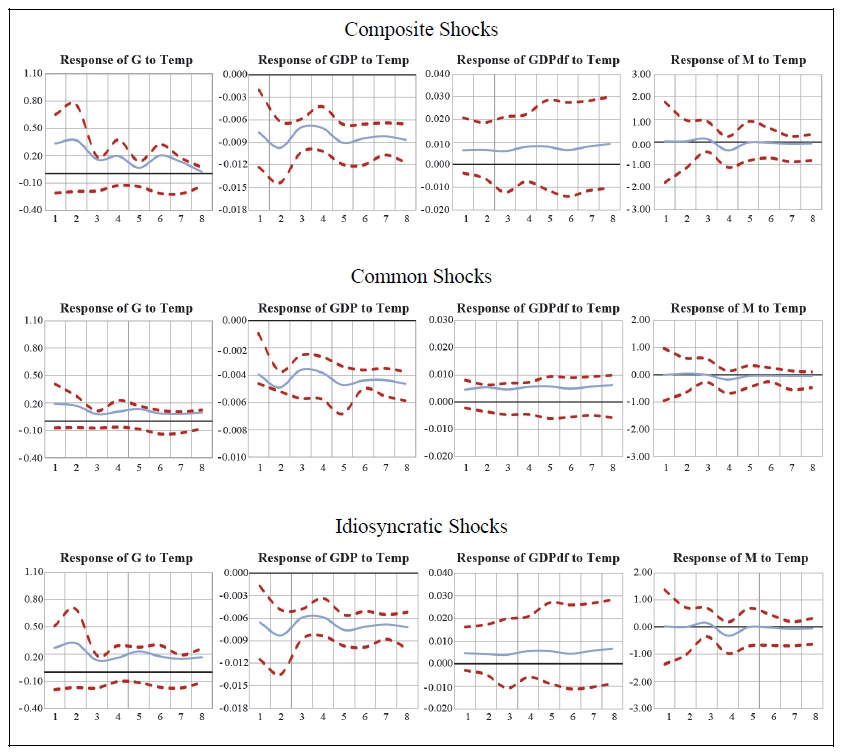
Note: (solid blue lines) with 25% and 75% Confidence Intervals (dotted red lines): ASEAN+3 Countries
Source: Author’s own estimations.
Figure 2.
Impulse Responses to Temperature Shocks

Note: (solid blue lines) with 25% and 75% Confidence Intervals (dotted red lines): ASEAN Countries
Source: Author’s own estimations.
Figure 3.
Impulse Responses to Temperature Shocks
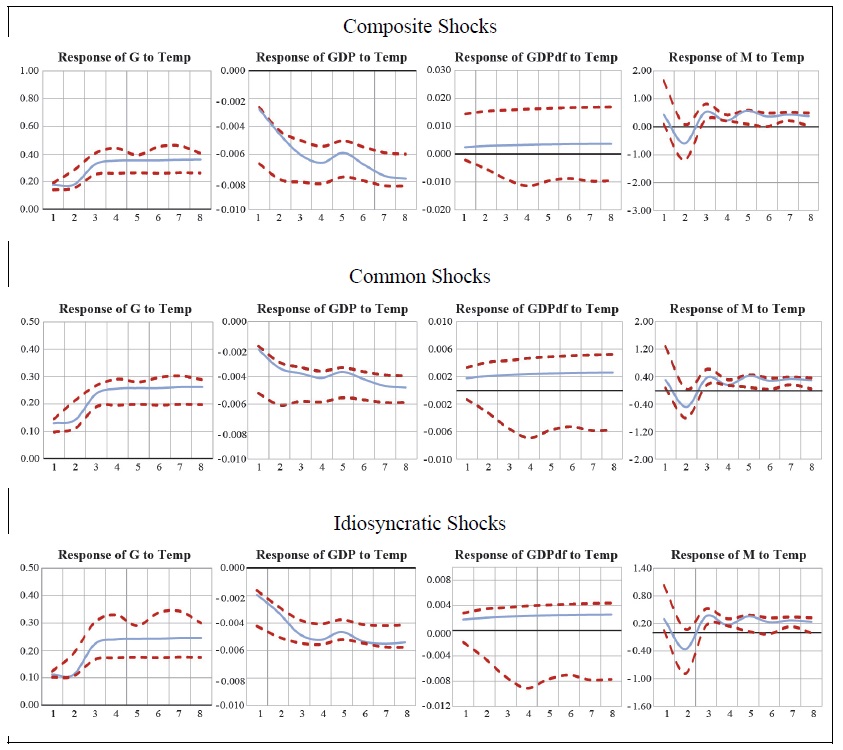
Note: (solid blue lines) with 25% and 75% Confidence Intervals (dotted red lines): +3 Countries
Source: Author’s own estimations.
Table 7.
Monetary Policy Framework in the ASEAN+3 Countries
Sources:
References
-
Bai, J. and S. Ng. 2004. “A PANIC attack on unit roots and cointegration.”
Econometrica , vol. 72, no. 4, pp. 1127-1177.https://doi.org/10.1111/j.1468-0262.2004.00528.x 
-
Baltagi, B. H., Feng, Q. and C. Kao. 2012. “A Lagrange multiplier test for cross-sectional dependence in a fixed effects panel data model.”
Journal of Econometrics , vol. 170, no. 1, pp. 164-177.https://doi.org/10.1016/j.jeconom.2012.04.004
-
Bansal, R. and M. Ochoa. 2011. “Temperature, aggregate risk, and expected returns.” NBER Working Papers, no. 17575. National Bureau of Economic Research.
https://doi.org/10.3386/w17575 -
Blanchard, O. J. and D. Quah. 1989. “The dynamic effects of aggregate demand and supply disturbances.”
American Economic Review , vol. 79, no. 4, pp. 655-673.https://www.jstor.org/stable/1827924 -
Boneva, L., Ferrucci, G. and F. P. Mongelli. 2022. “Climate change and central banks: What role for monetary policy?”
Climate Policy , vol. 22, no. 6, pp. 770-787.https://doi.org/10.1080/14693062.2022.2070119
-
Breitenfellner, A., Pointner, W. and H. Schuberth. 2019. “The potential contribution of central banks to green finance.”
Vierteljahrshefte zur Wirtschaftsforschung , vol. 88, no. 2, pp. 55-71.https://doi.org/10.3790/vjh.88.2.55
-
Breitung, J. 2001. “The local power of some unit root tests for panel data.” In Baltagi, B. H., Fomby, T. B. and R. C. Hill. (eds.)
Nonstationary Panels, Panel Cointegration, and Dynamic Panels- Advances in Econometrics, vol. 15 . Emerald Group Publishing Limited. pp. 161-177.https://doi.org/10.1016/S0731-9053(00)15006-6 -
Breusch, T. S. and A. R. Pagan. 1980. “The Lagrange multiplier test and its application to model specification in econometrics.”
Review of Economic Studies , vol. 47, no. 1, pp. 239-253.https://doi.org/10.2307/2297111
-
Bullard, J. and K. Mitra. 2002. “Learning about monetary policy rules”.
Journal of Monetary Economics , vol. 49, no. 6, pp. 1105-1129.https://doi.org/10.1016/S0304-3932(02)00144-7
-
Castle, J. L. and D. F. Hendry. 2020. “Climate econometrics: An overview.”
Foundations and Trends in Econometrics , vol. 10, no. 3-4, pp. 145-322.https://doi.org/10.1561/0800000037
-
Chantana, B., Fu, C., Lim, I. and K. C. Cheng. 2025. “Green finance: balancing sustainability and financial stability.” AMRO Analytical Note, February 21. ASEAN+3 Macroeconomic Research Office.
https://amro-asia.org/wp-content/uploads/2025/02/Analytical-Note_GreenFinanceBalancingSustainabilityFinancialStability.pdf -
Christiano, L. J., Eichenbaum, M. and C. L. Evans. 2005. “Nominal rigidities and the dynamic effects of a shock to monetary policy.”
Journal of Political Economy , vol. 113, no. 1, pp. 1-45.https://doi.org/10.1086/426038
-
Ciccarelli, M. and F. Marotta. 2024. “Demand or supply? An empirical exploration of the effects of climate change on the macroeconomy.”
Energy Economics , vol. 129.https://doi.org/10.1016/j.eneco.2023.107163
-
Dell, M., Jones, B. F. and B. A. Olken. 2009. “Temperature and income: Reconciling new cross-sectional and panel estimates.”
American Economic Review , vol. 99, no. 2, pp. 198-204.https://doi.org/10.1257/aer.99.2.198
-
Dell, M., Jones, B. F. and B. A. Olken. 2012. “Temperature shocks and economic growth: Evidence from the last half century.”
American Economic Journal: Macroeconomics , vol. 4, no. 3, pp. 66-95.https://doi.org/10.1257/mac.4.3.66
-
Deschenes, O. 2014. “Temperature, human health, and adaptation: A review of the empirical literatures.”
Energy Economics , vol. 46, no. C, pp. 606-619.https://doi.org/10.1016/j.eneco.2013.10.013
-
Gassebner, M., Keck, A. and R. Teh. 2010. “Shaken, not stirred: The Impact of disasters on international trade.”
Review of International Economics , vol. 18, no. 2, pp. 351-368.https://doi.org/10.1111/j.1467-9396.2010.00868.x
-
Heinen, A., Khandan, J. and E. Strobl. 2019. “The price impact of extreme weather in developing countries.”
Economic Journal , vol. 129, no. 619, pp. 1327-1342.https://www.jstor.org/stable/45117439
-
Hsiang, S. M. and A. S. Jina. 2014. “The causal effect of environmental catastrophe on longrun economic growth: evidence from 6,700 cyclones.” NBER Working Papers, no. 20352. National Bureau of Economic Research.
https://doi.org/10.3386/w20352 -
Im, K. S., Pesaran, M. H. and Y. Shin. 2003. “Testing for unit roots in heterogeneous panels.”
Journal of Econometrics , vol. 115, no. 1, pp. 53-74.https://doi.org/10.1016/S0304-4076(03)00092-7
-
Intergovernmental Panel on Climate Change (IPCC). 2018. “Summary for Policymakers.” In Masson-Delmotte et al. (eds.)
Global Warming of 1.5℃ . Cambridge University Press.https://www.ipcc.ch/sr15/chapter/spm/ -
International Monetary Fund (IMF). 2024.
Annual Report on Exchange Arrangements and Exchange Restrictions 2023 . USA: International Monetary Fund. -
Jones, B. F. and B. A. Olken. 2010. “Climate shocks and exports.”
American Economic Review , vol. 100, no. 2, pp. 454-459.https://doi.org/10.1257/aer.100.2.454
-
Kahn, M. E., Mohaddes, K., Ng, R. N. C., Pesaran, M. H., Raissi, M. and J.-C. Yang. 2019. “Long-term macroeconomic effects of climate change: A cross-country analysis.” NBER Working Papers, no. 26167. National Bureau of Economic Research.
https://doi.org/10.3386/w26167 -
Levin, A., Lin, C. F. and C. S. J. Chu. 2002. “Unit root tests in panel data: asymptotic and finitesample properties.”
Journal of Econometrics , vol. 108, no. 1, pp. 1-24.https://doi.org/10.1016/S0304-4076(01)00098-7
-
Mallick, S. K. and R. M. Sousa. 2013. “Commodity prices, inflationary pressures, and monetary policy: evidence from BRICS economies.”
Open Economies Review , vol. 24, no. 4, pp. 677-694.https://doi.org/10.1007/s11079-012-9261-5
-
Mukherjee, K. and B. Ouattara. 2021. “Climate and monetary policy: do temperature shocks lead to inflationary pressures?”
Climatic Change , vol. 167.https://doi.org/10.1007/s10584-021-03149-2
-
Palm, F. C., Smeekes, S. and J.-P. Urbain. 2011. “Cross-sectional dependence robust block bootstrap panel unit root tests.”
Journal of Econometrics , vol. 163, no. 1, pp. 85-104.https://doi.org/10.1016/j.jeconom.2010.11.010
-
Parker, M. 2018. “The impact of disasters on inflation.”
Economics of Disasters and Climate Change , vol. 2, no. 1, pp. 21-48.https://doi.org/10.1007/s41885-017-0017-y
-
Pedroni, P. 2013. “Structural panel VARs.”
Econometrics , vol. 1, no. 2, pp. 180-206.https://doi.org/10.3390/econometrics1020180
-
Pesaran, M. H. 2004. “General diagnostic tests for cross section dependence in panels.” CWPE, no. 435, University of Cambridge.
https://doi.org/10.17863/CAM.5113 -
Pesaran, M. H. 2007. “A simple panel unit root test in the presence of cross-section dependence.”
Journal of Applied Econometrics , vol. 22, no. 2, pp. 265-312.https://doi.org/10.1002/jae.951
-
Petris, F. 2021. “Exogeneity in climate econometrics.”
Energy Economics , vol. 96.https://doi.org/10.1016/j.eneco.2021.105122 -
Pindyck, R. S. 2013. “Climate change policy: What do the models tell us?”
Journal of Economic Literature , vol. 51, no. 3, pp. 860-872.https://doi.org/10.1257/jel.51.3.860
-
Pugatch, T. 2019. “Tropical storm and mortality under climate change.”
World Development , vol. 117, pp. 172-182.https://doi.org/10.1016/j.worlddev.2019.01.009
-
Schoenmaker, D. 2021. “Greening monetary policy.”
Climate Policy , vol. 21, no. 4, pp. 581-592.https://doi.org/10.1080/14693062.2020.1868392
-
Sentian, J., Payus, C. M., Herman, F. and V. W. Y. Kong. 2022. “Climate change scenarios over Southeast Asia.”
APN Science Bulletin , vol. 12, no. 1.https://doi.org/10.30852/sb.2022.1927
-
Stern, N. 2016. “Economics: current climate models are grossly misleading.”
Nature , vol. 530, pp. 407-409.https://doi.org/10.1038/530407a
-
Woodward, M. 2001. “The Taylor rule and optimal monetary policy.”
American Economic Review , vol. 91, no. 2, pp. 232-237.https://doi.org/10.1257/aer.91.2.232