

- EAER>
- Journal Archive>
- Contents>
- articleView
Contents
Citation
| No | Title |
|---|---|
| 1 | Information transmission between oil and housing markets / 2021 / Energy Economics / vol.95, pp.105100 / |
| 2 | An Investigation on Real Estate Market Dynamics and Bubble Formation Modeling / 2023 / Proceedings of the International Conference on Business Excellence / vol.17, no.1, pp.1603 / |
Article View
East Asian Economic Review Vol. 24, No. 2, 2020. pp. 185-203.
DOI https://dx.doi.org/10.11644/KIEP.EAER.2020.24.2.376
Number of citation : 2View
57
Download
50
Connectedness among Northeast Asian Housing Markets and Business Cycles
|
|
Sogang University |
|---|---|
|
|
Sogang University |

Abstract
This paper investigates the connectedness among housing markets using the methodology developed in
JEL Classification: C32, E01, R11
Keywords
Housing Market, Business Cycle, Northeast Asian Region, Connectedness, International Linkage
I. INTRODUCTION
Housing is an important sector of the national economy in most countries. Fluctuations in real estate market have a direct impact on the level of economic activities, while housing prices are affected by economic conditions. In fact, the global financial crisis (henceforth GFC) in 2007-2009 was triggered by the US subprime mortgage crisis, which led to an unprecedented downturn in global housing and financial markets. As discussed in Kim and Renaud (2009) and Gupta et al. (2015), the information transmission mechanism of housing markets is also related to the synchronicity of monetary policies, integration of global financial markets, and convergence in international business cycles.
The importance of housing in business-cycle analysis is much emphasized by Leamer (2007), in his article, entitled “Housing is the business cycle.” Despite its importance in economic fluctuations, the housing sector has received little attention. In fact, a particular interest in the connectedness among international housing markets has sprouted after the GFC, as the connectedness of housing markets was particularly evident during the GFC.
As regional markets have become more correlated and connected than before, we can obtain useful information on housing market dynamics for investors and/or policy makers by analyzing the nature of connectedness in housing market. In fact, several studies have examined whether and to what extent regional housing markets move together with other regions. Examples of literature on the ripple effect in housing markets include Holmans (1990), MacDonald and Taylor (1993), Oikarinen (2006), Chien (2010), Chiang (2014), Lee and Lee (2019), and Antonakakis et al. (2018).
In line with the connectedness among housing markets, the international housing market comovement has also received much attention in more recent literature. Considerable literature presented evidence that the linkage of international housing markets has increased since the GFC. Examples of literature on the international housing market include Goodhart and Hofmann (2008), Vansteenkiste and Hiebert (2011), Liow and Newell (2012), Liow (2012, 2013, 2014), Cesa-Bianchi (2013), Hirata et al. (2013), Yoon and Lee (2014), Kim and Park (2016), and Lee and Lee (2018).
Goodhart and Hofmann (2008) investigated the linkages among house prices, monetary variables, and the economic activities in 17 industrialized countries. Vansteenkiste and Hiebert (2011) examined the spillover effects among housing markets in the Euro zone. Liow and Newell (2012) discussed cross-market relationships among the Greater China area (China, Hong Kong, Taiwan) using securitized real estate markets. Liow (2012) investigated co-movements and correlation across Asian securitized real estate and stock markets, and Liow (2013) examined volatility interdependence in the Euro zone real estate market. Cesa-Bianchi (2013) analyzed the impact of US housing prices on major advanced and emerging countries. Yoon and Lee (2014) discussed the movement of house prices and GDP in the G7 countries. Liow (2014) examined the volatility spillovers within the Greater China public real estate markets and international linkages across the GC regions and other emerging/developed markets. Kim and Park (2016) investigated the characteristics of housing price cycles and synchronization levels in six East Asian countries. Lee and Lee (2018) discussed the connectedness among G7 housing markets.
In fact, the location fixity and non-tradable nature of housing asset suggest that international linkages of housing markets be quite low. However, earlier studies presented evidence for comovements of house prices across countries. In this paper, we investigate the connectedness among housing markets in the Northeast Asian countries. Given the observation that the similarity in house price patterns across countries might be due to common international factors such as the GFC, we also examine the linkages between housing markets and business cycle fluctuations in this region.
While Liow and Newell (2012), Liow (2012, 2014) discussed the volatility connectedness in Asian real estate markets, they used the securitised indices which are not direct measures of the returns in real estate market (Mühlhofer, 2013). In particular, given that the US subprime crisis occurred in the residential housing market, while the basic assets of the securitised index are commercial real estate, the indices are not representative enough of the entire housing market. Hence, we need to use the real housing price indices in order to circumvent such limitations.
The remainder of this paper is organized as follows. Section 2 provides a brief overview on the methodology employed in this study. Section 3 describes the data and presents the empirical results. A brief summary and concluding remarks are presented in Section 4.
II. EMPIRICAL METHODOLOGY
In order to examine housing market interdependence, we employ the connectedness measurement framework of Diebold and Yilmaz (2014, 2016). In fact, there are several alternative econometric frameworks for measuring spillover effects. For instance, Engle and Kelly (2012) developed the dynamic equi-correlation model, and Billio et al. (2012) introduced the Granger causality network approach. Adrian and Brunnermeir (2016) proposed the conditional value at risk (CoVar) framework, and Acharya et al. (2017) introduced the marginal expected shortfall (MES) approach. However, the Diebold-Yilmaz connectedness approach is a unified framework for measuring connectedness at various levels, from pairwise to system-wide, whereas other techniques focus on only one aspect of connectedness.
The connectedness methodology is based upon generalized forecast error variance decomposition in Pesaran and Shin (1998), which is insensitive to the variable ordering by allowing correlated shocks and using the historically observed distribution of the errors. First, consider a covariance stationary VAR process of dimension m written as:

Where

where the coefficient matrices A
As discussed in Sims (1980), precise orthogonalization of VAR shocks is often required for analyzing impulse response function and calculating variance decompositions. Cholesky factor may achieve orthogonality, but such an approach depends largely on the ordering of the variables. Hence whenever no reasoning or theory is available for the ordering of the variables, the Cholesky decomposition is unattractive to empirical researchers.
In this paper, we use the generalized approach developed in Koop et al. (1996) and Pesaran and Shin (1998), which allows for correlated shocks but accounts for them appropriately. Variable
where
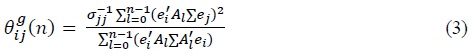
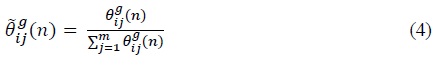
As the row sums of the variance decomposition matrix are not necessarily unity,  we normalize each entry by the row sum so that
  in the following equation.
The connectedness approach developed in Diebold and Yilmaz (2014, 2016) is very useful in characterizing the connectedness among the variables under analysis via the variance decomposition. The variance decomposition denotes the fraction of the
1. Total Connectedness
Total connectedness, or system-wide connectedness, is the ratio of the sum of the off-diagonal elements of the variance decomposition matrix to the sum of all its elements.
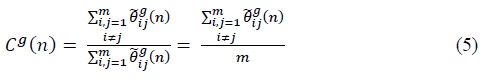
The total connectedness estimates the degree of spillovers among markets as a single index. Hence, this measure is useful in understanding how much each markets are linked to the whole market.
2. Directional Connectedness
We can aggregate partially to arrive at total directional connectedness. There are two versions, ‘from’ and ‘to’. The directional connectedness received from others can be defined as:
Similarly, the directional connectedness to others can be calculated as:
Note that there are 2
3. Net Directional Connectedness
Net directional connectedness can be derived as the difference between the connectedness ‘to’ others and those ‘from’ others.

As opposed to the directional connectedness measures, the net directional connectedness estimates the net total effects. The figures with a positive (or negative) sign show that
4. Net Pairwise Directional Connectedness
Sometimes we are also interested in net pairwise directional connectedness defined as:

Similar to the net directional connectedness, the measures with a positive (or negative) sign indicate whether
1)See
III. EMPIRICAL RESULTS
1. Data Description
We use quarterly data on housing price indices for three Northeast Asian countries (China, Japan, and Korea), over the period 1992-2017. Return series are calculated as the difference in the natural logarithm of two consecutive housing price indices. In order to examine international linkage of business cycle in this area, we also include GDP in estimating connectedness measures.2
Table 1 presents the descriptive statistic of both housing prices and GDP series. The return for Chinese housing prices shows the largest positive value in average, whereas Japan shows a negative return. In fact, Chinese housing prices have increased at more than 6% per year on average during the sample period. Similar observations are displayed on GDP growth rates in that China recorded the highest growth rates among the three countries, whereas Japan showed the lowest growth. These results might indicate that housing prices in these countries are much affected by country-specific economic factors.
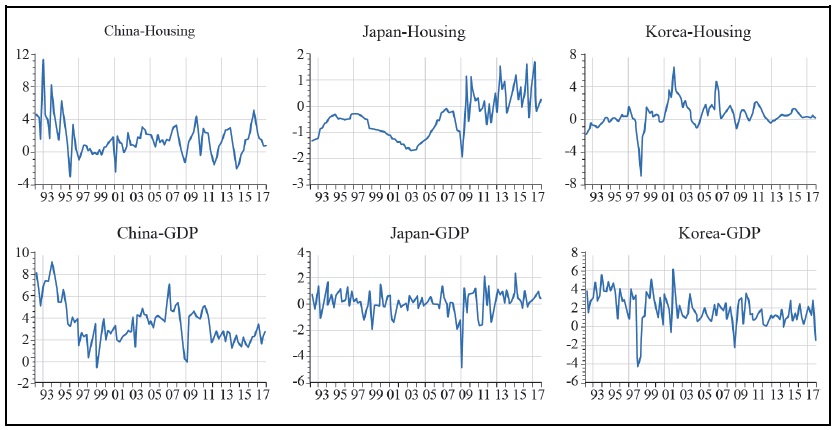
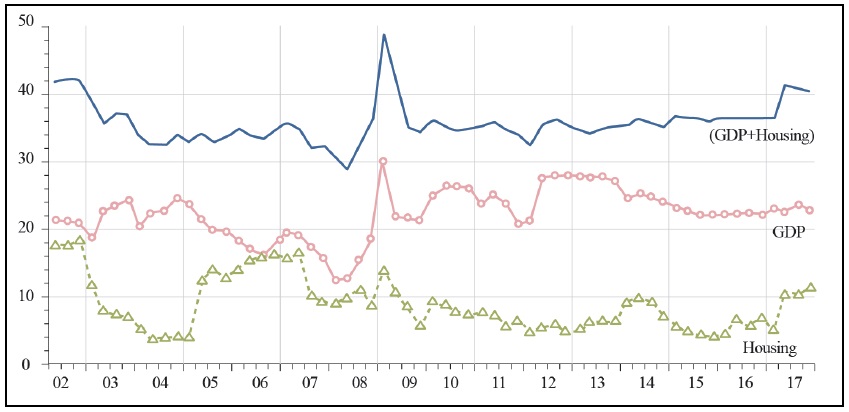
Figure 1 displays the housing prices and GDP series of the three countries. We can observe different patterns in housing prices and business cycles across different countries.3 Figures 2 displays the housing market returns and GDP growth rates. We can first notice that the Korean housing market experienced a big change after the Korean foreign exchange crisis in 1998. Most countries show high volatilities during the global financial crisis.
2. Connectedness among Northeast Asian Housing Markets
In this section, we consider connectedness measures for the three housing markets, using full-sample analysis. First, we estimate connectedness measures among housing markets. We then examine various features of international linkage, based upon the idea of Diebold and Yilmaz (2016).
We use the VAR model of order 1, selected by the Schwarz information criterion, and a forecast horizon of 4 quarters is used to calculate variance decompositions. Table 2 presents the estimation results on the connectedness measures for the three housing market returns under analysis. The connectedness table provides an approximate ‘input-output’ decomposition of the total connectedness index and enables us to observe the connectedness among international housing markets. Its main upper-left
Similarly to pairwise directional connectedness, we are sometimes interested in net directional connectedness, which can be derived as the difference between the sum of the ‘to others’ and ‘from others’ directional connectedness measures. The grand total of the off-diagonal entries in the matrix measures a system-wide connectedness. The total connectedness is defined as the sum of ‘from’ column (or ‘to’ row) in proportion to the sum of all its elements.
The total connectedness among these housing markets over the entire period is 1.14%, indicating that 98.86% of the variation is due to country-specific shocks. In particular, Korea shows the largest own-connectedness (diagonal element) with 99.0%. In terms of pairwise directional connectedness, the largest measure is 1.18% for Korea, and the connectedness between Korea and China appears to be high with net pairwise directional connectedness around 0.62% (= 1.18% - 0.56%). As for the net total directional connectedness (‘to others’ - ‘from others’), Korea has the highest net connectedness, 0.68%, followed by China at 0.05%, indicating that these countries are net transmitters of housing market shocks. In contrast, China has a negative net connectedness at -0.72%.
Given the non-tradable and hence unsubstitutable nature of housing goods, such low linkages among these countries are somewhat expected. However, earlier studies have often presented evidence for international comovement of house prices. For instance, Cesa-Bianchi (2013) argued that house priced returns can be highly correlated across countries due to synchronized housing demand shocks originated from global economic turmoils such as the GFC (global financial crisis) in 2008. Lee and Lee (2018) also found a relatively high degree of linkage among the G7 housing market with an estimated connectedness of 10.2%.4
In fact, the international linkages of house prices can be explained by common economic factors such as global (or regional) GDP and interest rates. From a theoretical point of view, a higher level of economic integration would lead to an increased comovement of housing prices across countries. In particular, the synchronicity of monetary policies, financial deregulation, and integration of financial markets will influence the evolution of more synchronized house prices, as discussed in Kim and Renaud (2009) and Gupta et al. (2015).
For instance, Tsai (2018) suggested that house prices in euro zone countries with a single currency are more correlated than those in non-euro zone countries. Given the results of Diebold and Yilmaz (2015) that the connectedness among advanced financial markets is high, we can expect that the international linkages among housing markets in the G7 countries are also relatively high, as discussed in Lee and Lee (2018). On the other hand, the low degree of connectedness among the Northeast Asian financial markets, as discussed in Lee and Lee (2020), seems to suggest that the housing market linkage among these countries are quite low.
Given the earlier studies on the linkage between macroeconomic fluctuations and international house prices, we next include GDP in estimating connectedness measures to investigate international comovement of business cycles in this area. This set-up is useful in assessing the international linkages between the macroeconomy and the housing markets.5
Sample correlations of GDP and housing returns are presented in Table 3. Strongest correlations are observed for among GDP growth rates, whereas housing returns show low correlations. A high correlation between Chinese GDP growth rate and housing return series is also noticeable.
Table 4 presents the 6 × 6 connectedness table. We can notice that the connectedness measures in Table 4 differ from those in Table 3 in several respects, althoguh they also show many similarities in some other respects. The total connectedness measure is 23.73%, indicating that linkage among the three countries is relatively high compared to the previous case when housing markets are only considered. However, large connectedness measures are mainly due to high correlations between GDP and housing prices of each country. In particular, the largest pairwise directional connectedness between GDP and housing price is 21.17% for China, which is somewhat expected from the highest sample correlations in Table 3.
We can also notice that international linkage of business cycles among these countries is high, whereas connectedness of housing markets in this area is quite low.6 In particular, the connectedness between China and Korea appears to be high with pairwise directional connectedness measures at 9.58% and 7.74%. As for the net total directional connectedness (‘to others’ – ‘from others’), Chinese GDP has the highest net connectedness, 5.08%, indicating that the Chinese economic condition is a net transmitter of shocks in this area.
3. Dynamic Analysis
Although the result on the full-sample connectedness provides a good characterization of “average” aspect of connectedness across international housing markets, they are not useful in examining connectedness dynamics. Clearly, both the economic fundamentals and the housing markets in most countries have experienced big changes since the GFC. In this subsection, we provide a dynamic analysis by using rolling sample analysis technique.
Figure 3 plots the total connectedness from 10-year rolling sample estimation. As expected, the connectedness index shows a time-varying pattern over the sample period. In early 2000s, most countries shared a boom in housing prices, mainly due to high economic growth and low interest rates, except for Japan. The connectedness among housing markets showed an upward trend during this period. The estimated total connectedness measures showed a sharp rise (from 30% to 45%) around the global financial crisis in 2008. The total connectedness indices have been slowly increasing due to growing influence of the Chinese economy. However, the connectedness across the three Asian housing markets has been quite low.
4. Within-country and Cross-country Connectedness Measures
In this subsection, we decompose the total connectedness index into within-country and cross-country connectedness. The within-country connectedness estimates the sum of pairwise connectedness measures between GDP growth rates and housing returns for the three countries. The cross-country connectedness indicates the sum of all pairwise connectedness of either business cycles or housing returns across countries. Such a decomposition of total connectedness is useful in analyzing on transmission mechanism of shocks in these countries.
Figure 4 presents the connectedness measures calculated in this way. We can notice that within-country connectedness has gradually risen around the global financial crisis, and has since stabilized. The estimated connectedness measures confirm the observation that a large part of connectedness measures estimated above are mainly due to high spillover effects between GDP growth rates and housing returns of each country. Similar evidence is presented in Yoon and Lee (2014) that the house price shows procyclical movement with the GDP. Such a phenomenon was particularly evident around the GFC period. This observation is also consistent with the theoretical findings that house price and business cycle are tightly linked. We can also note that international linkage of business cycle in this area is relatively high, whereas connectedness of housing markets among these countries is quite low.
2)The housing price indices for China were obtained from Datastream, and those for Japan and Korea were from BIS, respectively. The GDP data were obtained from Statistics China, Japan Macro Advisors, Bank of Korea, respectively.
3)See
4)In contrast,
5)Earlier papers on the international linkage among business cycles and housing markets suggested various channels for the macroeconomy-housing relationship. First, according to the life-cycle model of household consumption, a permanent rise in housing wealth leads to an increase in household spending and borrowing when households attempt to smooth consumption over the life cycle
6)In order to make a fair comparison, we also examine business-cycle connectedness among these countries by excluding housing prices in the model. In this case, the total connectedness measure for GDP growth rates is 14.95%, which is presented in
IV. CONCLUSIONS
This study attempts to analyze the connectedness among Northeast Asian housing markets. We use the connectedness indices obtained from the generalized variance decomposition, which are useful in estimating the total connectedness index, the net directional connectedness, and the rolling connectedness among the international housing markets.
We find that the international linkage among the three Northeast Asian countries is quite weak. The estimated total connectedness measures vary over the business cycles, with a surge around the global financial crisis. This result suggests that housing market connectedness is more of domestic cross-regional phenomena, rather than international ones, given earlier evidence that cross-regional spillovers within one country are high.
While some interesting observations are presented in this paper, much work still remains to be done. First, the analysis in this study is limited to the Northeast Asian housing markets, and hence we need to consider other financial markets as discussed in Lee and Lee (2020). In particular, we need to track the movement of investors or funds across the three countries by investigating the various financial markets (stocks, money, bonds and foreign exchange markets), so that we have a deeper understanding on these markets. We can also explore the connectedness of both domestic and international housing markets, by applying the LASSO-VAR model, which can overcome the dimensionality problem (Demirer et al., 2018).
Tables & Figures
Table 1.
Descriptive Statistics for Housing Returns and GDP Growth Rates
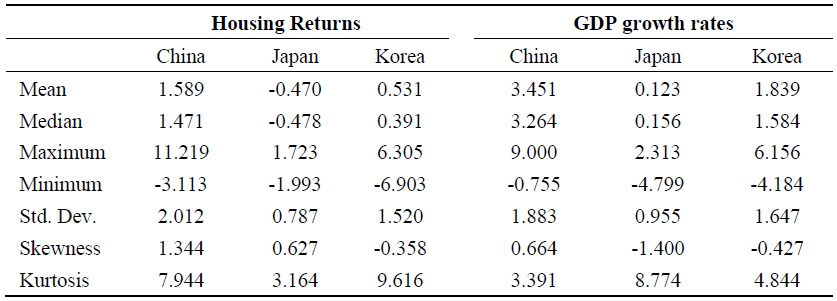
Note: This table presents the descriptive statistics for housing returns and GDP growth rates. The sample period ranges from 1992.Q1 to 2017.Q4.
Figure 1.
Housing Prices and GDP Series
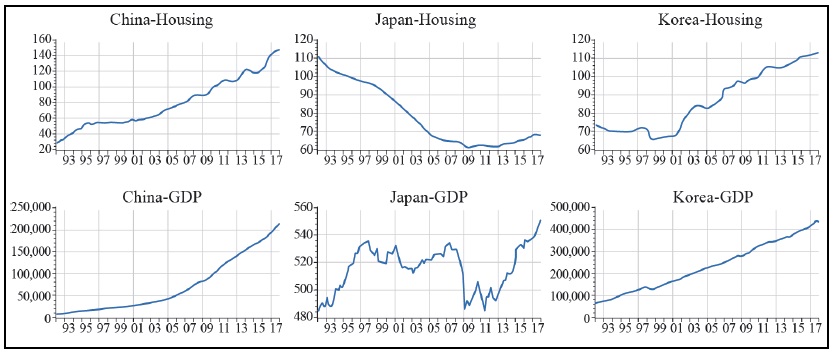
Note: This figure plots the time variations of housing prices and GDP series from 1992 to 2017.
Figure 2.
Housing Price Returns and GDP Growth Rates
Note: This figure displays the time variations of house price returns and GDP growth rates from 1992 to 2017.
Table 2.
Connectedness table for housing markets
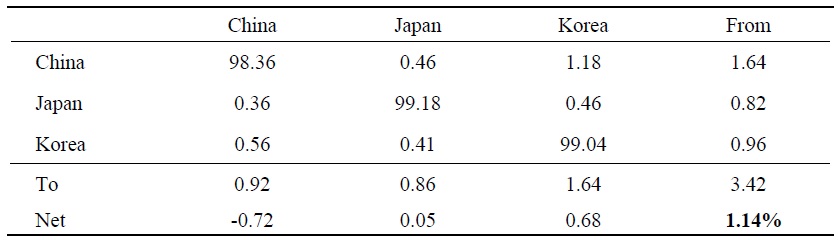
Note: This table presents the connectedness table for the Northeast Asian housing markets. The sample period ranges from 1992 to 2017. The underlying variance decomposition is based on a quarterly VAR (1) and 4-step forecast horizon.
Table 3.
Sample Correlations among GDP Growth Rates and Housing Returns
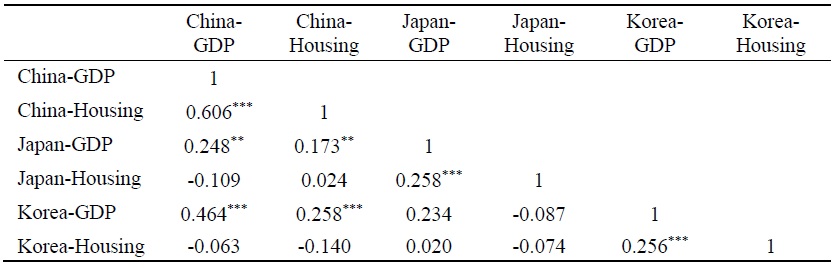
Note: This table presents the sample correlations among GDP growth rates and housing returns of the three countries. The asterisks ***, **, and * imply significance at 1%, 5%, and 10% levels, respectively.
Table 4.
Connectedness Table for Business Cycles and Housing Markets
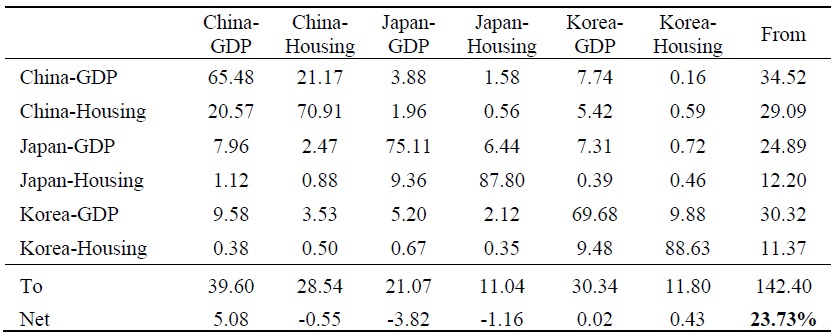
Note: This table presents the connectedness table for business cycles and housing markets of the three countries. The sample period ranges from 1992 to 2017. The underlying variance decomposition is based on a quarterly VAR (1) and 4-step forecast horizon.
Figure 3.
Total Connectedness Measures
Note: This figure shows the total connectedness measures of the Northeast Asian region from 10-year rolling-sample estimations.
Figure 4.
Within-Country and Cross-Country Connectedness Measures
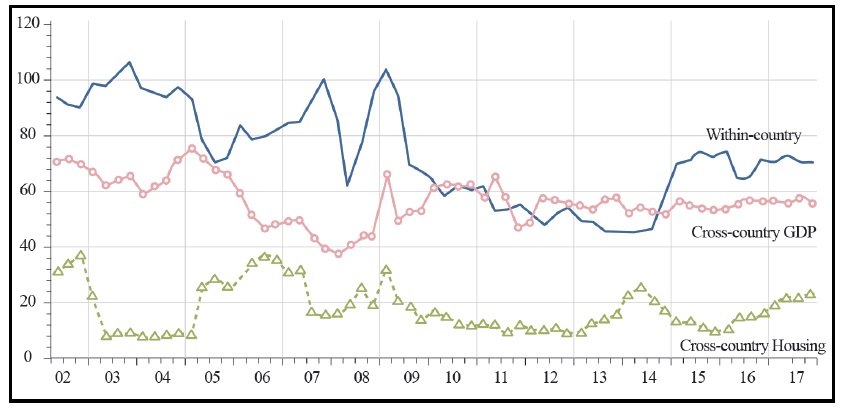
Note: This figure displays the within-country and cross-country connectedness measures of the Northeast Asian region from 10-year rolling-sample estimations.
APPENDIX. CONNECTEDNESS FOR BUSINESS CYCLES
In order to make a fair comparison, we also examine business-cycle connectedness, among these countries. In this case, the total connectedness measure is 14.95% for GDP growth rates, which is presented in Table A.1.
Appendix Tables & Figures
Table A.1.
Connectedness Table for GDP Growth Rates
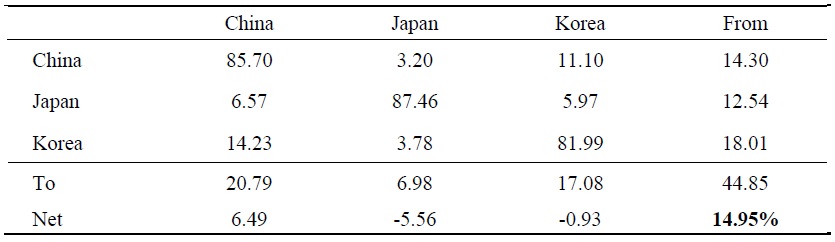
Note: This table presents the connectedness table for GDP growth rates of the Northeast Asian countries. The sample period ranges from 1992 to 2017. The underlying variance decomposition is based on a quarterly VAR (1) and 4-step forecast horizon.
References
-
Acharya, V., Pedersen, L., Philippe, T. and M. Richardson. 2017. “Measuring Systemic Risk,”
Review of Financial Studies , vol. 30, no. 1, pp. 2-47.
-
Adams, Z. and R. Fuss. 2010. “Macroeconomic Determinants of International Housing Markets,”
Journal of Housing Economics , vol. 19, no. 1, pp. 38-50. -
Adrian, T. and M. K. Brunnermeier. 2016. “CoVaR,”
American Economic Review , vol. 106, no. 7, pp. 1705-1741.
-
Antonakakis, N., Chatziantoniou, I., Floros, C. and D. Gabauer. 2018. “Dynamic Connectedness of UK Regional Property Returns,”
Urban Studies , vol. 55, no.14, pp. 3110-3134.
-
Beltratti, A. and C. Morana. 2010. “International House Prices and Macroeconomic Fluctuations,”
Journal of Banking and Finance , vol. 34, no. 3, pp. 533-545.
-
Billio, M., Getmansky, M., Lo, A. D. and L. Pelizzon. 2012. “Econometric Measures of Connectedness and Systemic Risk in the Finance and Insurance Sectors,”
Journal of Financial Economics , vol. 104, no. 3, pp. 535-559.
-
Cesa-Bianchi, A. 2013. “Housing Cycles and Macroeconomic Fluctuations: A Global Perspective,”
Journal of International Money and Finance , vol. 37, pp. 215-238.
-
Chiang, S. 2014. “Housing Markets in China and Policy Implications: Comovement or Ripple Effect,”
China & World Economy , vol. 22, no.6, pp. 103-120.
-
Chien, M.-S. 2010. “Structural Breaks and the Convergence of Regional House Prices,”
Journal of Real Estate Finance and Economics , vol. 40, no.1, pp. 77-88.
-
Demirer, M., Diebold, F. X., Liu, L. and K. Yilmaz. 2018. “Estimating Global Bank Network Connectedness,”
Journal of Applied Econometrics , vol. 33, no. 1, pp. 1-15. -
Diebold, F. X. and K. Yilmaz. 2012. “Better to Give than to Receive: Predictive Directional Measurement of Volatility Spillovers,”
International Journal of Forecasting , vol. 28, no.1, pp. 57-66.
-
Diebold, F. X. and K. Yilmaz. 2014. “On the Network Topology of Variance Decompositions: Measuring the Connectedness of Financial Firms,”
Journal of Econometrics , vol. 182, no. 1, pp. 119-134.
-
Diebold, F. X. and K. Yilmaz. 2015.
Financial and Macroeconomic Connectedness: A Network Approach to Measurement and Monitoring . New York: Oxford University Press. -
Diebold, F. X. and K. Yilmaz. 2016. “Trans-Atlantic Volatility Connectedness among Financial Institutions: 2004-2014,”
Journal of Financial Econometrics , vol. 14, no. 1, pp. 81-127. -
Engle, R. F. and B. T. Kelly. 2012. “Dynamic Equicorrelation,”
Journal of Business and Economic Statistics , vol. 30, no. 2, pp. 212-228.
-
Englund, P. and Y. M. Ioannides. 1997. “House Price Dynamics: An International Empirical Perspective,”
Journal of Housing Economics , vol. 6, no. 2, pp. 119-136.
-
Glindro, E. T., Subhanij, T., Szeto, J. and H. Zhu. 2011. “Determinants of House Prices in Nine Asia-Pacific Economies,”
International Journal of Central Banking , vol. 7, no. 3, pp. 163-204. -
Goodhart, C. and B. Hofmann. 2008. “House prices, Money, Credit, and the Macroeconomy,”
Oxford Review of Economic Policy , vol. 24, no.1, pp. 180-205.
-
Gupta, R., André, C. and L. Gil-Alana. 2015. “Comovement in Euro Area Housing Prices: A Fractional Cointegration Approach,”
Urban Studies , vol. 52, no. 16, pp. 3123-3143.
- Hirata, H., Kose, M. A., Otrok, C. and M. E. Terrones. 2013. Global House Price Fluctuations: Synchronization and Determinants. IMF Working Paper, WP/13/38.
- Holmans, A. 1990. House price: Changes through Time at National and Sub-national Level. Government Economic Service Working paper, no.110.
-
Kim, K.-H. and Y.-J. Park. 2016. “International Co-movement of Housing Price Cycles in East Asia and Greater China,”
Asian Economic Papers , vol. 15, no. 1, pp. 78-98.
-
Kim, K.-H. and B. Renaud. 2009. “The Global House Price Boom and Its Unwinding: An Analysis and a Commentary,”
Housing Studies , vol. 24, no. 1, pp. 7-24.
-
Koop, G., Pesaran, M. H. and S. M. Potter. 1996. “Impulse Response Analysis in Nonlinear Multivariate Models,”
Journal of Econometrics , vol. 74, no. 1, pp. 119-147. - Leamer, E. 2007. Housing is the Business Cycle. NBER Working Paper, no. 13428.
-
Leamer, E. 2015. “Housing Really is the Business cycle: What Survives the Lessons of 2008-09?”
Journal of Money, Credit and Banking , vol. 47, no. S1, pp. 43-50.
-
Lee, H. S. and W. S. Lee. 2018. “Housing Market Connectedness among G7 Countries,”
Applied Economics Letters , vol. 25, no. 3, pp. 146-151.
-
Lee, H. S. and W. S. Lee. 2019. “Cross-regional Connectedness in the Korean Housing Market,”
Journal of Housing Economics , vol. 46. <https://doi.org/10.1016/j.jhe.2019.101654 > (accessed March 21, 2020)
-
Lee, H. S. and W. S. Lee. 2020. “Network Connectedness among Northeast Asian Financial Markets,”
Emerging Markets Finance and Trade . <https://doi.org/10.1080/1540496X.2019.1668267 > (accessed March 21, 2020) -
Lee, W. S. 2020.
Connectedness Approaches to Macroeconomic and Financial Time Series . Diss. Sogang University. -
Liow, K. H. 2012. “Co-movements and Correlations across Asian Securitized Real Estate and Stock Markets,”
Real Estate Economics , vol. 40, no. 1, pp. 97-129.
-
Liow, K. H. 2013. “Volatility Interdependence in European Real Estate Securities Markets: Who Is the Most Influential?”
Journal of European Real Estate Research , vol. 6, no. 2, pp. 117-138.
-
Liow, K. H. 2014. “The Dynamics of Return Co-movements and Volatility Spillover Effects in Greater China Public Property Markets and International Linkages,”
Journal of Property Investment & Finance , vol. 32, no. 6, pp. 610-641.
-
Liow, K. H. and G. Newell. 2012. “Investment Dynamics of the Greater China Real Estate Securities Markets,”
Journal of Real Estate Research , vol. 34, no. 3, pp. 399-428. -
MacDonald, R. and M. Taylor. 1993. “Regional House prices in Britain: Long-Run Relationships and Short-Run Dynamics,”
Scottish Journal of Political Economy , vol. 40, no. 1, pp. 43-55.
-
Mühlhofer, M. 2013. “Why Do REIT Returns Poorly Reflect Property Returns? Unrealizable Appreciation Gains Due to Trading Constraints as the Solution to the Short-Term Disparity,”
Real Estate Economics , vol. 41, no. 4, pp. 814-857.
-
Nneji, O., Brooks, C. and C. Ward. 2013. “House Price Dynamics and Their Reaction to Macroeconomic Changes,”
Economic Modelling , vol. 32, pp. 172-178.
-
Oikarinen, E. 2006. “The Diffusion of Housing Price Movements from Center to Surrounding Areas,”
Journal of Housing Research , vol. 15, no. 1, pp. 3-28.
-
Pesaran, M. H. and Y. Shin. 1998. “Generalized Impulse Response Analysis in Linear Multivariate Models,”
Economics Letters , vol. 58, no. 1, pp. 17-29.
-
Renaud, B., Kim, K.-H. and M. Cho. 2016.
Dynamics of Housing in East Asia . Oxford: Wiley Blackwell. -
Sims, C. A. 1980. “Macroeconomics and Reality,”
Econometrica , vol. 48, no. 1, pp. 1-48. -
Tsai, I. C. 2018. “House Price Convergence in Euro Zone and Non-Euro Zone Countries,”
Economic Systems , vol. 42, no. 2, pp. 269-281.
-
Tsatsaronis, K. and H. Zhu. 2004. “What Drives Housing Price Dynamics: Cross-Country Evidence,”
BIS Quarterly Review , March, pp. 65-78. -
Vansteenkiste, I. and P. Hiebert. 2011. “Do House Price Developments Spillover across Euro Area Countries? Evidence from a Global VAR,”
Journal of Housing Economics , vol. 20, no. 4, pp. 299-314.
-
Yoon, J. H. and J. H. Lee. 2014. “The Linked Movement of House Prices and GDP in the G7 Countries,”
Korea Spatial Planning Review , vol. 82, pp. 49-60.