

- EAER>
- Journal Archive>
- Contents>
- articleView
Contents
Citation
| No | Title |
|---|---|
| 1 | On the Persistence of the China Shock / 2022 / SSRN Electronic Journal |
| 2 | Hubs of embodied business services in a GVC world / 2023 / International Economics / vol.174, pp.28 / |
Article View
East Asian Economic Review Vol. 24, No. 4, 2020. pp. 313-336.
DOI https://dx.doi.org/10.11644/KIEP.EAER.2020.24.4.382
Number of citation : 2View
116
Download
138
Who Will Fill China’s Shoes? The Global Evolution of Labor-Intensive Manufacturing
|
|
Harvard Kennedy School and NBER |
|---|

Abstract
In this paper, I review evidence on changing global specialization in labor-intensive exporting. Production of apparel, footwear, furniture, and related products are how many low-income countries first enter export manufacturing. Just as China’s rise as a powerhouse in these goods supplanted a role previously occupied by the East Asian Tigers, the world may again be on the cusp of significant change in where labor-intensive goods are produced. China’s prowess in these sectors peaked in the early 2010s; its share in their global exports, while still substantial, is now in decline. Mechanisms through which the global economy may adjust to China’s graduation into more technologically sophisticated activities include expanded labor-intensive export production in other emerging economies and labor-saving technological change in products currently heavily reliant on less-educated labor. Available evidence suggests that the first mechanism is operating slowly and the second hardly at all. As a third mechanism, China may in part replace itself by moving labor-heavy factories out of densely populated and expensive coastal cities and into the country’s interior. Such a transition, though still in its infancy, would mirror the decentralization of manufacturing production in the U.S. and Europe, which occurred after World War II.
JEL Classification: F14, F16, O24
Keywords
Comparative Advantage, Export-Led Development, Labor Intensive Manufacturing, Market-Oriented Reform, China Trade Shock
I. INTRODUCTION
In 1992, Deng Xiaoping expanded China’s evolving process of “reform and opening” to encompass export-led development (Vogel, 2011). Production for foreign markets, often in processing plants owned by or subcontracting for multinational firms, flowered initially in special enterprise zones allowed to operate in select southeastern coastal cities before spreading more widely (Yu, 2015; Chen et al., 2019). First on its own and later to meet conditions for China’s accession to the World Trade Organization in 2001, the government removed barriers to exporting, lowered tariffs on imports, expanded the sectors in which foreign investment was permitted, consolidated smaller, inefficient state-owned enterprises, and allowed labor to move from rural farms to urban factories (Naughton, 2007). Most of these reforms were enacted in the span of less than a dozen years. They helped transform China into the world’s factory: its share of world manufacturing exports rose from 2.8% in 1990 to 6.8% in 2000 and to 18.5% at its peak in 2015. This once-in-an-epoch export surge reverberated throughout the global economy. It caused manufacturing job loss in regions competing with Chinese imports (Autor et al., 2013, 2016), booming exports in countries specialized in agriculture, mining, and raw materials (Costa et al., 2016), and rising global imbalances associated with China’s massive trade surpluses (Bergsten and Gagnon, 2017).
Just as the initiation of the China trade shock was sudden, it now appears that its culmination was equally abrupt. After 2010, China’s manufacturing export boom effectively stalled (Autor et al., 2020a). Its revealed comparative advantage in manufacturing remained flat during the last decade, after increasing robustly during the preceding 20 years.1 The differential in annual manufacturing export growth between China and the rest of the world, which was an impressive 8.3 percentage points per year over the period 1991 to 2010, registered only 0.7 percentage points annually between 2010 and 2016. Although China’s global market share in manufacturing is not in significant decline, it is nowhere close to expanding at its earlier rapid clip either.
In this paper, I consider how the end of the reform-driven China trade shock will affect economic development in emerging economies. Because China’s export prowess peaked first in labor-intensive manufactures—including apparel, footwear, home goods, and textiles—it is in these and related products where there appears to be a market opening. Specialization in these goods propelled not only China’s initial export-led growth, but also that of the Asian Tigers—Hong Kong, Singapore, South Korea and Taiwan—in the 1970s and 1980s (Wade, 2004). Just as the Asian Tigers later transitioned into capital-intensive manufacturing and business services, today China desires to graduate from being the world’s factory to become the world’s R&D lab. These eff intensified in 2015 with the launch of the ”Made in China 2015” initiative and have since come to form the centerpiece of China’s industrial policy and technology strategy.2 If China succeeds, it will create an opportunity for other countries to fill its wake in labor-intensive manufacturing as it reallocates resources to high- tech production, artificial intelligence-enabled services, and other innovation-intensive activities. I consider the mechanisms through which emerging economies may adjust to China’s manufacturing transition, assess evidence regarding the operation of these mechanisms, and identify the countries most likely to be affected by China’s shifting comparative advantage.
I begin the discussion, in Section 2, by reviewing literature on the causes of the China trade shock. A vibrant body of research examines how individual reforms in China and abroad contributed to the country’s export growth. Although we still have no analysis that estimates the relative contributions of the full complement of China’s market-oriented reforms to its overall trade expansion, available evidence suggests that a substantial portion of this growth is accounted for by an as-yet-unexplained productivity residual (Liu and Ma, 2020). China’s productivity miracle began to unravel in the early 2010’s (Brandt et al., 2020), coinciding with the stalling of reform and a renewed emphasis on state- directed development under Presidents Hu Jintao and Xi Jinping (Lardy, 2019). With China’s labor- force growth slowing, college attainment rising, and state-owned enterprises rebounding, growth in traditional manufacturing seems likely to continue to slow in the future.
Next, I examine China’s export performance in labor-intensive manufacturing. Following the analysis in Autor et al. (2020a), I identify the 10 labor-intensive products in which China achieved both a substantial revealed comparative advantage and a large share of global exports during the 1990s and 2000s.3 China’s share of world exports across these 10 goods peaked in 2013 at 39.3% before declining to 31.6% in 2018. Given that these goods comprise nearly 10 percent of world merchandise exports, taking over any market share that China concedes may require considerable adjustments in the global specialization of economic activity. The candidates to supplant China’s export capacity in labor-intensive manufacturing are the larger emerging-economy exporters of these products. In 2018, the top 14 such countries accounted for 19.2% of global exports in labor-intensive manufactures (whereas the next 30 countries accounted for less than 3 percent of global exports). This group includes economies in South Asia (Bangladesh, India, Pakistan, Sri Lanka), Southeast Asia (Cambodia, Indonesia, Myanmar, Vietnam), and Eastern Europe and the Mediterranean (Bulgaria, Morocco, Poland, Romania, Tunisia, Turkey). I assess their recent export performance.
Finally, I consider other adjustment mechanisms, which could forestall the relocation of labor- intensive export manufacturing outside of China. One is for China or other countries to develop new technology, which makes production in these sectors less labor-intensive, thereby allowing production to remain in China (and possibly to expand in high-income economies). By automating production, for instance, China may be able to replace labor with capital and remain vital in currently labor- intensive sectors. Although most manufacturing sectors have become more capital-intensive over time (Fort et al., 2018), many labor-intensive products have been resistant to wide-scale automation. This is in part because of the complex geometry of pliable fabric and other materials used in apparel, textile products, and related goods, which continue to make labor-intensive production techniques (under prevailing global relative factor prices) relatively efficient.4 A second mechanism would be for China to move labor-intensive manufacturing out of expensive, densely populated coastal cities and into its cheaper, less densely populated interior. A similar relocation occurred in the U.S. after World War II, abetted in part by the construction of the U.S. interstate highway system and the advent of containerized transport (Jaworski et al., 2020). China has greatly expanded its national highway and railway networks (Baum-Snow et al., 2017), which could facilitate such changes. I consider evidence on the spatial reallocation of labor-intensive manufacturing inside China. A third mechanism is for China to permit increased immigration of less-educated labor, thereby enabling factory owners to replace the dwindling supply of new rural-to-urban migrants with foreign workers. To date, China appears resistant to expanding immigration substantially. Because the government appears unlikely to accommodate this mechanism, I do not discuss it further.
1)Following
2)See, e.g., Kristen Hopewell, “What is ‘Made in China 2025’ — and why is it a threat to Trump’s trade goals?”
3)These two or three-digit SITC Revision 2 products are textiles, home fixtures, furniture, handbags and luggage, apparel, footwear, bicycles and scooters, plastic articles, toys and games, and office supplies.
4)For instance, although computer-automated design (CAD) has become common in apparel, footwear, furniture, and textiles, computer-automated manufacturing (CAM) in these goods is much less prevalent. On use of CAD/CAM in U.S. manufacturing industries, see
II. CHINA’S EXPORT BOOM
China’s emergence as an export powerhouse followed government reforms that transformed the nation from an inward-oriented and heavily centrally planned economy into a comparatively open and market-oriented one in which privately owned firms produced the majority of output. The conventional date for the commencement of the China trade shock is 1992, when Deng Xiaoping used his ”famous southern tour” to counter attempts by hardliners in the government to halt eff at reform (Vogel, 2011).5 His immediate achievement was to expand special enterprise zones, in which export assembly plants, many of which were foreign-owned, could import inputs duty free under relatively modest government regulations on the condition that they export their output (Naughton, 2007). In this section, I discuss literature on the scale and scope of these and subsequent reforms and how they affected the Chinese economy. Rather than attempting an in-depth review of the literature, I highlight the most important reforms and evidence on their impacts.
1. Scope of Trade-Related Reform in China
The country’s embrace of manufacturing as an engine for growth was a conscious attempt to emulate the success of Japan, Singapore, and South Korea in previous decades. Indeed, Singapore’s long-serving Prime Minister Lee Kuan Yew was something of an informal adviser to Deng as he crafted his reform strategy (Vogel, 2011). Because of China’s long history of central planning, the reform process was complex. It entailed allowing foreign firms to invest in the country and to import foreign machinery and technology (Yu, 2015), creating a more market friendly commercial legal system for firms operating in special enterprise zones (Feenstra and Hanson, 2005), dismantling a system of foreign trading rights in which most firms were required to export through state-owned intermediaries (Bai et al., 2017), consolidating and closing smaller, inefficient state-owned enterprises (Hsieh and Song, 2015), lowering import barriers (Brandt and Morrow, 2017), and relaxing restrictions on internal migration embodied in the hukou registration system (Fan, 2019).6 Central to China’s export growth was the country’s insertion into global value chains, in which export-processing plants in China assembled outputs from imported inputs. Many of these production chains were orchestrated by multinational enterprises based in Hong Kong and Taiwan, with companies from South Korea and Japan also making major investments in the country.
Some of the reforms—including removing barriers on foreign investment, exports, and imports—were mandated by China’s WTO accession agreement.7 The accession, in turn, guaranteed China’s Most-Favored-Nation access to the markets of WTO members, thereby reducing uncertainty about the future magnitude of import barriers in these nations (Pierce and Schott, 2016; Handley and Limao, 2017). Of particular importance for labor-intensive manufacturing, China’s entry into the WTO allowed it to benefit from the long-awaited dismantling of the Multi-Fiber Arrangement, which permitted high-income countries to set quotas on apparel and textile imports (Khandelwal et al., 2013). The MFA was phased out in stages between 1994 and 2005, meaning that China began to enjoy quota-free access to high-income apparel and textile markets after 2001.8
2. Impacts of Trade-Related Reform in China
What impact did these internal and external reforms have on China’s export growth? Consider, first, the impact of reductions in import tariffs in China, which gave domestic firms lower cost access to imported inputs and subjected them to greater import competition. The WTO-mandated reduction in import tariffs affected both firm productivity and price-cost markups, which is broadly consistent with previous research. Total factor productivity rose by more in firms facing larger reductions in both input and output tariffs. Brandt et al. (2017) estimate that the productivity impacts of lower input tariffs were an order of magnitude larger than those of lower output tariffs: over the period 1998 to 2007, a firm facing a 10% larger reduction in input tariffs would have had a 16% larger increase in TFP, versus a 1% differential increase in TFP for an equivalent change in output tariffs. Because imported inputs embody foreign technology, reducing their relative prices may unleash cost-saving or quality-enhancing innovations on the part of firms (Amiti and Konings, 2007; Goldberg et al., 2010). These tariff changes also reduced dispersion in price-cost markups across firms, consistent with trade reform having decreased the misallocation of resources within industries (Lu and Yu, 2015). Across all manufacturing industries, the period of trade reform was when China experienced its most rapid TFP growth. Whereas annual average TFP growth was 2.0% per year over 1998 to 2007, it was only 1.1% per year over 2007 to 2013 Brandt et al. (2020).
During the most intense period of China’s export boom, export processing plants accounted for the majority of foreign shipments in manufacturing. In 2005, export processing were responsible for an impressive 54.7% of China’s total manufacturing exports (Liu and Ma, 2020). Because of the high import content of these firms’ material purchases, the domestic content of China’s manufacturing exports was below 65 percent during the 1990s and early 2000s (Koopman et al., 2012; Kee and Tang, 2016). China’s later export diversification contributed to a declining importance of export processing, with its share of China’s manufacturing exports falling to 35.0% in 2015, a shift accompanied by an increase in the domestic content of China’s foreign shipments.
The impact of China’s joining the WTO was perhaps more subtle than it first appeared. By the 1990s, many high-income countries, including the U.S., already granted China Most-Favored-Nation (MFN) access to their markets. This meant that even prior to its accession to the WTO, Chinese exports were often subject to the same import tariffs as any other WTO member. Pierce and Schott (2016) and Handley and Limao (2017) argue that the material impact of China’s WTO entry on barriers to its exports was not the actual change in tariffs on Chinese goods but in uncertainty over future values of these tariffs, especially in the U.S. Although the U.S. had granted China MFN status in 1980, between 1989 and 2000 the U.S. Congress was required to reauthorize this status annually. Reauthorizations were frequently the subject of heated political debate, suggesting that their passage was not a foregone conclusion. Using a quantitative trade model to compare outcomes in trade regimes with and without uncertainty over U.S. trade policy, Handley and Limao (2017) estimate that China’s exports would be approximately 30% larger without the uncertainty.
A second area of subtlety regarding China’s WTO entry relates to the special treatment of apparel and textiles. Between 1974 and 2004, international trade in these goods was governed not by the General Agreement on Tariffs and Trade (GATT) but by the Multi-Fiber Arrangement (MFA), under which high-income countries were allowed to impose import quotas on these products. For other goods, the GATT expressly forbade quotas as a tool of trade policy. The MFA, which grew out of restraints that the U.S. had placed on Japan in the 1950s, was initially billed as a mechanism for high-income countries to wind down production in goods in which their comparative advantage was weak, and in which, because of their labor intensity, employment was relatively high. Yet, the elimination of the MFA did not begin until 1995, with most quotas not removed until the 2002 and 2005 phase outs. Khandelwal et al. (2013) document that in China the allocation of quota rights to firms, which was left largely to exporting countries to administer, favored inefficient producers, many of them state-owned enterprises. The elimination of the MFA quotas allowed the entry of new firms, whose higher productivity generated a massive increase in China’s apparel and textile exports to the European Union and the U.S. The result was a 21.3% increase in TFP in China’s apparel and textile production, 71% of which was due to firm entry, a finding which aligns with the importance of entry for overall productivity growth in the sector (Brandt et al., 2012).
Consider next the removal of export restrictions. Between 2000 and 2004, China eliminated provisions that required private firms under specified size thresholds (which varied by industry) to channel exports through state-owned intermediaries. Owing to the inefficiencies of these intermediaries, the practice imposed an effectively tax on exporting. Bai et al. (2017) perform counterfactual exercises in which they compare a no-export-restriction regime (i.e., resembling that post 2004) with a regime that bans direct exporting (i.e., that requires all firms to export through intermediaries), which is somewhat more extreme than the pre-2000 policy. Removing direct export bans alone would have expanded long-run export revenue by 4%.9
Each of the results we have discussed so far is for a given policy change considered in isolation. No research, as of yet, performs counterfactual analysis in which changes in China’s trade policy are implemented sequentially in order to gauge their relative contributions to the country’s export growth. The paper that comes closest to the exercise is Liu and Ma (2020).10 They construct a quantitative trade model for China, in which they assess how changes in tariffs on Chinese imports, tariffs on Chinese exports, and imputed barriers to internal migration affected manufacturing exports over the reform period. Of China’s export growth over 1990 to 2005, they ascribe 15.6% to reductions in import tariffs in China, 8.4% to reductions in foreign tariffs on imports from China, and 6.7% to reductions in barriers to internal migration in China. The remaining 69.4% of China’s manufacturing export growth loads on to a productivity growth residual. Part of this residual productivity growth could be the indirect consequence of trade reform, as highlighted by the results in Khandelwal et al. (2013) and Brandt et al. (2017). What is clear in both reduced-form econometric analysis and counterfactual analysis based on quantitative modeling is that productivity growth in China (some explained, some not) is an important proximate cause of the country’s export surge.
5)In truth, China’s manufacturing export growth began in the 1980s
6)The undervaluing of China’s yuan-dollar exchange rate in the early 2000s may have contributed to the country’s export boom
7)It is perhaps tempting to overstate the impact of China’s WTO accession on its trade policy.
8)The dramatic surge in apparel and textile imports from China led the US and the European Union to partly restrict imports of these goods into 2008.
9)The policy-induced gain in export revenue is 26% if one allows for dynamic learning effects in export production.
10)For a related decomposition of China’s manufacturing export growth, see
III. EXPORT PERFORMANCE IN LABOR-INTENSIVE MANUFACTURING
In this section, I compare China’s export performance in labor-intensive manufacturing with that of other emerging economies. The aim of this simple and descriptive analysis is to time the beginning and ending of China’s export boom and identify which countries may be in position to expand their exports in the event that China continues to reorient its production toward more technologically sophisticated goods and services. I focus on the 10 two- or three-digit SITC products which U.S. industry data indicate are strongly labor intensive (Hanson, 2017) and in which China achieved market dominance in the 1990s and 2000s. These goods are textile yarn and fabric (SITC 65); sanitary, plumbing, heating, and lighting fixtures and fittings (SITC 81); furniture and parts (SITC 82); travel goods, handbags, and similar containers (SITC 83); articles of apparel and clothing accessories (SITC 84); footwear (SITC 85); cycles, scooters, and invalid carriages (SITC 785); articles of plastic materials (SITC 893); baby carriages, toys, games, and sporting goods (SITC 894); and office and stationary supplies (SITC 85). Collectively, these goods accounted for 8.8% of global merchandise exports in 1985, 11.7% in 1995, 9.5% in 2005, and 9.0% in 2015. The countries I consider are the 14 top emerging-economy exporters across these 10 sectors as of 2018.11
1. China
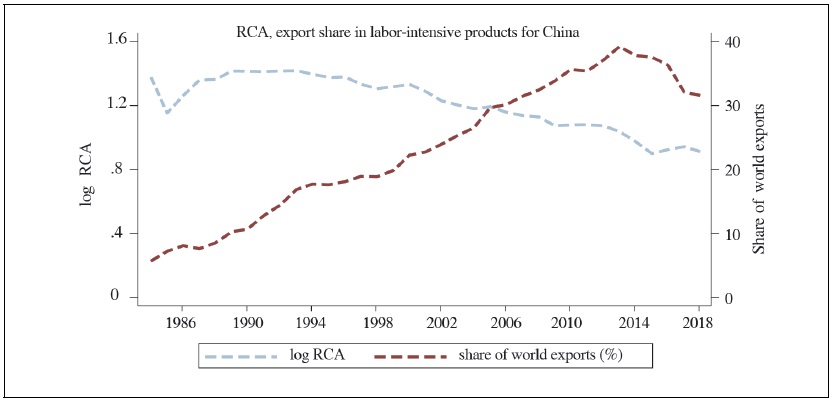
Figure 1 shows China’s share of world exports and log revealed comparative advantage (RCA) across the ten labor-intensive products over the period 1984 to 2018. China’s global export market share in these goods rose from 5.7% in 1984 to 22.8% in 2001 (average growth of 1.0 percentage point per year) during the early stages of export-led development, jumped to 39.2% in 2013 (for an average increase of 1.4 percentage points per year over 2001-2013) after China’s accession to the WTO, and then dropped to 31.6% in 2018. Part of the decline in China’s global export market share after 2016 may be an artifact of the data. In 2017 and 2018, China had rapid export growth in SITC 931 (special transactions and commodities not classified according to kind), which functions as a category for anomalies and errors in trade flows.12 Yet, even if one stops the series in 2016, it is clear that China’s global market share in labor-intensive exports began to erode in the early 2010s.
The Balassa (1965) RCA measure shown in Figure 1, which is the ratio of a country’s share of world exports in a particular sector to its share of world exports of all goods (here expressed in logs),13 indicates that although China had a strong revealed comparative advantage in labor intensive goods early in its export-led development, this advantage has declined steadily over time. At its peak in 1992, China’s global share of labor-intensive exports exceeded its global share of all merchandise exports by 142 log points. By 2001, this advantage had declined modestly to 129 log points (a decline of 0.5 log points per year over 1984 to 2001), whereas by 2013 it had dropped to 104 log points (a decline of 2.1 log points per year over 2001 to 2013) and by 2018 it had fallen further to 90 log points (a decline of 2.6 log points per year over 2013 to 2018). As China’s export growth in less-labor-intensive goods has accelerated, the importance of its labor-intensive mainstays has diminished. The share of the 10 labor-intensive products in China’s total merchandise exports (which is not shown in Figure 1) rose from 37.8% in 1984 to 47.1% in 1993 before declining to 17.7% in 2013 and then to 13.8% in 2018. It is remarkable that for such a large country China’s early export specialization was concentrated on such a narrow set of products. It has since diversified its exports, while its overall export growth has slowed substantially.
What caused the end of China’s export surge in labor-intensive manufacturing? One likely factor is the overall deceleration of economic growth in China. The country’s post-Deng boom was in part transitional in nature, implying that it would ultimately play itself out (Song et al., 2011). Once trade and other reforms were in place and a substantial share of the labor force had moved from the countryside to cities, growth rates would naturally subside (Brandt and Lim, 2020). Other contributing factors may have included the slowdown and then reversal in the growth of China’s labor force (Li et al., 2012) and the rapid increase in college attainment after 2001 (Ma, 2020). These changes appear to have put upward pressure on the relative wages of less-educated workers, thereby eroding China’s comparative advantage in apparel, footwear, and similar products. Changes in state policy may have also mattered. In 2008, President Hu Jintao gave (low productivity) state-owned enterprises (SOEs) renewed prominence in industrial planning (Naughton, 2016), a shift reinforced by President Xi Jinping in 2012 (Lardy, 2019).14 The reprioritization of SOEs has created a drag on productivity growth (Hsieh and Song, 2015; Brandt et al., 2020), possibly hastening the expiration of China’s reform-era productivity-growth miracle.
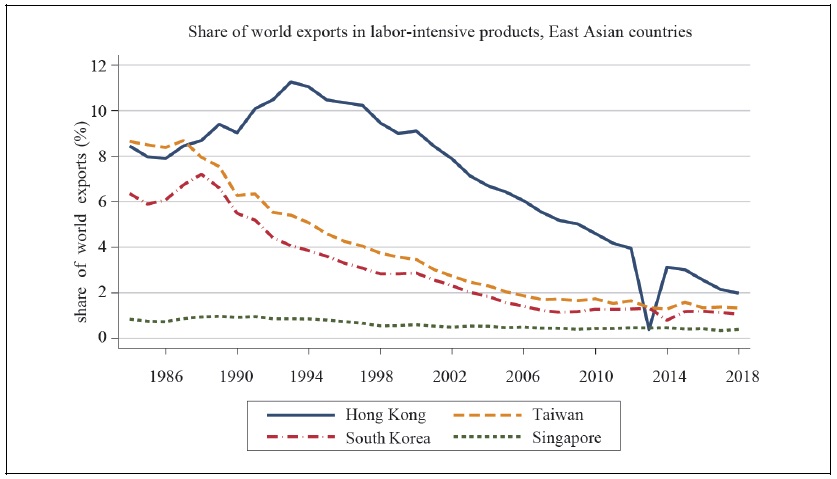
China’s rise to global dominance in labor-intensive export manufacturing during its reform period was dramatic. Could its exit from this stage be equally so? For context, Figure 2 shows the share of global exports in the 10 labor-intensive products accounted for by the four East Asia Tigers. The 1984 to 2018 time period spans the apogee and subsequent decline of these economies as labor-intensive export powerhouses. At their peak in 1988, Hong Kong, Taiwan, South Korea, and Singapore collectively produced 24.8% of the global supply of labor-intensive manufacturing exports, a figure short of China at its peak (39.2% in 2013). Since 1988, the four countries have seen their market share fall by 0.7 percentage points per year, such that by 2018 their market share was down to 4.8%. No doubt, China’s economic opening hastened the shift in specialization by these countries into more capital and skill-intensive goods and services, including automobiles, business logistics, chemicals, electronics, entertainment, finance, and shipbuilding. Like China today, East Asian economies invested heavily in human and physical capital (Hsieh, 2002), which also contributed to their export reorientation. As we look forward to China’s possible transition out of labor-intensive production, the question is whether there is another “China” waiting to take China’s place.
2. Other Countries
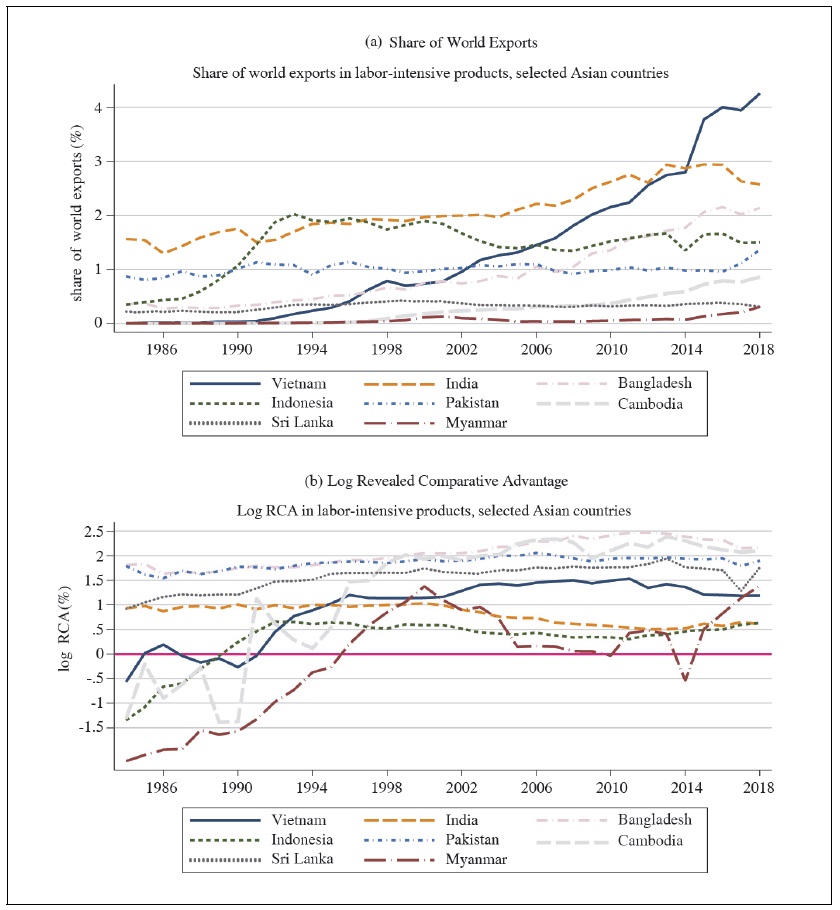
Figure 3 shows world export shares and log revealed comparative advantage for the 10 labor-intensive sectors in the eight Asian countries that were among the top 14 emerging-economy exporters of these goods in 2018. Collectively, these eight economies—Bangladesh, Cambodia, India, Indonesia, Myanmar, Pakistan, Sri Lanka, and Vietnam—accounted for 13.3% of global exports in labor-intensive manufactures in 2018, up from 7.2% in 2001 and 3.4% in 1984. Not surprisingly, this group includes the four large low-income economies that produce most of South Asia economic output and the lower-income economies within Southeast Asia. Low average incomes are evidence of relatively abundant supplies of less-educated labor, which may contribute to these countries having a comparative advantage in labor-intensive production. Yet, their export performance over the last two decades is mixed. Although Bangladesh, Cambodia, and Vietnam have seen substantial increases in their global shares of labor-intensive exports since 2000 and especially since 2005, other countries have not. India, despite its size, has managed only slightly more than a one-half percentage point increase in its global export share since 2000, while Pakistan’s export share has been flat for the last three and a half decades and Indonesia’s export market share has fallen since 2000. Myanmar and Sri Lanka, for their part, remain small players in global markets.
To gain insight into the forces behind these divergent country patterns, consider the time paths for revealed comparative advantage in Figure 3, which helps gauge export growth in labor-intensive products relative to export growth for all merchandise. Bangladesh, Cambodia, and Vietnam show pronounced increases in their RCAs in labor-intensive products. As these countries have developed, their economies have become increasingly concentrated on exporting apparel, footwear, and the like. By contrast, India’s RCA in these products has declined over time, while Pakistan’s is essentially flat. India thus appears to have modestly shifted its exports toward non-labor-intensive goods, whereas Pakistan’s lackluster performance in labor-intensive exports is not due to shifting specialization patterns but due to lackluster export growth overall. With Bangladesh, Cambodia, and Vietnam still accounting for less than eight percent of world exports in labor-intensive goods, they do not appear yet to represent (collectively) the next China, especially in light of their much smaller aggregate economic size when compared to China.
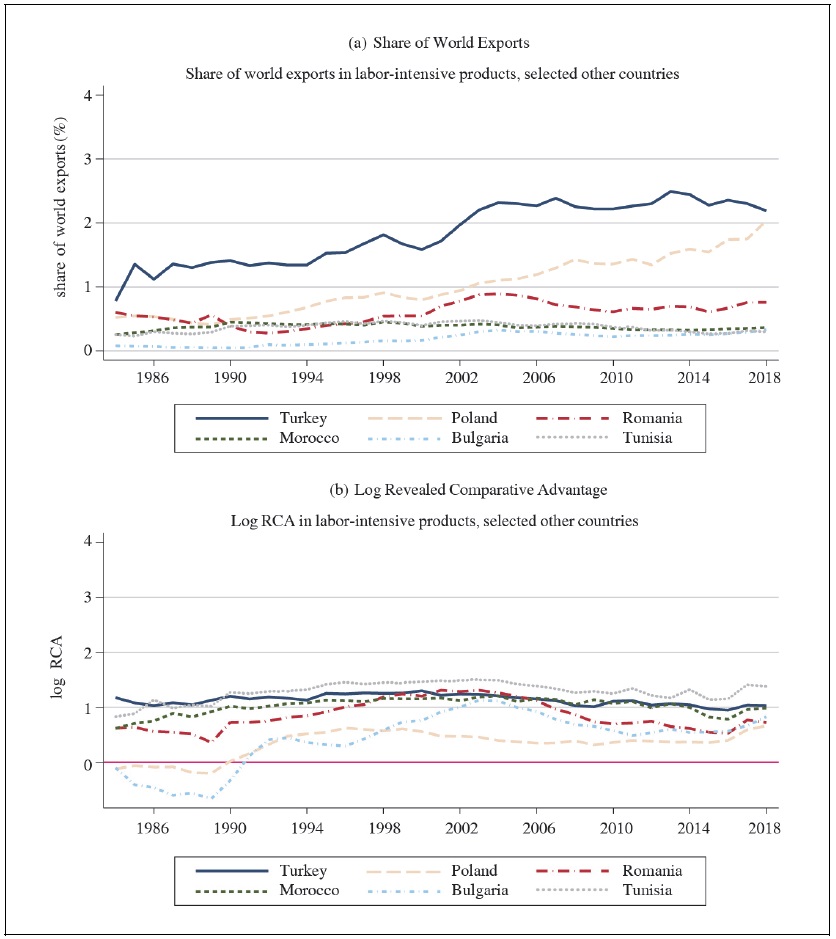
Asia is not the only region in which emerging economies account for a significant share of labor- intensive manufacturing exports. The other countries that comprise the top 14 include Bulgaria, Romania, and Poland in Eastern Europe and Morocco, Tunisia, and Turkey in North Africa and the Middle East. Their export performance in labor-intensive products is shown in Figure 4. In 2018, these countries together accounted for 6.0% of global exports of labor-intensive goods, up from 4.4% in 2001 and 2.5% in 1984. Of this group, only Poland shows a strong recent increase in its global export share. Its export prowess is concentrated in furniture (6.1% of global exports in 2018), articles of plastic (3.1% of global exports in 2018), home fixtures (2.7% of global exports in 2018), and toys and games (2.3% of global exports in 2018). Although Turkey is the largest exporter of the group, its export shares have been flat for the last two decades, as has its revealed comparative advantage in labor-intensive goods, which indicates that across the board Turkey’s exports have grown approximately on pace with the global economy.
At the time Deng completed his famous southern tour in 1992, China already accounted for 12.9% of global exports in labor-intensive products. Over the next two decades, which involved extensive market opening and a blistering pace of aggregate GDP growth, China was able to expand this market share by over 25 percentage points. Most other emerging economies have already completed their market openings and as a group show little sign of replicating China-style GDP growth. The only way these countries could capture China’s market share in the same manner that it captured market share from the East Asian Tigers would be through massive investments in productive capacity. China itself has been the source of investment in Vietnam and Indonesia, among other destination countries.15 Whereas the East Asian Tigers were followed by China, in all its immensity, no comparable transition appears likely to occur as China’s growth slows and it diversifies its exports away from its earlier narrow specialization on labor-intensive goods.
The U.S. may have encouraged moving labor-intensive production out of China through the tariffs that President Trump imposed on Chinese imports in late 2017. This initial round of tariff increases launched a more intensive period of conflict between the U.S. and China with regards to trade policy. Recent work establishes that U.S. tariffs on China (and China’s retaliatory tariffs on the U.S.) led to sharp reductions in trade flows between the two countries (Amiti et al., 2019; Fajgelbaum and Gaubert, 2020). Although there is evidence that tariffs led to diversion in U.S. imports from China to other countries—see in particular Flaaen et al. (2020) on the case of refrigerators—we do not yet know how widespread these diversion eff are or by how much they will affect global specialization patterns in labor-intensive manufacturing. If the China-U.S. trade war proves to be short lived, U.S. tariffs may cease to be a force for relocating production out of China.
11)To focus the discussion, I limit my analysis to larger emerging economies, which collectively may have sufficient heft to help replace China’s presence in labor-intensive exporting. There are a large number of smaller countries that have a strong revealed comparative advantage in labor-intensive goods and which may benefit from China’s diminished presence in the sector. These include economies in Africa (Egypt, Ethiopia, Eswatini, Kenya, Lesotho, Madagascar, Mauritius, Tanzania), Asia and the Middle East (Armenia, Jordan, Kyrgyzstan, Nepal, Uzbekistan), Eastern Europe (Albania, Bosnia Herzegovina, Croatia, Lithuania, Moldova, No. Macedonia, Serbia), and Central America and the Caribbean (Dominican Republic, El Salvador, Guatemala, Haiti, Honduras, Nicaragua). In 2018, these 26 countries collectively accounted for just 2.5% of global exports in the 10 labor-intensive products.
12)The share of SITC 93 in China’s merchandise exports rose from 1.3% in 2000 to 4.2% in 2016 and then to 13.7% in 2017 (before dropping slightly to 13.4% in 2018).
13)In the
14)Although much as been made of the launch of the “Made in China 2025” initiative in 2015 as signaling China’s turn to a more aggressive industrial policy and promotion of advanced manufacturing, preferences for skill and capital- intensive sectors were evident in earlier initiatives, including the “National Medium to Long Term Plan for the Development of Science and Technology” (2006) and the “Decision of the State Council on Accelerating the Fostering and Development of Strategic Emerging Industry” (2010).
15)See, e.g., “Why globalists and frontier-market investors love Vietnam,”
IV. ALTERNATIVE ADJUSTMENT MECHANISMS
If it turns out that there is no China to succeed China in apparel, footwear, furniture, home goods, and textiles, how would the global economy adjust? One mechanism would be through the creation of new technology that replaces labor with capital in currently labor-intensive industries. In 2010, capital-labor ratios in China’s apparel and textile industries were just 30% of that in electronics, 17% of that in transport equipment, and 12% of that in basic iron and steel (Li et al., 2012).
Evidence of rampant capital-biased innovation in labor-intensive manufacturing is difficult to find. One indicator of the pace of innovation is the creation of new patents. Between 1991 and 2007, apparel, textiles, and footwear accounted for just 0.2% of patent applications in the U.S., while furniture and wood products accounted for just 0.7% (Autor et al., 2020b). Another indication of the pace of innovation is the adoption of robotic production techniques. Over the period 1993 to 2007, apparel and textiles lagged behind all other manufacturing sectors except paper and printing in the penetration of industrial robots (Acemoglu and Restrepo, 2020). China is now among the world leaders in robot adoption. Its share of global purchases of industrial robots rose from 0.4% in 2000 to 12.4% in 2010 and to 29.6% in 2016. Yet, robot adoption within Chinese manufacturing, as in the rest of the world, remains heavily concentrated in traditionally capital-intensive sectors, such as automobiles and electronics (Cheng et al., 2019).
China itself may be partly responsible for the sluggish pace of innovation in these industries (Autor et al., 2020b). With its earlier large and growing supply of less-educated labor available for export production, the incentive for labor-saving technological change in its initial core industries may have been weak. China’s turn towards high tech, and the absence of obvious successors to China, may induce more rapid technological change in labor-intensive manufacturing. However, another reason for the relative absence of innovation in the sector may be the nature of production itself. Fabric, leather, plastic, and wood—which are key intermediate inputs in many of the relevant industries—are pliable, porous, and (or) soft materials, which may make them partially resistant to automation.16 Whether or not the world is on the verge of a major shift in technology for producing these goods, we do not see indication that such a shift is already underway.17
A second mechanism through which the global economy may adjust to what would otherwise be China’s shift away from labor-intensive manufacturing is for China itself to change. China’s declining comparative advantage in labor-intensive goods could induce an endogenous relocation of economic activity within the country. As the locus of new firm creation in China moves from one set of industries (e.g., apparel, footwear, and textiles) to another (e.g., semiconductors, robotics, web-based services), there may be pressure for activities with relatively slow productivity growth to move out of densely concentrated cities. Dense concentration is often an indication of agglomeration economies, which for major cities may be stronger in innovation-intensive production than in mature industries in which production is already routinized (Duranton and Puga, 2001). The exodus of manufacturing from China’s coastal cities to its interior is thus a potential means for it to preserve its export capacity in labor-intensive sectors. In such an event, China would end up replacing itself.
In the U.S., manufacturing production moved out of major urban areas and into smaller towns and cities in the decades after World War II. This move was made possible in part by the construction of the U.S. interstate highway system (Michaels, 2008), as well as by containerized shipping (Levinson, 2016), which reduced the cost of serving larger urban and international markets from the U.S. interior. China’s recent expansion of its highway and railway networks has similarly connected its interior towns and cities to national and international buyers (Baum-Snow et al., 2017).
Since 2004, manufacturing output has been growing more rapidly in China’s interior provinces than in its coastal provinces (Zheng et al., 2014), consistent with decentralization. Yet, of China’s 39 two-digit manufacturing industries, it is the labor-intensive sectors that have been among the most geographically concentrated in coastal areas. In 2004, five of the 10 most geographically concentrated industries were labor-intensive (apparel, leather and footwear, textiles, sports equipment, office supplies) (Long and Zhang, 2012), similar to location patterns in the U.S. which the literature has interpreted as evidence of industry-specific agglomeration economies (Ellison et al., 2010). The primary location for each of these industries was a coastal province (Guangdong, Fujian, Jiangsu, Zhejiang), in which wages and land prices well exceed those in the interior (Li et al., 2012). Because of agglomeration economies, there may be coordination problems in industry relocation. Whereas it may be socially optimal for the industry as a whole to move inland, no individual firm may have an incentive to move, given the existing concentration of activity on the coast.
To date, China’s efforts to deconcentrate export production has had mixed success. In the 2000s, China began to encourage manufacturing to move out of coastal provinces and into the hinterland. Between 2004 and 2006 alone, the government closed approximately 70% of development zones (a broad category, which includes the special enterprise zones discussed in Section 2), which were concentrated in coastal cities. Although the intent was to push industry into the country’s interior and thereby reduce the spatial misallocation of resources, one possible byproduct of the policy was to reduce incentives for firms to agglomerate spatially, which could adversely affect aggregate productivity. Chen et al. (2019) estimate that the termination of development zones resulted in 5% lower total factor productivity and output growth in firms subject to zone closure (i.e., firms initially located in a development zone whose zone was subsequently closed) relative to firms escaping such treatment (i.e., firms initially located in a zone that was not closed). Impacts were larger for firms located closest to China’s three major ports (Hong Kong, Shanghai, and Tianjin). Overall, China’s five largest exporting provinces (Guangdong, Fujian, Jiangsu, Shanghai, Shandong, Zhejiang) accounted for 78.5% of China’s exports in 2013, a figure that was little changed since 2000. As of 2018, China’s top five provinces still accounted for just under three-quarters of exports. China’s coast remains the country’s manufacturing belt. Although the government has permitted development zones to be created in the country’s interior, these have been far less successful in terms of export growth than those on the coast.
Similar to the first two mechanisms I considered, one can make an economic case that China may be on the brink of major changes in its spatial distribution of manufacturing production. Also similar to these mechanisms, evidence for major adjustments being underway is hard to find.
16)See, e.g., “The Sewing Robot,” Episode 715,
17)A second form of innovation is brand development and marketing. If China is able to improve the marketing of its products and (or) launch its own consumer brands, it may forestall the loss of these production sectors. Yet, even if Chinese firms succeed in marketing-oriented innovations, they would likely matter less at the bottom end of the market and would not remove the incentive to perform production in the least-cost location.
V. FINAL DISCUSSION
Over the last 70 years, many of the countries that became export powerhouses did so by starting on the ground floor, producing t-shirts, fabric, shoes, children’s toys, bicycles, dressers, table lamps, and the like. First Japan, then the East Asian Tigers, and finally China followed this path to achieve high levels of income growth. For the last 30 years, China’s presence has complicated life for other countries pursuing a conventional strategy of export-led development. It may have been hard to get ahead via labor-intensive manufacturing if China kept driving down product prices and gobbling up market share. In China’s economic shadow, warmth may have been hard to find.
Yet, that shadow now appears to be shrinking. As China’s labor force becomes more educated, older, and smaller and as rural-to-urban migration decelerates, the country confronts a declining comparative advantage in labor-intensive goods. The diversification and increasing technological sophistication of China’s exports—some of which may be due to market forces and some to state intervention—indicates that a shift in global specialization is already well underway. Of the three adjustment mechanisms I have reviewed—a reallocation of labor-intensive export production to other emerging economies, labor-saving technological change in historically laborheavy industries, and a relocation of manufacturing production within China—the first and third appear to be working slowly and the second not at all. Who will fill China’s shoes remains something of a puzzle.
Tables & Figures
Figure 1.
China Exports in Labor-Intensive Manufacturing
Note: Data are from UN Comtrade, SITC Revision 2. The 10 labor-intensive goods are textile yarn and fabric (SITC 65); home fixtures and fittings (SITC 81); furniture (SITC 82); travel goods and handbags (SITC 83); apparel (SITC 84); footwear (SITC 85); cycles, scooters, and wheelchairs (SITC 785); articles of plastic (SITC 893); toys, games, and sports equipment (SITC 894); and office supplies (SITC 85).
Figure 2.
East Asia Exports in Labor-Intensive Manufacturing
Note: Data are from UN Comtrade, SITC Revision 2. The 10 labor-intensive goods are textile yarn and fabric (SITC 65); home fixtures and fittings (SITC 81); furniture (SITC 82); travel goods and handbags (SITC 83); apparel (SITC 84); footwear (SITC 85); cycles, scooters, and wheelchairs (SITC 785); articles of plastic (SITC 893); toys, games, and sports equipment (SITC 894); and office supplies (SITC 85).
Figure 3.
South and Southeast Asian Exports in Labor-Intensive Manufacturing
Note: Data are from UN Comtrade, SITC Revision 2. The 10 labor-intensive goods are textile yarn and fabric (SITC 65); home fixtures and fittings (SITC 81); furniture (SITC 82); travel goods and handbags (SITC 83); apparel (SITC 84); footwear (SITC 85); cycles, scooters, and wheelchairs (SITC 785); articles of plastic (SITC 893); toys, games, and sports equipment (SITC 894); and office supplies (SITC 85).
Figure 4.
Other Emerging Economy Exports in Labor-Intensive Manufacturing
Note: Data are from UN Comtrade, SITC Revision 2. The 10 labor-intensive goods are textile yarn and fabric (SITC 65); home fixtures and fittings (SITC 81); furniture (SITC 82); travel goods and handbags (SITC 83); apparel (SITC 84); footwear (SITC 85); cycles, scooters, and wheelchairs (SITC 785); articles of plastic (SITC 893); toys, games, and sports equipment (SITC 894); and office supplies (SITC 85).
References
-
Acemoglu, D. and P. Restrepo. 2020. “Robots and Jobs: Evidence from US Labor Markets,”
Journal of Political Economy , vol. 128, no. 6, pp. 2188-2244.
-
Amiti, M. and J. Konings. 2007. “Trade Liberalization, Intermediate Inputs, and Productivity: Evidence from Indonesia,”
American Economic Review , vol. 97, no. 5, pp. 1611-1638.
-
Amiti, M., Redding, S. J. and D. E. Weinstein. 2019. “The Impact of the 2018 Tariffs on Prices and Welfare,”
Journal of Economic Perspectives , vol. 33, no. 4, pp. 187-210.
-
Autor, D. H., Dorn, D. and G. H. Hanson. 2013. “The China Syndrome: Local Labor Market Effects of Import Competition in the United States,”
American Economic Review , vol. 103, no. 6, pp. 2121-2168.
-
Autor, D. H., Dorn, D. and G. H. Hanson. 2016. “The China Shock: Learning from Labor Market Adjustment to Large Changes in Trade,”
Annual Review of Economics , vol. 8, pp. 205-240.
- Autor, D. H., Dorn, D. and G. H. Hanson. 2020a. “On the Persistence of the China Shock,” Working paper, Harvard University.
-
Autor, D. H., Dorn, D., Hanson, G. H., Pisano, G. and P. Shu. 2020b. “Foreign Competition and Domestic Innovation: Evidence from U.S. Patents,”
American Economic Review: Insights , vol. 2, no. 3, pp. 357-374.
-
Bai, X., Krishna, K. and H. Ma, 2017. “How You Export Matters: Export Mode, Learning and Productivity in China,”
Journal of International Economics , vol. 104, pp. 122-137.
-
Balassa, B. 1965. “Trade Liberalisation and ‘Revealed’ Comparative Advantage,”
Manchester School , vol. 33, no. 2, pp. 99-123.
-
Baum-Snow, N., Brandt, L., Henderson, J. V., Turner, M. A. and Q. Zhang. 2017. “Roads, Railroads, and Decentralization of Chinese Cities,”
Review of Economics and Statistics , vol. 99, no. 3, pp. 435-448.
-
Bergsten, C. F. and J. E. Gagnon. 2017.
Currency Conflict and Trade Policy: A New Strategy for the United States . Washington, DC: Peterson Institute for International Economics. - Brandt, L. and K. Lim. 2020. Accounting for Chinese Exports. Working paper, no. 680. University of Toronto, Department of Economics.
- Brandt, L., Litwack, J., Meleva, E., Wang, L., Zhang, Y. and L. Zhao. 2020. China’s Productivity Slowdown and Future Growth Potential. World Bank Policy Research Working Paper, no. 9298.
-
Brandt, L. and P. M. Morrow. 2017. “Tariffs and the Organization of Trade in China,”
Journal of International Economics , vol. 104, pp. 85-103.
-
Brandt, L., Van Biesebroeck, J., Wang, L. and Y. Zhang. 2017. “WTO Accession and Performance of Chinese Manufacturing Firms,”
American Economic Review , vol. 107, no. 9, pp. 2784-2820.
-
Brandt, L., Van Biesebroeck, J. and Y. Zhang. 2012. “Creative Accounting or Creative Destruction? Firm-Level Productivity Growth in Chinese Manufacturing,”
Journal of Development Economics , vol. 97, no. 2, pp. 339-351.
- Branstetter, L. and N. Lardy. 2006. China’s Embrace of Globalization. NBER Working Paper, no. 12373.
- Chen, B., Lu, M., Timmins, C. and K. Xiang. 2019. Spatial Misallocation: Evaluating Place-Based Policies Using a Natural Experiment in China. NBER Working Paper, no. 26148.
-
Cheng, H., Jia, R., Li, D. and H. Li. 2019. “The Rise of Robots in China,”
Journal of Economic Perspectives , vol. 33, no. 2, pp. 71-88. -
Cheung, Y.-W., Chinn, M. D. and E. Fujii. 2007. “The Overvaluation of Renminbi Undervaluation,”
Journal of International Money and Finance , vol. 26, no. 5, pp. 762-785.
-
Costa, F., Garred, J. and J. P. Pessoa. 2016. “Winners and Losers from a Commodities-for-Manufactures Trade Boom,”
Journal of International Economics , vol. 102, pp. 50-69.
-
Duranton, G. and D. Puga. 2001. “Nursery Cities: Urban Diversity, Process Innovation, and the Life Cycle of Products,”
American Economic Review , vol. 91, no. 5, pp. 1454-1477.
-
Eaton, J. and S. Kortum. 2002. “Technology, Geography, and Trade,”
Econometrica , vol. 70, no. 5, pp. 1741- 1779.
-
Ellison, G., Glaeser, E. L. and W. R. Kerr. 2010. “What Causes Industry Agglomeration? Evidence from Coagglomeration Patterns,”
American Economic Review , vol. 100, no. 3, pp. 1195-1213.
-
Fajgelbaum, P. D. and C. Gaubert. 2020. “Optimal Spatial Policies, Geography, and Sorting,”
Quarterly Journal of Economics , vol. 135, no. 2, pp. 959-1036. -
Fan, J. 2019. “Internal Geography, Labor Mobility, and the Distributional Impacts of Trade,”
American Economic Journal: Macroeconomics , vol. 11, no. 3, pp. 252-88.
-
Feenstra, R. C. and G. H. Hanson. 2005. “Ownership and Control in Outsourcing to China: Estimating the Property-Rights Theory of the Firm,”
Quarterly Journal of Economics , vol. 120, no. 2, pp. 729-761. -
Flaaen, A., Hortaçsu, A. and F. Tintelnot. 2020. “The Production Relocation and Price Effects of US Trade Policy: The Case of Washing Machines,”
American Economic Review , vol. 110, no. 7, pp. 2103-2127.
-
Fort, T. C. 2017. “Technology and Production Fragmentation: Domestic versus Foreign Sourcing,”
Review of Economic Studies , vol. 84, no. 2, pp. 650-687. -
Fort, T. C., Pierce, J. R. and P. K. Schott. 2018. “New Perspectives on the Decline of US Manufacturing Employment,”
Journal of Economic Perspectives , vol. 32, no. 2, pp. 47-72. -
Goldberg, P. K., Khandelwal, A., Pavcnik, K. N. and P. Topalova. 2010. “Imported Intermediate Inputs and Domestic Product Growth: Evidence from India,”
Quarterly Journal of Economics , vol. 125, no. 4, pp. 1727-1767. -
Handley, K. and N. Limao. 2017. “Policy Uncertainty, Trade, and Welfare: Theory and Evidence for China and the United States,”
American Economic Review , vol. 107, no. 9, pp. 2731-2783.
-
Hanson, G. H. 2017. “Chapter 2. Export Specialisation in East and Southeast Asia: Lessons from China’s Exceptional Development,” In Ing, L. Y., Hanson, G. H and S. M. Indrawati. (eds.)
The Indonesian Economy: Trade and Industrial Policies . London: Routledge. pp. 30-74. - Hanson, G. H., Lind, N. and M.-A. Muendler. 2015. The Dynamics of Comparative Advantage. NBER Working Paper, no. 21753.
-
Hsieh, C.-T. 2002. “What Explains the Industrial Revolution in East Asia? Evidence from the Factor Markets,”
American Economic Review , vol. 92, no. 3, pp. 502-526.
-
Hsieh, C.-T. and Z. M. Song. 2015. “Grasp the Large, Let Go of the Small: The Transformation of the State Sector in China,”
Brookings Papers on Economic Activity , vol. 2015, no. 1, pp. 295-366.
- Jaworski, T., Kitchens, C. and S. Nigai. 2020. Highways and Globalization. NBER Working Paper, no. 27938.
-
Kee, H. L. and H. Tang. 2016. “Domestic Value Added in Exports: Theory and Firm Evidence from China,”
American Economic Review , vol. 106, no. 6, pp. 1402-1436.
-
Khandelwal, A. K., Schott, P. K. and S.-J. Wei. 2013. “Trade Liberalization and Embedded Institutional Reform: Evidence from Chinese Exporters,”
American Economic Review , vol. 103, no. 6, pp. 2169-2195.
-
Koopman, R., Wang, Z. and S.-J. Wei. 2012. “Estimating Domestic Content in Exports When Processing Trade Is Pervasive,”
Journal of Development Economics , vol. 99, no. 1, pp. 178-189.
-
Lardy, N. R. 1992.
Foreign trade and economic reform in China, 1978-1990 , Cambridge: Cambridge University Press. -
Lardy, N. R. 2019.
The State Strikes Back: The End of Economic Reform in China? Washington DC: Peterson Institute for International Economics. -
Levinson, M. 2016.
The Box: How the Shipping Container Made the World Smaller and the World Economy Bigger . Princeton: Princeton University Press. -
Li, H., Li, L. Wu, B. and Y. Xiong. 2012. “The End of Cheap Chinese Labor,”
Journal of Economic Perspectives , vol. 26, no. 4, pp. 57-74.
- Liu, C. and X. Ma. 2020. China’s Export Surge and the New Margins of Trade. MPRA paper, no. 103970. RePEc.
-
Long, C. and X. Zhang. 2012. “Patterns of China’s Industrialization: Concentration, Specialization, and Clustering,”
China Economic Review , vol. 23, no. 3, pp. 593-612.
-
Lu, Y. and L. Yu. 2015. “Trade Liberalization and Markup Dispersion: Evidence from China’s WTO Accession,”
American Economic Journal: Applied Economics , vol. 7, no. 4, pp. 221-253.
- Ma, X. 2020. “College Expansion, Trade, and Innovation: Evidence from China,” Working Paper, UC San Diego.
-
Michaels, G. 2008. “The Effect of Trade on the Demand for Skill: Evidence from the Interstate Highway System,”
Review of Economics and Statistics , vol. 90, no. 4, pp. 683-701.
-
Naughton, B. 2007.
The Chinese Economy: Transitions and Growth , MIT Press. -
Naughton, B. 2016. “Inside and outside: The modernized hierarchy that runs China,”
Journal of Comparative Economics , vol. 44, no. 2, pp. 404-415. -
Pierce, J. R. and P. K. Schott. 2016. “The Surprisingly Swift Decline of US Manufacturing Employment,”
American Economic Review , vol. 106, no. 7, pp. 1632-1662.
-
Song, Z., Storesletten, K. and F. Zilibotti. 2011. “Growing Like China,”
American Economic Review , vol. 101, no. 1, pp. 196-233.
-
Vogel, E. F. 2011.
Deng Xiaoping and the Transformation of China . Cambridge, MA: Belknap Press of Harvard University Press. -
Wade, R. 2004.
Governing the Market: Economic Theory and the Role of Government in East Asian Industrialization . Princeton, Oxford: Princeton University Press. -
Yu, M. 2015. “Processing Trade, Tariff Reductions and Firm Productivity: Evidence from Chinese Firms,”
Economic Journal , vol. 125, no. 585, pp. 943-988.
-
Zheng, S., Sun, C., Qi, Y. and M. E. Kahn. 2014. “The Evolving Geography of China’s Industrial Production: Implications for Pollution Dynamics and Urban Quality of Life,”
Journal of Economic Surveys , vol. 28, no. 4, pp. 709-724.