

- EAER>
- Journal Archive>
- Contents>
- articleView
Contents
Citation
Article View
East Asian Economic Review Vol. 25, No. 2, 2021. pp. 125-150.
DOI https://dx.doi.org/10.11644/KIEP.EAER.2021.25.2.393
Number of citation : 4View
283
Download
176
The Motivating Role of Sentiment in ESG Performance: Evidence from Japanese Companies
|
|
Graduate School of Humanities and Social Sciences, Hiroshima University |
|---|---|
|
|
Graduate School of Humanities and Social Sciences, Hiroshima University |

Abstract
The paper investigates investor sentiment’s role in boosting Japanese companies to enhance their environmental, social, and corporate governance (ESG) performance. Using ESG scores of 367 firms between 2005 and 2019 from the ASSET4 database, we find that negative sentiment in the previous year, both firm and market level, can be a stimulation for the company’s commitments to its ESG activities next year. Notably, the moderating effect of the business sector and economic cycle on the sentiment-ESG inference are detected in our study differentiating between corporate and market sentiment, which have never been reported before. In detail, we discover that the impact of firm-specific sentiment is less pronounced for high-sensitive ESG firms. On the other hand, the driving force of market sentiment on corporate social behaviors weakens when economic recessions happen. Our results are robust after controlling for potential endogeneity issues and using alternative proxies for market sentiment.
JEL Classification: G30, G40, M14
Keywords
Firm-specific and Market Sentiment, Corporate Social Responsibility, ESG Performance, Business Sector, Economic Cycle
I. Introduction
Corporate social responsibility (CSR) is a self-regulating business practice that integrates sustainable development into a company’s business model. It aims to increase the firm’s long-term profits or survival by constructing positive public relations and high ethical standards to reduce the business and legal risk and build shareholder trust (Han et al., 2016). A company’s CSR strategy relates to its environmental, social, and corporate governance (ESG) activities.
Recently, CSR has gained considerable attention, not only from firm managers but also from academic researchers. Among related topics, many studies focus on the driving factors behind the intention of companies’ CSR practices, which are proved mostly from stakeholder-related benefits (Lichtenstein et al., 2004; Choi and Wang, 2009 and Costas and Karreman, 2013). Sen et al. (2006) detect that CSR activities can increase CSR associations, attitudes, and identification as well as stakeholders’ intent to commit personal resources, such as money or labor, to the company’s benefit.
Compared to other stakeholder groups, the impact of investors and financial markets on CSR behavior is rarely explored. Cheong et al. (2017) are the first to testify the influence investors have in driving CSR activities. They find negative sentiment in the prior year motivates firms to improve their CSR performance in the next year. However, their study does not explore the inference between sentiment and governance pillar, which is also vital in a firm’s CSR strategy. The potential factors that can affect sentiment-ESG nexus are also neglected. Our research which concentrates on Japanese companies, is carried out to fill these gaps.
In the last couple of years, by applying numerous initiatives to align the financial system with sustainability, Japan has now turned from a country with low ESG engagement rates into one of the most rapidly growing markets for responsible investment. Japan also claims a leadership role in international climate and environmental politics as the third-largest contributor of funds to the United Nations (UN) and the second-largest to the United Nations Development Program (UNDP), as outlined in Schumacher et al. (2020). However, Japanese corporations’ effectiveness in CSR activities is still moderate as their average ESG score rose from 30.2 in 2005 to 50.3 in 2019. Consequently, it is crucial to disclosure the relationship between investors and ESG practices in Japan, which can be utilized as a potential motivation for enhancing Japanese firms’ CSR activities.
Furthermore, two additional analyses are conducted to broaden our findings on the sentiment-ESG relationship. First, we compare the effect of sentiment on ESG activities between high and low-sensitive companies. This idea originated from McWilliams et al. (2006), who argue that CSR's stakeholder expectancy can fundamentally diverse across nations, regions, and business lines. Secondly, Garcia et al. (2017) assume that different economic development stages can lead to different CSR perceptions in companies and society. Therefore, we raise a doubt whether macroeconomic conditions moderate the impact of sentiment on ESG performance.
Generally, our study makes several contributions to contemporary literature. To begin with, by analyzing the sentiment effect on escalating companies’ ESG performance, using aggregate as well as three-component scores, we provide more evidence about the sentiment-ESG relationship, which has been investigated limitedly. Additionally, our paper, utilizing different proxies for sentiment and ESG scores, can act as a robustness check for previous findings. Next, we demonstrate that the operating industries and economic cycles play a crucial role in the sentiment-ESG inference. This research primarily states that the moderating impact of business sector and condition is dissimilar between firm and market-level sentiment. Other studies mention how firms’ CSR behaviors may vary across industries or how enterprises change their CSR strategies to cope with different phases of the economic cycle. Nevertheless, none of them explore the impact of these two factors on the correlation between investor sentiment and ESG activities.
The rest of the paper is organized as follows. In section II, we review previous related studies and develop our research hypotheses. The sample selection, variable measurements, and analyzed methods employed in our study are described in the next section. Section IV presents and discusses the empirical results. The last section sums up our findings.
II. Literature Reviews and Hypothesis Development
Stakeholder and legitimacy theory are often grounded as the motivations that inspire companies to commit their CSR actions. Stakeholder theory argues that a firm should create value for all stakeholders, such as customers, suppliers, employees, investors, and communities, not just its shareholders. Meanwhile, legitimacy theory advocates corporations act in a socially responsible manner to legitimize their stakeholder groups’ behaviors. Based on these two theories, prior studies investigate and reveal the stakeholders-related benefits that drive CSR implementation.
Choi and Wang (2009) examine the effect of a firm's relations with its non-financial stakeholders, including its employees, suppliers, customers, and communities. They claim that good stakeholder relations enable a firm with superior financial performance to sustain its competitive advantage for a longer time and help poorly performing firms recover from disadvantageous positions more quickly. Similar conclusions are drawn out from the studies of Madueño et al. (2016) and Barić (2017). Meanwhile, Cheng et al. (2014) find that firms with better ESG performance face significantly lower capital constraints by enhancing stakeholder engagement and increasing transparency.
Considering more specific aspects, Lichtenstein et al. (2004) provide evidence that perceived CSR affects not only customer purchase behavior through customer-corporate identification but also customer donations to corporate-supported nonprofit organizations. Costas and Karreman (2013) demonstrate how CSR works as a form of control that ties employees’ aspirational identities and ethical conscience to the organization, while Hur et al. (2018) suggest that employees’ perceptions of CSR positively relate to employee creativity.
However, there is unclear evidence that the corporate inspiration to maintain a good relationship with their stakeholders through their CSR activities is internal, i.e., the managers feel necessary to do so, or external, i.e., they are pressed by outsiders. Therefore, in case this motivation is extrinsic, which means that external stakeholders can force companies to enhance their corporate social performance, Cheong et al. (2017) argue that financial markets and investors can do that too. They claim that market participants tend to steer transparent equity investments, preferring to hold safer investments as the overall market outlook turns negative. Simultaneously, CSR activities are considered a type of insurance, as stated by Peloza (2006), which indicates that companies with a more substantial social and environmental commitment might be a safer investment place (Naughton et al., 2019). In other words, negative investor sentiment toward a company could motivate to improve its CSR performance to enhance the firm’s public image and attract investment from investors. Based on this speculation, we initiate our first hypothesis:
Additionally, complying with its industry type and operating line, each company is expected to meet different CSR requirements, as Lin et al. (2015) claim. They argue that being in environmentally sensitive or non-sensitive industries is exceptionally vital since firms in industries that might have a more significant effect on the environment suffer more pressure in environmental issues than others. Thus, sensitive firms tend to disclose environmental information more frequently and have better performance than non-sensitive sectors.
Previously, Richardson and Welker (2001) find that sensitive Canadian companies disclose their socio-environmental practices more consistently as a way of legitimizing their operations. The hypotheses tested by Knox et al. (2005) imply that the more prominent FTSE companies, particularly extraction companies and telecoms, are more adept at identifying and prioritizing their stakeholders and linking CSR programs to business and social outcomes. Kilian and Hennigs (2014) also argue that companies in high-controversial industry sectors are more inclined to engage in CSR-related communication than companies in less-controversial industry sectors.
On the contrary, the evidence from Portuguese firms of Branco and Rodrigues (2008) indicates that environmental visibility is not a factor that explains the differences in environmental disclosure among companies. More recently, Garcia et al. (2017) examine 365 companies from Brazil, Russia, India, China, and South Africa and detect that companies in sensitive industries present superior environmental performance, even when controlling their size and country. However, this affirmation does not hold for social, corporate governance, and overall ESG performance.
Though mixed, these results reflect the potential influence of the operating industry on firms’ ESG performance. We propose that this factor might lead to different CSR reactions to sentiment too. Thus, our second hypothesis is:
Some researchers have also questioned the macroeconomic condition's role in a company’s CSR behavior, based on two main streams. The first stream, derives from the financial constraints theory, suggests that low profitable companies might lack the resources to spend on socially responsible activities. Hence, firms whose financial performance is weak tend to reduce their ESG commitments than firms whose financial performance is stable (Waddock and Graves, 1997 and Orlitzky et al., 2003). According to this viewpoint, Campbell (2007) argues that an unhealthy economic climate, for example, high inflation, low productivity growth, and weak consumer confidence, makes it challenging for firms to maintain a healthy profit in the near term. Thus, these economic conditions decrease the possibility that corporations will act in socially responsible ways.
Conversely, another stream claims that the association between economic conditions and a firm’s CSR strategies is not always identical. Navickas and Kontautiene (2013) highlight that enterprises can benefit from CSR development, even in economic downturn times. CSR implementation helps enterprises build a good reputation, motivate employees, make a better market position, and minimize risk. Consequently, the development of CSR can help firms to survive better during crisis times. This opinion might explain the findings of Strugatch (2011) and Krajnakova et al. (2018).
Strugatch (2011) states that during the financial crisis 2007-2008, companies shed workers, cut back on marketing, slim down pension commitments, and in general, slash billions from their operating budgets. Nevertheless, CSR programs have primarily escaped the budget cutter’s ax. Apart from that, the rising inflation, growing unemployment rate, and lost consumer confidence also result in a greater emphasis on companies' social and economical solutions in the Baltic countries and Slovakia in the testimony of Krajnakova et al. (2018).
Since the economic cycle exposes a substantial impact on companies’ CSR commitments, we expect the association between sentiment and ESG performance is diverse in different economic stages. Therefore, our third hypothesis is supposed as the following:
III. Data, Variables, and Methodology
1. Data
Our study applies several criteria to select the sample. First, we only include Japanese firms whose financial, environmental, social, and corporate governance information is available on the Thomson Reuters’ Datastream and ASSET4 database between 2005 and 2019. Second, financial companies are removed since they have unique characteristics and should be separately investigated (Xu et al., 2014 and Shahzad et al., 2019). Finally, following Vieira et al. (2019), we remove firms without five years of data during the research period. These filters result in a final sample of 367 companies with 5505 firm-year observations.
2. Variables
(1) Dependent variables
To determine a company’s performance relating to its corporate social activities, we use the ESG scores retrieved from the Thomson Reuters’ASSET4 database. ESG series are calculated based on the firms’ publicly reported data, such as corporate website, annual reports, CSR reports, stock exchange filling, and news sources. Overall ESG score is a weighted average index of the underlying ten categories classified into three pillars: environmental, social, and corporate governance. In detail, the environmental index (
(2) Independent variables
Following Baker et al. (2012) and Huang et al. (2015), we employ principal component analysis (PCA) to establish a comprehensive sentiment index, based on three underlying proxies, namely consumer confidence index (
First, we form the first stage index by estimating the first principal component of
Regarding firm-specific sentiment (
Moreover, Anusakumar et al. (2017) suggest that investor sentiment's common association with the overall stock markets should be eliminated to guarantee the empirical results are driven purely by the sentiment effect. Therefore, we regress both firm and market-level sentiment indexes on the annual growth rates of four macroeconomic variables, including gross domestic product (
(3) Control variables
In harmony with other studies (Wu, 2006; Jo and Harjoto, 2011; Sun et al., 2018 and Fu et al., 2020), we include several control variables that potentially affect the relationship between investor sentiment and ESG performance. These are firm size (
The summary of all variables employed in our research is described in Table 1.
3. Methodology
Before executing our empirical models, we winsorize all variables at the 1% level to reduce outliers' impact (Fosu et al., 2016). The summary statistics and correlation matrix between these variables are presented in Table 2 and Table 3.
As shown in Table 2, among three ESG indexes,
On the other hand, two sentiment proxies,
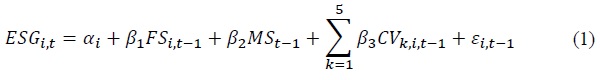
The underlying model to examine the potential impact of sentiment on ESG performance is:
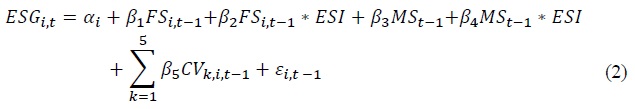
Furthermore, we discover the business line’s moderating role in the sentiment-ESG relationship by dividing our sample into two groups and comparing their regression outcomes. In line with Richardson and Welker (2001) and Garcia et al. (2017), the first group comprises high-sensitive ESG companies operating in the Basic Materials, Energy, and Utilities sectors. The remaining firms belong to the low-sensitive group. We also create a dummy variable, denoted as
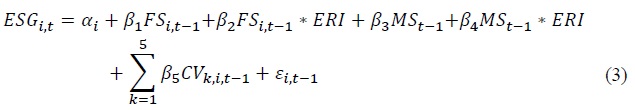
Finally, we investigate whether the sentiment effect on ESG performance is the same during economic recession periods by employing Equation (3):
In which
1)VIF results range from 1 to 2 for independent and control variables in all regressions.
IV. Results
1. Sentiment and ESG Performance
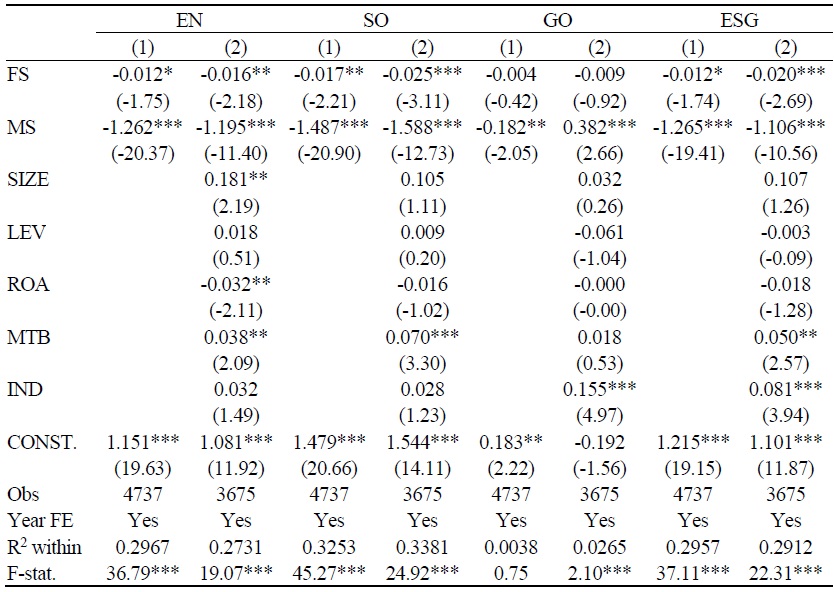
Table 4 reveals the sentiment impact on firms’ ESG activities. As shown in the seventh column, the market sentiment coefficient is -3.539 and significant at the 1% level, implying the strong negative relationship between market sentiment and overall ESG performance. The same conclusion can be drawn from the correlation between firm-specific sentiment and ESG, although its influence is weaker than the market one. Our findings still hold after some firm characteristics are included as control variables.
A similar pattern can be seen in three ESG components, except the corporate governance aspect.
Overall, our estimated outcomes suggest that Japanese companies tend to be more active in their CSR strategies when either the market or firm’s investors expose a negative outlook. Notably, they pay more attention to environmental and social commitments that might enhance their public images and gain market participants’ trust. Besides, enterprises’ efforts to enhance their corporate social achievements are likely to satisfy the public than their investors. These findings support the studies of Cheong et al. (2017) and Naughton et al. (2019) about the driving role of sentiment on CSR activities. However, while Cheong et al. (2017) affirm that CSR scores are strongly affected by firm-level sentiment rather than the market one, the reverse observation is depicted in our research.
Our first analysis consistently proves the adverse inference between sentiment and ESG performance. Further, we check whether these results are robust by modifying the estimation method and sentiment measurement. One significant problem that may influence the estimators of panel data methodology is the potential endogeneity issues. Consequently, we re-estimate Equation (1) by applying the 2-step Generalized Method of Moments (GMM) to suppress any endogeneity problems. The results are presented in Table 5.
It can be seen from Table 5 that the signs of sentiment coefficients, both firm and market-level, remain unchanged for overall ESG as well as three pillars scores. Besides, we observe that the magnitude of firm-specific sentiment is approximately to those reported in Table 4 for environmental and social performance. In contrast, those figures increase considerably for corporate governance and aggregate ESG ones. Remarkably, unlike the overall ESG score, the estimators of firm-specific sentiment for environmental and social scores are no longer statistically significant. Meanwhile, the relationship between corporate sentiment and governance performance changes from insignificant to significant.
Regarding market sentiment, the negative correlation between this factor and ESG achievement still holds significantly, despite the noteworthy decline in the estimated coefficients. This state can be illustrated briefly by the environmental pillar, where its coefficient drops from -3.343 (t-stat. = -11.40) in Table 4 to -0.090 (t-stat. = -2.87) in Table 5.
Besides the endogeneity issue, one may raise questions about our market sentiment's validity in capturing sentiment effect compared to other single factors since it originated from the PCA method (Seok et al., 2019). Therefore, we exhibit the results of Equation (1) when component sentiment proxies are used instead of the composite index. The estimators with
To sum up, after controlling for the potential of endogeneity problems and using alternative sentiment measures, the robustness checks confirm our earlier findings about the negative impact of sentiment on subsequent ESG performance, though not as powerful as before.
2. Sentiment and ESG Performance – The Impact of the Business Sector
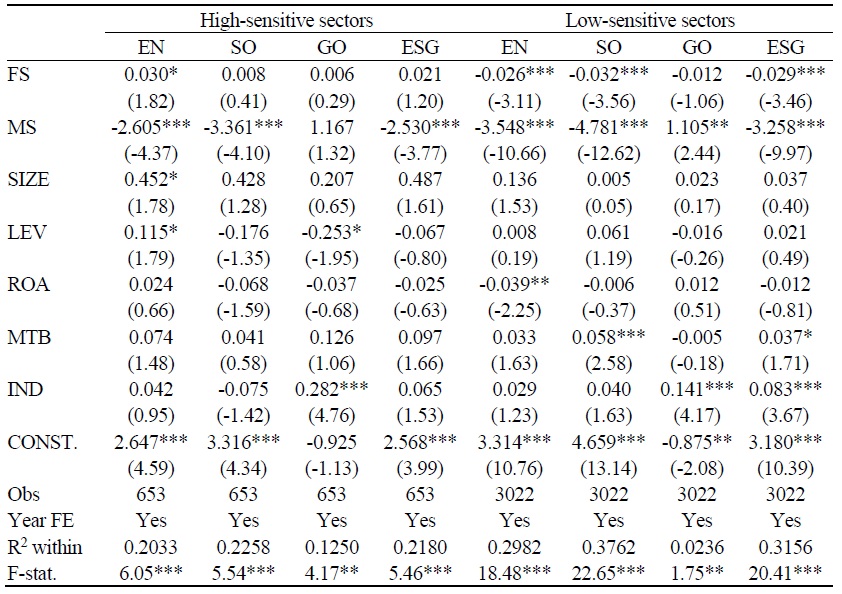
In this part, we consider the business sector's moderating effect on the sentiment-ESG inference by splitting our sample into high and low-sensitive groups. High-sensitive firms are categorized as those active in the Basic Materials, Energy, and Utilities lines. The regression results for the two groups of companies are displayed in Table 7.
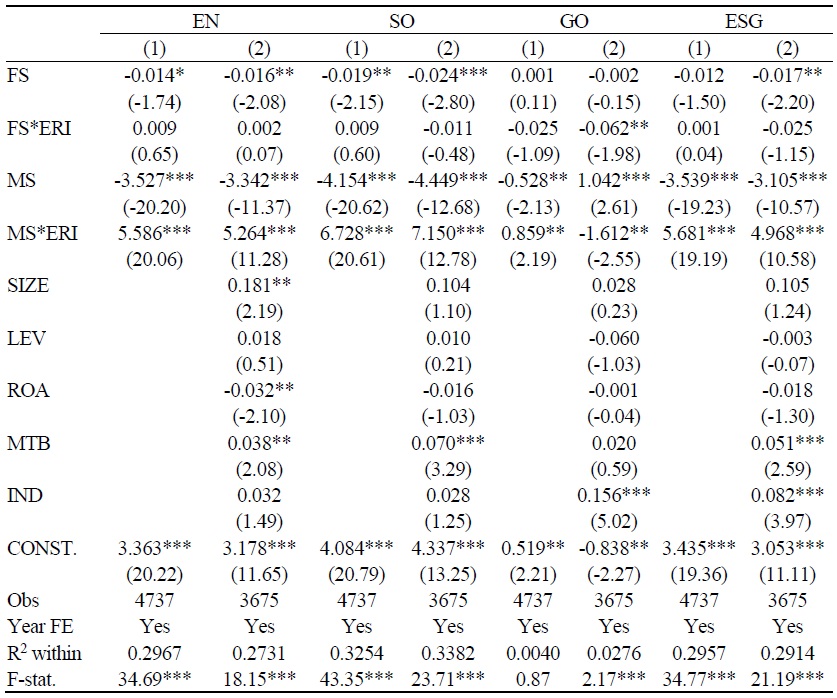
We can see from Table 7 that the sentiment impact on future ESG achievement is more substantial and significant in low-sensitive industries. In addition to that, the diversifications in firm-specific sentiment between the two groups are more noticeable. While the firm sentiment-ESG nexus in high-sensitive business lines are positive and almost insignificant, those of remaining industries are negative significantly. This remark can be seen clearly in the case of social performance where the coefficients of high and low-sensitive firms are 0.008 (t-stat. = 0.41) and -0.032 (t-stat. = -3.56), respectively.
Furthermore, the above observations are certified when we include the interaction variables between sentiment and business sector into the estimation models.
3. Sentiment and ESG Performance – The Impact of the Business Cycle
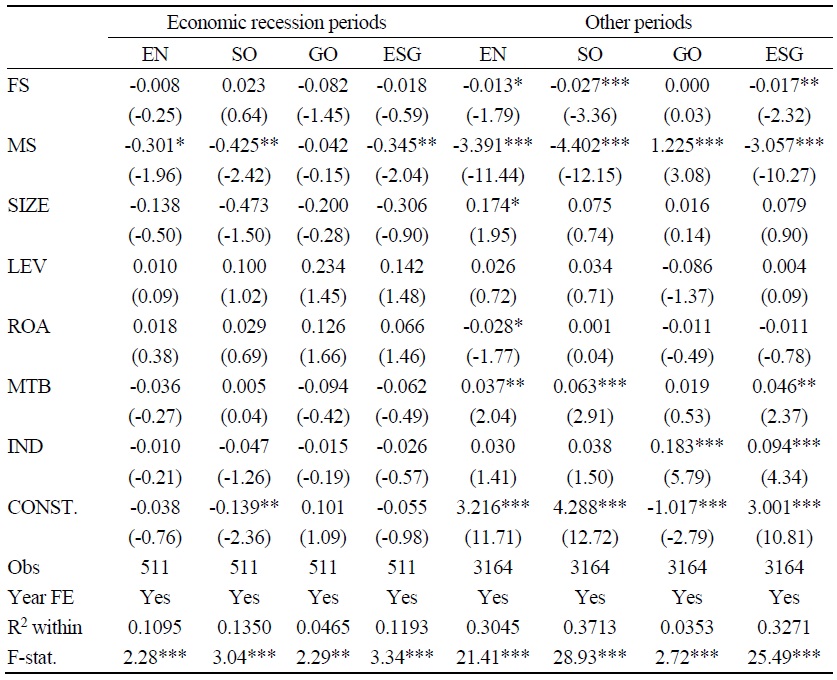
This subsection is devoted to examine the economic phases’ role in the sentiment-ESG relationship. To do so, we divide our data into two sub-periods: economic recession and others. During our sample time from 2005 to 2019, we consider 2008, 2009, and 2011 as downturn years as their annual GDP growth rates are below zero. Table 9 presents the estimation results of Equation (1) for these two periods.
Concerning firm-specific sentiment, although the coefficients’ magnitude for both groups is not too disparate, only those of non-contraction periods are significant statistically, with governance score being the exception. These coefficients’ sign for social and governance aspects also contradict during recession years and others. Take social performance as an example. The sentiment coefficient for downturn periods is 0.023 and insignificant, whereas this figure for other times is -0.027 and significant at the 1% level.
On the contrary, variations between market sentiment coefficients for two subsamples are mostly observed in their magnitude. In detail, the impact of market sentiment on ESG performance over non-recession periods is much stronger since their estimators are approximately ten times larger than those of recession periods. To illustration, the coefficient for aggregate ESG score is -0.345 (t-stat. = -2.04) in depression years and -3.057 (t-stat. = -10.27) for others.
In the end, we expand our analysis models by adding a dummy variable for economic recessions, symbolized as
2)The results for
V. Conclusion
Using data from 367 Japanese firms between 2005 and 2019, we examine the relationship between investor sentiment, both firm and market level, and ESG performance. In detail, cumulative monthly stock returns of the prior six months are employed as our firm-specific sentiment. Simultaneously, market sentiment is the first principle component of
In addition to that, following other research about firms’ CSR activities, we investigate the variations in the sentiment-ESG relationship across business lines. By splitting our sample into high and low-sensitive companies, we detect that the motivating force of firm-specific sentiment is likely to less affirm in high-sensitive industries. However, the differences between the two groups are only significant in the environmental and overall ESG performance. On the contrary, there are not many divergences in the results of market sentiment among sectors. Eventually, the sentiment impact on future ESG activities during the recession periods is explored to uncover the economic cycle’s potential influence on this relationship. We find that economic downturns tend to diminish the sentiment effect, especially at the market level. Our detections, generally, indicate that either in high-sensitive industries or depression periods, the pessimistic outlook of shareholders and outside investors is less critical in boosting companies’ CSR activities.
Overall, not only complement limited research about the association between sentiment and CSR strategy, to the best of our knowledge, this paper is also the first that reveals the moderating impact of the business sector and condition on this inference, which is proved to vary between corporate and market sentiment. While the differences across industries have a more significant influence on firm-specific sentiment, market sentiment tends to be suffered more from the fluctuations in the economic cycle. Our findings provide a promising channel, i.e., investors’ power that the government and CSR advocates can utilize to orientate companies to act responsibly.
The main drawback of this study is the subjectivity and inconsistency of ESG data. To begin with, since each CSR rating agency has its own CSR perspectives, it might measure CSR performance differently. Using ESG proxies deriving from different rating agencies might result in different conclusions. Secondly, the assessment process of CSR effectiveness is highly subjective. Even two analysts from the same rating provider might evaluate the ESG performance of a company differently. Finally, companies that are not interested in ESG assessments may have low or zero scores, while companies that are interested in ESG actively communicating with evaluators receive high scores. This limitation is commonly shared among CSR studies. Besides that, our paper’s results should be used carefully in generalizing to other countries since Japanese companies may not fully represent all the characteristics of firms in different growth stages and, more importantly, in different economic cycles. These issues need to be addressed in future work.
Tables & Figures
Table 1.
Description of Variables
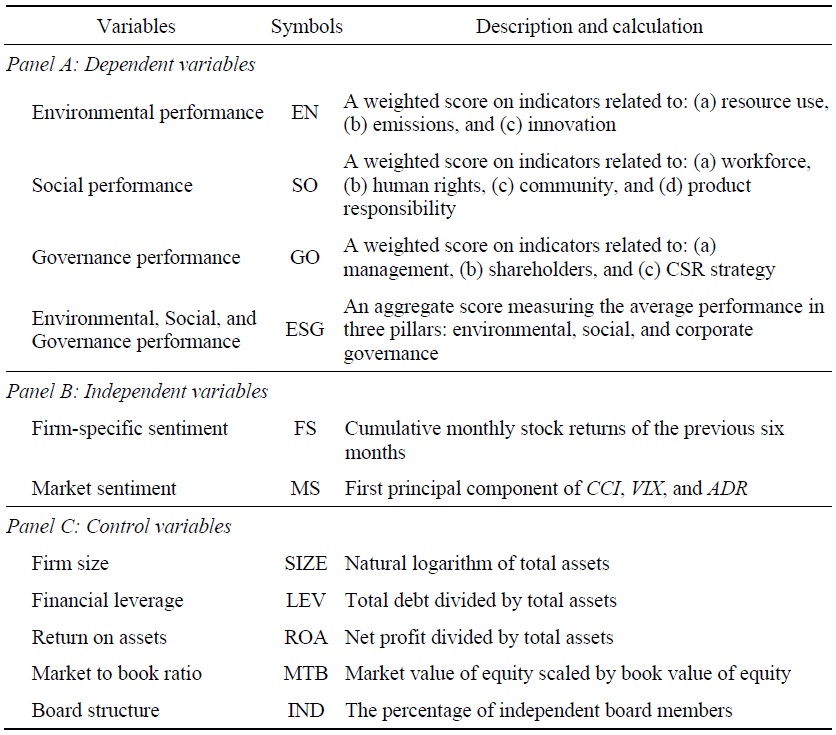
Note: The table provides a straightforward interpretation of all variables used in the paper.
Table 2.
Descriptive Statistics
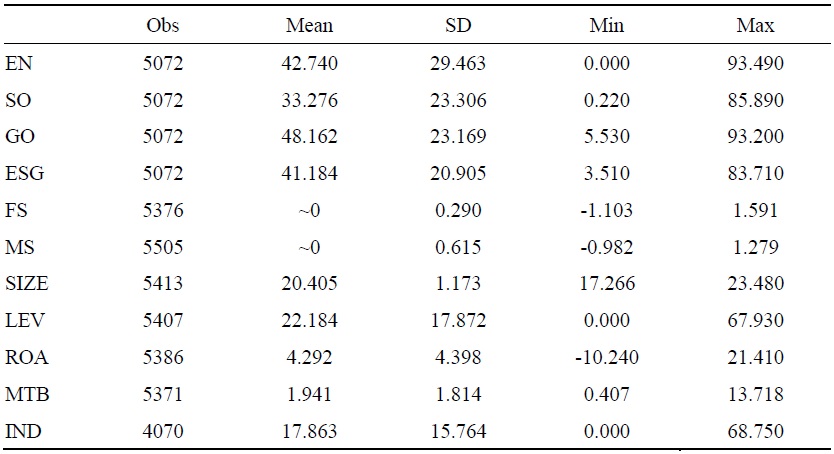
Notes: The table summarizes the statistical description of the data. The sample comprises 367 non-financial Japanese firms during the period from 2005 to 2019. Details of all variables are outlined in
Table 3.
Correlation Matrix
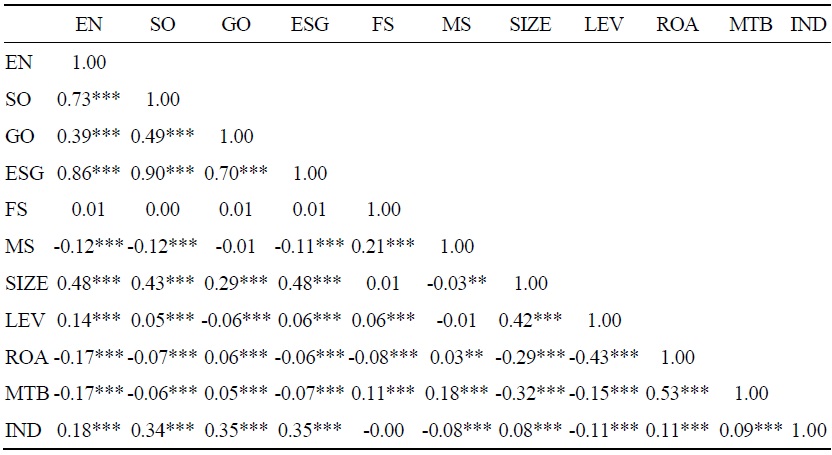
Notes: The table presents the correlation matrix of the data. The sample comprises 367 non-financial Japanese firms during the period from 2005 to 2019. Details of all variables are outlined in
Table 4.
Sentiment and ESG Performance
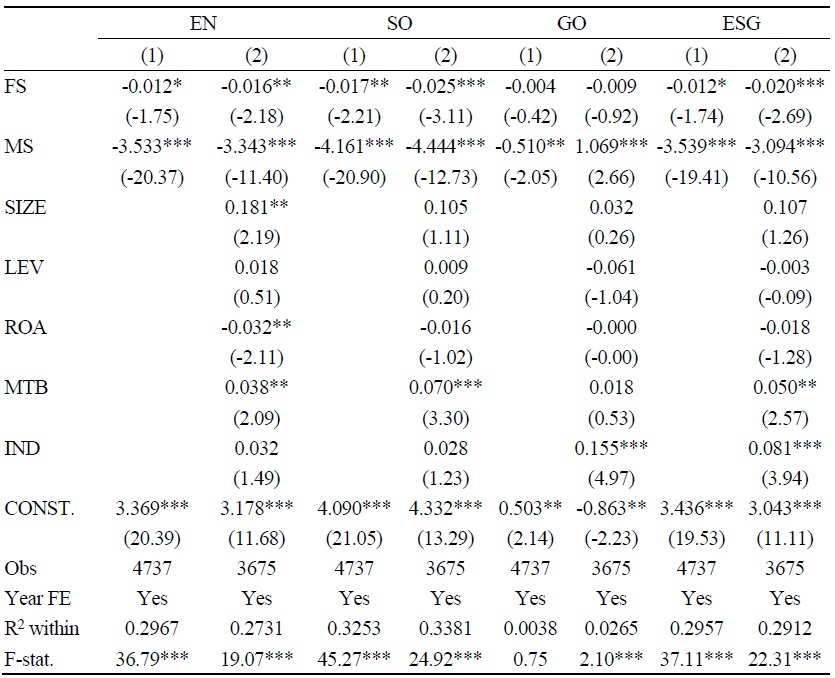
Notes: The table reports the results for the panel fixed-effect regressions with time dummies of Equation (1). Firm-cluster t-statistics are in parentheses. The sample comprises 367 non-financial Japanese firms during the period from 2005 to 2019. Details of all variables are outlined in
Table 5.
2-step GMM
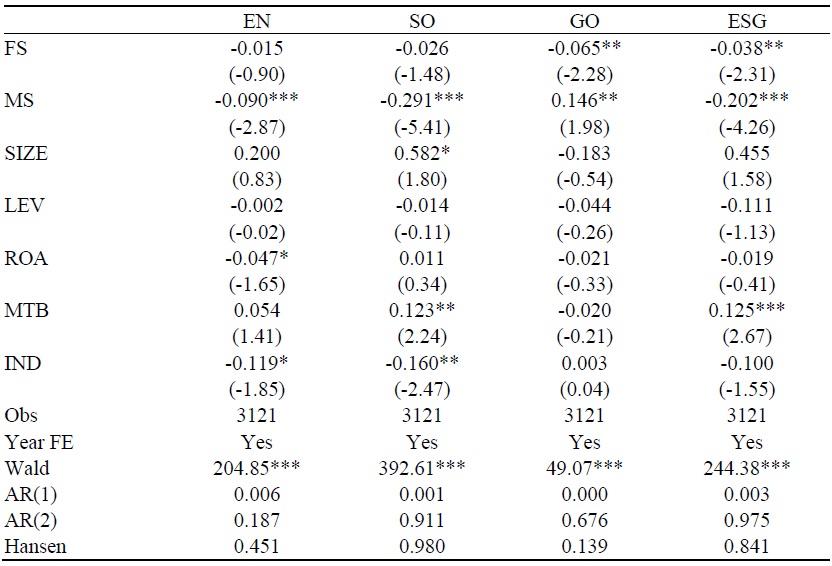
Notes: The table reports the results for 2-step GMM models with time dummies of Equation (1). The instruments are the lags of independent variables, while year dummies are considered as strictly exogenous variables. Firm-cluster t-statistics are in parentheses. The sample comprises 367 non-financial Japanese firms during the period from 2005 to 2019. Details of all variables are outlined in
Table 6.
Alternative Market Sentiment –
Notes: The table reports the results for the panel fixed-effect regressions of Equation (1) as
Table 7.
High-sensitive vs. Low-sensitive Sectors
Notes: The table reports the panel fixed-effect results of Equation (1) for high and low-sensitive groups. Firm-cluster t-statistics are in parentheses. The sample comprises 367 non-financial Japanese firms during the period from 2005 to 2019. Details of all variables are outlined in
Table 8.
Impact of the Business Sector on the Sentiment-ESG Relationship
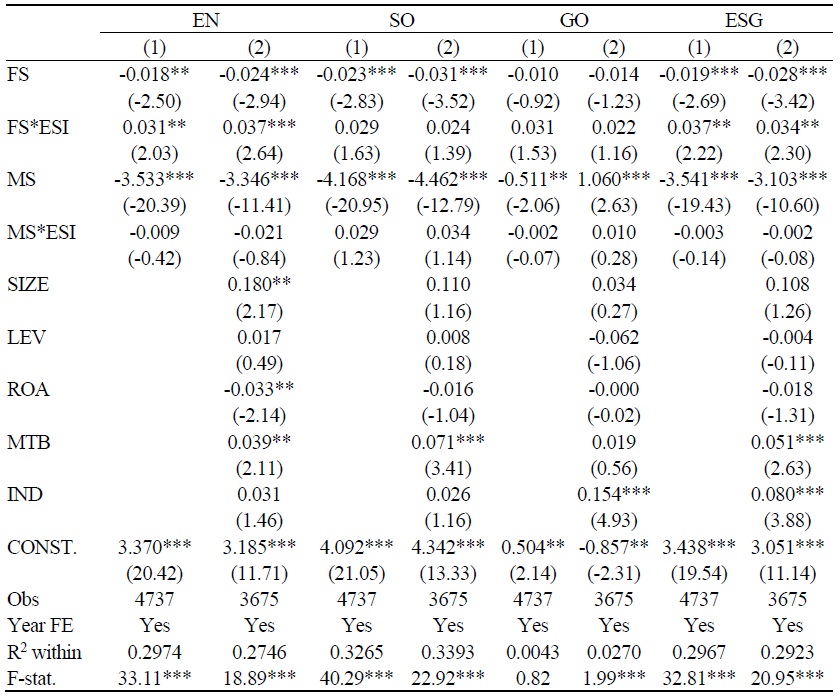
Notes: The table reports the results for the panel fixed-effect regressions with time dummies of Equation (2). Firm-cluster t-statistics are in parentheses. The sample comprises 367 non-financial Japanese firms during the period from 2005 to 2019.
Table 9.
Economic Recession vs. Other Periods
Notes: The table reports the panel fixed-effect results of Equation (1) when data are split into two sub-periods: economic recession and others. Firm-cluster t-statistics are in parentheses. The sample comprises 367 non-financial Japanese firms during the period from 2005 to 2019. Details of all variables are outlined in
Table 10.
Impact of the Economic Cycle on the Sentiment-ESG Relationship
Notes: The table reports the results for the panel fixed-effect regressions with time dummies of Equation (3). Firm-cluster t-statistics are in parentheses. The sample comprises 367 non-financial Japanese firms during the period from 2005 to 2019.
References
-
Anusakumar, S. V., Ali, R. and H. C. Wooi. 2017. “The Effect of Investor Sentiment on Stock Returns: Insight from Emerging Asian Markets,”
Asian Academy of Management Journal of Accounting & Finance , vol. 13, no. 1, pp. 159-178. -
Baker, M., Wurgler, J. and Y. Yuan. 2012. “Global, Local, and Contagious Investor Sentiment,”
Journal of Financial Economics , vol. 104, no. 2, pp. 272-287.
-
Barić, A. 2017. “Corporate Social Responsibility and Stakeholders: Review of the Last Decade (2006-2015),”
Business Systems Research Journal , vol. 8, no. 1, pp. 133-146.
-
Branco, M. C. and L. L. Rodrigues. 2008. “Factors Influencing Social Responsibility Disclosure by Portuguese Companies,”
Journal of Business Ethics , vol. 83, no. 4, pp. 685-701.
-
Campbell, J. L. 2007. “Why Would Corporations Behave in Socially Responsible Ways? An Institutional Theory of Corporate Social Responsibility,”
Academy of Management Review , vol. 32, no. 3, pp. 946-967.
-
Cheng, B., Ioannou, I. and G. Serafeim. 2014. “Corporate Social Responsibility and Access to Finance,”
Strategic Management Journal , vol. 35, no. 1, pp. 1-23.
-
Cheong, C. W., Sinnakkannu, J. and S. Ramasamy. 2017. “Reactive or Proactive? Investor Sentiment as a Driver of Corporate Social Responsibility,”
Research in International Business and Finance , vol. 42, pp. 572-582.
-
Choi, J. and H. Wang. 2009. “Stakeholder Relations and the Persistence of Corporate Financial Performance,”
Strategic Management Journal , vol. 30, no. 8, pp. 895-907.
-
Costas, J. and D. Kärreman. 2013. “Conscience as Control–Managing Employees through CSR,”
Organization , vol. 20, no. 3, pp. 394-415.
-
Dash, S. R. and D. Maitra. 2018. “Does Sentiment Matter for Stock Returns? Evidence from Indian Stock Market Using Wavelet Approach,”
Finance Research Letters , vol. 26, pp. 32-39.
-
Fosu, S., Danso, A., Ahmad, W. and W. Coffie. 2016. “Information Asymmetry, Leverage and Firm Value: Do Crisis and Growth Matter?”
International Review of Financial Analysis , vol. 46, pp. 140-150.
-
Fu, J., Wu, X., Liu, Y. and R. Chen. 2020. “Firm-specific Investor Sentiment and Stock Price Crash Risk,”
Finance Research Letters , vol. 38. -
Garcia, A. S., Mendes-Da-Silva, W. and R. J. Orsato. 2017. “Sensitive Industries Produce Better ESG Performance: Evidence from Emerging Markets,”
Journal of Cleaner Production , vol. 150, pp. 135-147.
-
Habib, A. and M. M. Hasan. 2017. “Firm Life Cycle, Corporate Risk-taking and Investor Sentiment,”
Accounting & Finance , vol. 57, no. 2, pp. 465-497.
-
Han, J.-J., Kim, H. J. and J. Yu. 2016. “Empirical Study on Relationship between Corporate Social Responsibility and Financial Performance in Korea,”
Asian Journal of Sustainability and Social Responsibility , vol. 1, no. 1, pp. 61-76.
-
Hua, G., Zhou, S., Zhang, S. and J. Wang. 2020. “Industry Policy, Investor Sentiment, and Cross-industry Capital Flow: Evidence from Chinese Listed Companies’ Cross-industry M&As,”
Research in International Business and Finance , vol. 53.
-
Huang, D., Jiang, F., Tu, J. and G. Zhou. 2015. “Investor Sentiment Aligned: A Powerful Predictor of Stock Returns,”
Review of Financial Studies , vol. 28, no. 3, pp. 791-837.
-
Hur, W.-M., Moon, T.-W. and S.-H. Ko. 2018. “How Employees’ Perceptions of CSR Increase Employee Creativity: Mediating Mechanisms of Compassion at Work and Intrinsic Motivation,”
Journal of Business Ethics , vol. 153, no. 3, pp. 629-644.
-
Ioannou, I. and G. Serafeim. 2012. “What Drives Corporate Social Performance? The Role of Nation-level Institutions,”
Journal of International Business Studies , vol. 43, no. 9, pp. 834-864.
-
Jo, H. and M. A. Harjoto. 2011. “Corporate Governance and Firm Value: The Impact of Corporate Social Responsibility,”
Journal of Business Ethics , vol. 103, no. 3, pp. 351-383.
-
Kilian, T. and N. Hennigs. 2014. “Corporate Social Responsibility and Environmental Reporting in Controversial Industries,”
European Business Review , vol. 26, no. 1, pp. 79-101.
-
Knox, S., Maklan, S. and P. French. 2005. “Corporate Social Responsibility: Exploring Stakeholder Relationships and Programme Reporting across Leading FTSE Companies,”
Journal of Business Ethics , vol. 61, no. 1, pp. 7-28.
-
Krajnakova, E., Navickas, V. and R. Kontautiene. 2018. “Effect of Macroeconomic Business Environment on the Development of Corporate Social Responsibility in Baltic Countries and Slovakia,”
Oeconomia Copernicana , vol. 9, no. 3, pp. 477-492.
-
Lemmon, M. and E. Portniaguina. 2006. “Consumer Confidence and Asset Prices: Some Empirical Evidence,”
Review of Financial Studies , vol. 19, no. 4, pp. 1499-1529.
-
Lichtenstein, D. R., Drumwright, M. E. and B. M. Braig. 2004. “The Effect of Corporate Social Responsibility on Customer Donations to Corporate-supported Nonprofits,”
Journal of Marketing , vol. 68, no. 4, pp. 16-32.
-
Lin, C.-S., Chang, R.-Y. and V. T. Dang. 2015. “An Integrated Model to Explain How Corporate Social Responsibility Affects Corporate Financial Performance,”
Sustainability , vol. 7, no. 7, pp. 8292-8311.
-
Madueño, J. H., Jorge, M. L., Conesa, I. M. and D. Martínez-Martínez. 2016. “Relationship between Corporate Social Responsibility and Competitive Performance in Spanish SMEs: Empirical Evidence from a Stakeholders’ Perspective,”
BRQ Business Research Quarterly , vol. 19, no. 1, pp. 55-72.
-
McWilliams, A., Siegel, D. S. and P. M. Wright. 2006. “Corporate Social Responsibility: Strategic Implications,”
Journal of Management Studies , vol. 43, no. 1, pp. 1-18.
-
Naughton, J. P., Wang, C. and I. Yeung. 2019. “Investor Sentiment for Corporate Social Performance,”
The Accounting Review , vol. 94, no. 4, pp. 401-420.
-
Navickas, V. and R. Kontautiene. 2013. “The Interaction between Corporate Social Responsibility and Competitiveness during the Economic Downturn,”
Economics and Management , vol. 18, no. 1, pp. 58-67.
- Olsson, T. 2019. “Governance Reform Key to Boosting Japanese Equity Performance.” ClearBridge Investments. <https://www.clearbridge.com/perspectives/institutional/2019/japan-governance-reform-key-to-performance.html> (accessed March, 2021)
-
Orlitzky, M., Schmidt, F. L. and S. L. Rynes. 2003. “Corporate Social and Financial Performance: A Meta-analysis,”
Organization Studies , vol. 24, no. 3, pp. 403-441.
-
Peloza, J. 2006. “Using Corporate Social Responsibility as Insurance for Financial Performance,”
California Management Review , vol. 48, no. 2, pp. 52-72.
-
Polk, C. and P. Sapienza. 2009. “The Stock Market and Corporate Investment: A Test of Catering Theory,”
Review of Financial Studies , vol. 22, no. 1, pp. 187-217.
-
Richardson, A. J. and M. Welker. 2001. “Social Disclosure, Financial Disclosure and the Cost of Equity Capital,”
Accounting, Organizations and Society , vol. 26, no. 7-8, pp. 597-616.
-
Schumacher, K., Chenet, H. and U. Volz. 2020. “Sustainable Finance in Japan,”
Journal of Sustainable Finance & Investment , vol. 10, no. 2, pp. 213-246.
-
Sen, S., Bhattacharya, C. B. and D. Korschun. 2006. “The Role of Corporate Social Responsibility in Strengthening Multiple Stakeholder Relationships: A Field Experiment,”
Journal of the Academy of Marketing Science , vol. 34, no. 2, pp. 158-166.
-
Seok, S. I., Cho, H. and D. Ryu. 2019. “Firm-specific Investor Sentiment and Daily Stock Returns,”
North American Journal of Economics and Finance , vol. 50.
-
Shahzad, F., Lu, J. and Z. Fareed. 2019. “Does Firm Life Cycle Impact Corporate Risk Taking and Performance?”
Journal of Multinational Financial Management , vol. 51, pp. 23-44.
-
Smales, L. A. 2017. “The Importance of Fear: Investor Sentiment and Stock Market Returns,”
Applied Economics , vol. 49, no. 34, pp. 3395-3421.
-
Strugatch, W. 2011. “Turning Values into Valuation: Can Corporate Social Responsibility Survive Hard Times and Emerge Intact?”
Journal of Management Development , vol. 30, no. 1, pp. 44-48.
-
Sun, W., Zhao, C., Wang, Y. and C. H. Cho. 2018. “Corporate Social Responsibility Disclosure and Catering to Investor Sentiment in China,”
Management Decision , vol. 56, no. 9, pp. 1917-1935.
-
Vieira, E. S., Neves, M. E. and A. G. Dias. 2019. “Determinants of Portuguese Firms’ Financial Performance: Panel Data Evidence,”
International Journal of Productivity and Performance Management , vol. 68, no. 7, pp. 1323-1342.
-
Xu, N., Li, X., Yuan, Q. and K. C. Chan. 2014. “Excess Perks and Stock Price Crash Risk: Evidence from China,”
Journal of Corporate Finance , vol. 25, pp. 419-434.
-
Waddock, S. A. and S. B. Graves. 1997. “The Corporate Social Performance–Financial Performance Link,”
Strategic Management Journal , vol. 18, no. 4, pp. 303-319. -
Wu, M.-L. 2006. “Corporate Social Performance, Corporate Financial Performance, and Firm Size: A Meta-analysis,”
Journal of American Academy of Business , vol. 8, no.1, pp. 163-171.