

- EAER>
- Journal Archive>
- Contents>
- articleView
Contents
Citation
| No | Title |
|---|---|
| 1 | COVID-19 impacts on financial markets: Takeaways from the third wave / 2021 / Russian Journal of Economics / vol.7, no.3, pp.200 / |
| 2 | / 2022 / pp.7 / |
| 3 | VOLATILITY REGIMES OF SELECTED CENTRAL EUROPEAN STOCK RETURNS: A MARKOV SWITCHING GARCH APPROACH / 2022 / Journal of Business Economics and Management / vol.23, no.4, pp.876 / |
| 4 | The Relationship Between the Stock Market Volatility, Liquidity, Exchange Rate Return, and Stock Return During the COVID-19 Period: The case of the BIST 100 Index / 2023 / Bingöl Üniversitesi İktisadi ve İdari Bilimler Fakültesi Dergisi / vol.7, no.1, pp.121 / |
| 5 | How Did Financial Markets Respond to COVID-19 and Governmental Policies During the Different Waves of the Pandemic? / 2022 / Asian Economics Letters / vol.5, no.Early View, |
| 6 | The Impact of COVID-19 on Stock Returns and Firm Characteristics in the Saudi Stock Market / 2024 / Cogent Economics & Finance / vol.12, no.1, |
Article View
East Asian Economic Review Vol. 25, No. 2, 2021. pp. 205-230.
DOI https://dx.doi.org/10.11644/KIEP.EAER.2021.25.2.396
Number of citation : 6View
100
Download
75
The COVID-19 and Stock Return Volatility: Evidence from South Korea
|
|
Department of Economics, Changwon National University |
|---|

Abstract
This study examines the impact of the number of coronavirus cases on regime-switching in stock return volatility. This study documents the empirical evidence that the COVID-19 cases had an asymmetric effect on the regime of stock return volatility. When the stock return is in the low volatility regime, the probability of switching to the high volatility regime in the next trading day increases as the number of cumulative cases increases. In contrast, in the high volatility regime, the effect of cumulative cases on the transition probability is not statistically significant. This study also documents the evidence that the government measures against the pandemic contribute to promoting the high volatility regime of the KOSPI during the pandemic. Besides, this study projects future stock prices through the Monte Carlo simulation based on the estimated parameters and the predicted number of the COVID-19 new cases. Under a scenario where the number of new cases rapidly increases, stock price indices in Korea are expected to be in a downward trend over the next three months. On the other hand, under the moderate scenario and the best scenario, the stock indices are likely to continue to rise.
JEL Classification: G11, G12, I10
Keywords
COVID-19, Social Distancing, Stock Return Volatility, Regime-Switching Regression, Monte Carlo Simulation
I. Introduction
The year 2020 is socially and economically unprecedented in history. The global spread of the coronavirus has hit the economy hard, and the asset prices in financial markets have fallen sharply in the early stages of the health crisis, which has had a huge impact on many market participants. During this period, economic uncertainty in major economies (e.g., U.S., U.K.) has dramatically increased because of the pandemic (Altig et al., 2020). Due to the sharp decline in the prices of risky assets in the early stages of the public health crisis, experts made mixed predictions on the direction of the stock price, but after the initial phase of the crisis, the stock prices rebounded strongly and have recovered their pre-peak levels.
The Korean stock market has shown a similar pattern as it went through several large-scale expansions of the virus. Since the spread of the virus, the research on the pandemic’s impact on financial markets and asset prices has increased rapidly. For example, Ashraf (2020) reports that the increase in the number of cumulative cases led to the decline in the stock return, analyzing the stock return data of 64 countries from January 2020 to April 2020. Similar findings are documented in Alfaro et al. (2020), Baker et al. (2020), and Liu et al. (2020).
In contrast, studies on the effects of the COVID-19 in South Korea from an asset price perspective are relatively scanty. In this regard, this study is designed to close this gap by estimating the effect of the pandemic on the stock return volatility. Specifically, this paper documents empirical evidence of a direct relationship between the change in the number of infected cases and the regime of stock return volatility by using a relatively simple Markov switching regression model for stock return. While many factors influence the stock return volatility, this study assumes that the key driver for the regime change in the stock return volatility during the pandemic is related to the number of COVID-19 cases. The reason for using this relatively simple framework is to get an idea of how the future stock price will evolve based on the data on the predicted numbers of new cases. This study also documents the empirical evidence that government measures against the pandemic (e.g., social distancing policies) had a positive impact on stock return volatility of the KOSPI index during the pandemic.
Given the related literature reports that stock return has become more volatile during the pandemic across the global financial markets (e.g., Albulescu, 2021; Onali, 2020; Haroon and Rizvi, 2020; Baek et al., 2020 and Zaremba et al., 2020), this study aims to verify the role of the pandemic in stock return volatility dynamics in the Korean stock market. Another goal of this study is to project the future stock price based on this study’s results and the expected number of COVID-19 cases.
The COVID-19 pandemic can affect stock return volatility through various channels. For example, the rapid increase in the number of the COVID-19 followed by government responses such as social distancing will reshape future economic conditions. The deteriorated economic environment, in terms of household consumption and firm investment, can trigger system-wide portfolio restructuring by modifying investors’ perception of the risk-return tradeoff. Stock price adjustments in the process of portfolio restructuring tend to be made in a highly abrupt fashion during a crisis, which may result in increased volatility. Especially, at the onset of the public health crisis, the preference of investors for safe assets tends to increase significantly (i.e., flights to safety). Portfolio rebalancing from multiple asset classes to safe assets (e.g., gold and treasury bills) can also significantly increase the volatility of asset prices (Baele et al., 2020). In addition, increased uncertainty in the market can create a dramatic divergence in investors’ opinions regarding future stock prices, which can lead to an increase in trading volume and volatility (Harris and Raviv, 1993 and Banerjee, 2011). Furthermore, the sentiment shift driven by the constant flow of the COVID-19 related news can generate sentiment-driven volatility (Tetlock, 2007 and Pyo and Kim, 2021).
To our best knowledge, this study is the first quantitative assessment of the impact of the COVID-19 pandemic on the stock return behavior of South Korea. While many related studies focus on the linear effect of the pandemic on stock return volatility, this study rather focuses on investigating the existence of structural breaks in the dynamic behavior of stock returns during the pandemic, studying how the development of the pandemic plays out in determining the dynamic process of stock prices. In addition, having considering the policy measures as one of the key determinants of the regime of stock return volatility, this paper offers several important implications from the policy perspective. Furthermore, one distinctive feature of the study is a scenario analysis in which future stock prices are forecasted based on the projections on the COVID-19 cases in the upcoming months. The scenario-based analysis undertaken in this paper has been rarely pursued in the related literature. The simulation results are expected to provide an important clue on the trend of future stock prices in the late phase of the pandemic for investors. At the same time, we expect it would provide an environment in which effective risk management practices can be established.
This study is structured as follows. In Section II, the empirical framework for analysis is introduced. In the following sections, we discuss the key results of this study, and then we proceed to report the projections of stock prices based on the forecasts of new cases and the estimated model. The paper concludes with remarks.
II. Methodology
The empirical strategy of this study is twofold. First, the Markov regime-switching model with time-varying transition probability (hereafter, TVP-MRS) is utilized to examine the role of the COVID-19 cases on the regime-switching of stock return volatility across two regimes (i.e., high volatility regime versus low volatility regime). The model is suitable because it can easily identify the existence of the nonlinear effect of the COVID-19 cases on stock return volatility. The Markov regime-switching model has been widely applied to various issues, including the identification of structural breaks in time series and latent states of key macroeconomic/financial variables (e.g., Engel and Hamilton, 1990; Garcia and Perron, 1996; Hamilton, 1989 and Kim et al., 1998). Second, using the information on the regime of stock return volatility derived from the first-order Markov regime-switching model (hereafter, MRS), we investigate the impacts of the COVID-19 cases and government measures against the COIVID-19 pandemic on the probability of being in the high volatility regime.
1. Regime-Switching Model on Stock Return
The specification of the estimation model in this study is quite simple and straightforward. The daily stock return is modeled as a state-dependent drift with a random shock, which also has a state-dependent magnitude of volatility.
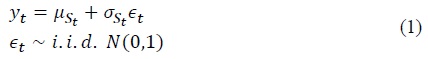
where
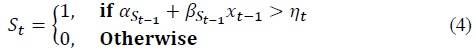
Since we are considering a two-state case (i.e., low volatility versus high volatility), the state variable (

where 0 indicates a low volatility regime and 1 refers to a high volatility regime. Note that the state variable is unobservable and is assumed to evolve according to the following transition probabilities mainly governed by the dynamics of the COVID-19 cases.

where
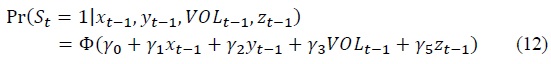
The specification of transition probabilities is assumed to follow a probit function as below.
where
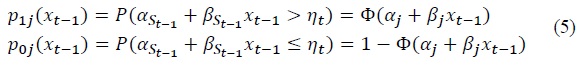
where Φ is the standard normal cumulative distribution function. Furthermore, we assume that
Let’s denote probability inferences on the regimes at the time
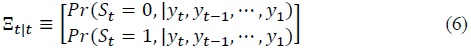
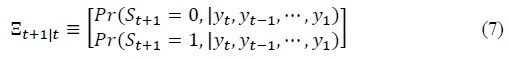
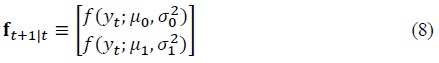
Suppose
The forecasts of probabilities and probability inferences can be obtained by the following recursion (i.e., Hamilton filter.2):
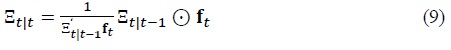

where
2. Probit Model of High Volatility Regime
The purpose of this empirical model is to investigate to what degree the COVID-19 cases and government measures against the virus have impacted the stock return volatility, assuming those two variables are key drivers in determining the high volatility regime of stock return.
For simplicity, the state variable,

where
where Φ is the standard normal cumulative distribution function.
Since the state of stock return volatility is unobserved, the high volatility regime is inferred from the Markov regime-switching model with time-invariant transition probabilities. Specifically, if the date on which the smoothed probability implied by the model is greater than 0.5, the current state in a given trading day is defined as the high volatility regime.3 Otherwise, the regime is defined as the low volatility regime.
1)This term refers to a white noise that might influence the regime-switching of stock return and is orthogonal to the COVID-19 variable.
2)See
3)From the perspective of an econometrician, the regime of a stock return is
III. Data
For stock return data, we use stock price indices in South Korea: KOSPI (Korea Composite Stock Price Index) and KOSDAQ (Korea Securities Dealers Automated Quotation). These two indices are primary stock market indices in South Korea, which capture aggregate stock price movements. The KOSPI Index usually consists of firms with relatively large market capitalization, while the KOSDAQ index comprises firms with relatively small market capitalization. Given that there are significant differences in firm characteristics across the two markets, the impact of the pandemic on the evolution of each index could be asymmetric. Daily stock return is calculated from the daily stock index. The data on daily COVID-19 cases in South Korea, including both new cases and cumulative cases, is obtained from the WHO Coronavirus Disease (Covid-19) Dashboard.4 The sample period for estimation runs from 04 February 2020 to 13 November 2020. We restrict the sample period to the period before the arrival of the news on the successful development of a coronavirus vaccine. As Pfizer, a global pharmaceutical firm, announced on 18 November 2020 that its jointly developed vaccine candidate (BNT162b2) meets all primary efficacy endpoints in the Phase 3 trial, it is expected that the introduction of successful vaccines will become a game-changer for the dynamics of virus spread and economic recovery. Analysis of the period after the news of successful vaccine development is considered possible when more samples are accumulated.
Stock prices in South Korea during the pandemic are plotted in Figure 1 along with new cases of the COVID-19. As observed in many countries, both stock price indices have dramatically plummeted at the onset of a pandemic and subsequently bounced back, passing the pre-pandemic levels of stock prices. The COVID-19 cases also exhibit substantial fluctuations during the sample period, marked with several rising waves.5
The daily stock return during the pandemic is presented in Figure 2. The figures show that stock return has become more volatile under a certain subperiod, suggesting that a regime shift in stock return volatility existed during the pandemic.
For the construction of a government measures variable, we use the COVID-19 Government Measures Dataset provided by the ACAPS. This dataset collects each country’s government policies against the virus and classifies measures into five domains, which include social distancing, movement restrictions, lockdown, public health measures, and governance/socio-economic measures. Out of these domains, the dummy variable for government measures is set to 1 when measures fall into social distancing, movement restrictions, and lockdown on the basis that those measures are more likely to depress economic activities during the pandemic. Table 1 shows the dates on which those measures are implemented and details on them.6 Table 2 shows the summary of variables used in the estimations.
4)
5)As of December 2020, South Korea is facing the third wave of rising COVID-19 cases.
6)The list includes the government measures which are initially introduced. The extensions of previously introduced measures are not included in the sample.
IV. Results
This section reports the results of the estimation of Markov regime-switching regression. Our key concern is to quantitatively verify whether the COVID-19 cases had played a vital role in the regime shift in stock return volatility. Table 3 shows the estimated parameters in the model, from which we can observe that two distinct regimes had emerged during the pandemic. One is a regime with high volatility and low average return, and the other is a regime with low volatility and a higher average return. Comparing this with the estimates in the absence of regime shifts, the average stock return in the high volatility regime is lower than the average return under the specification of no regime change, while it exhibits higher volatility than single regime specification. On the other hand, in the low volatility regime, higher average return and lower volatility are observed during the pandemic.
Regarding the KOSPI index, the variance of stock return during the high volatility regime is estimated at around 0.13%, while the variance of it during the low volatility regime is estimated at around 0.01%. The average stock return during the high regime is estimated at -0.53%, whereas the average stock return during the low regime is estimated at around 0.25%. However, the negative average stock return under the high volatility regime has no statistical significance. It is also observed that each regime’s characteristics for the KOSDAQ index do not significantly differ from those of the KOSPI.
The results also demonstrate that transition between the two volatility regimes has been affected by the COVID-19 cases. When the current state is the high low regime, an increase in the COVID-19 case is shown to increase the probability of shifting to the high volatility regime (i.e., lowering the probability of staying in the low volatility regime). On the other hand, the estimated key parameter (
We also calculate the probability of stock return being in the high volatility regime during the sample period by the Hamilton filter and the Kim filter (Kim, 1994). The probabilities of being in the high volatility regime for the KOSPI and the KOSDAQ are plotted in Figure 3 and Figure 4. During the pandemic period, the probability of a high volatility regime is generally similar across two stock indices. At the beginning of the coronavirus outbreak, both stock returns shifted to the high volatility regime with a very high probability. Nevertheless, the probability of a high volatility regime for the KOSPI index is relatively low from September to November. On the other hand, the KOSDAQ index exhibits more volatile movements during those periods. The high probability for the high volatility regime is mostly consistent with the point at which the coronavirus spreads on a large scale.7
Table 4 shows the estimation results of the probit model. The results imply that the increase in the COVID-19 cases has increased the probability of going to the high volatility regime. An infinitesimal change in the COVID-19 cases is estimated to increase the probability of the high volatility regime in the next day for the KOSPI index by about 94.84%p, and 93.66%p for the KOSDAQ index, respectively. In contrast, the increase in stock return is associated with a lower probability of high volatility regime in the next trading day. The results also indicate that the government response tends to be positively associated with the emergence of the high volatility regime in the KOSPI index: the increase in the probability of the high volatility regimes by the introduction of various government measures is estimated to be around 13%p.
On the other hand, we find there is no significant effect of the government response variable on the KOSDAQ index. The heterogeneous impact of the government measures across two stock indices raises the need for sectoral level examination of stock return behavior during the pandemic. The differences in sectoral composition, market capitalization, and other sectoral level factors between the two indices might derive this discrepancy. As well known, some tech firms’ revenues and profits are dramatically improved during the pandemic because those sectors are believed to be less vulnerable to social distancing policies, while some sectors (i.e., airlines and tourism) are heavily affected by the government measures.
7)In Appendix A, we provide additional empirical evidence on a positive relationship between the COVID-19 cases and VIX (Volatility Index). Also, as a comparative study, we conduct a similar analysis for the period during which the MERS (Middle East Respiratory Syndrome) prevailed in 2015.
V. Monte Carlo Simulation of Stock Prices
This section aims to make projections on the future stock prices using the estimated parameters of the model. Although the coronavirus vaccine has been developed and distributed across countries, South Korea has entered the third wave of the pandemic as of December 2020. It is expected that it will take a considerable amount of time for herd immunity to be formed as new cases continue to occur. This experiment is designed to provide a broad picture of how the stock price will evolve depending on the dynamics of the number of new cases in the coming months. Of course, the number of infected people is not the only factor that shapes the evolution of future stock prices, but for the time being, it is likely that the stock market will inevitably be affected by the virus spread.
Since we model the switching across two volatility regimes depends on the change in cumulative cases, we need to have COVID-19 case projections data to make forecasts. Since the Korean government does not publish official projections on new cases, we resort to external projection data provided by the Institute for Health Metrics and Evaluation (IHME).8 The IHME provides daily COVID-19 new cases up to March 2021 under three different scenarios, which are shown in Figure 5: best (lower), moderate (medium), and worst (upper). The latest forecasts are made on 23 December 2020.
Based on these projections of new cases and the estimated parameters, we carry out Monte Carlo simulations on future stock prices. In the simulations, we assume the expected stock return is zero in either a high volatility regime or a low volatility regime;

On the other hand, volatility parameters and transition probability parameters are set based on values in Table 3. The 5000 runs of simulation for each stock index are implemented to obtain the average stock price projections and confidence intervals.
Figure 6 shows the forecasts on the KOSPI index for each scenario up to March 2021, while Figure 7 presents the forecasts on the KOSDAQ index. Under the worst scenario case, the stock price is forecasted to be in a downward trend from the beginning of February. However, under the moderate and best scenario, the stock price is expected to continue to form an uptrend. From a probabilistic point of view, the stock price is most likely to be higher for the next three months than the current stock price level under the moderate scenario.
These projection results are not intuitively appealing, given that under a moderate scenario, the stock price is projected to be highest on average at the end of March. However, these results are probably derived from the difference in the pattern of the predicted number of new cases. Under the moderate scenario, the number of new cases increases sharply until mid-February and then decreases. Positive sentiment will prevail in the stock market due to the steep decline in the number of new cases after mid-February as the relaxation of social distancing measures is expected. In contrast, under the best scenario, the number of new cases remains stable at a lower scale, creating less innovation in information content regarding the pandemic. Under the worst scenario, since the number of new cases is projected to rise to around 200,000 per day in February, social distancing measures are likely to be further expanded, or lockdown could be implemented, facing at those levels of new cases. This situation is likely to have an insurmountably negative impact on the asset prices even though the sharp decrease in new cases follows after mid-February.
8)
VI. Concluding Remarks
This study analyzes the regime change in stock return volatility according to the development of the coronavirus pandemic. According to the main results, the increase in the number of coronavirus cases in the low volatility regime is found to promote the shift to the high volatility regime. On the other hand, it is found that the COVID-19 cases in the high volatility regime do not have a statistically significant effect on the transition. The results of this study are consistent with those of the related studies for other countries. In addition, this study also documents that government measures such as social distancing to curb the spread of the virus tend to destabilize stock prices.
However, it is unpredictable whether the results of this study and related studies will remain to be intact in the future. Because vaccines have been developed and vaccinations are being made across the globe, even if the number of cases suddenly increases, asset prices may move in a different pattern from the last year.
Given that this paper is a preliminary study on the coronavirus’s effect on stock return volatility in South Korea, this pandemic should be analyzed in more depth in various aspects of asset prices and financial markets. For example, while the pandemic intensified over the past year, the stock price pattern was significantly different by sector. In particular, stock prices in sectors involving close contact with people such as aviation, travel, and service-oriented industries were among the most severely affected. Conversely, tech firms’ stock prices quickly recovered to the pre-pandemic stock price level. In this regard, it will be interesting to conduct a sectoral-level study of the pandemic’s effect on stock prices.
During the pandemic, the South Korean government has taken strong measures such as extensive social distancing and expanding virus tests. According to this study’s findings, these responses might have destabilized stock prices to some extent. The results of this study suggest that if asset price stability is one of the government’s policy goals, additional policies that can offset the increase in financial market instability caused by heightened social distancing should be considered at the same time. As one of the counter-measures, the South Korean government has introduced a policy to ban short-selling on stocks to secure financial market stability at the onset of the pandemic. There are pros and cons to this extreme policy. Some argue this policy can limit financial instability to a certain level, while others criticize it for its distortionary effects on market efficiency. However, policy responses such as a ban on short-selling should be considered as a temporary measure for stabilizing asset prices and are impossible to continue permanently. The extensive and rigorous search for policies to stabilize the overall financial market condition facing increased vulnerability driven by drastic government measures is necessary for preparation for a future pandemic that might come again.
With the rapid increase in liquidity due to the low-interest-rate environment and the pandemic situation, many people are concerned about the gap between asset prices and the real economy. No one knows precisely the answer as to whether the current asset price level is a bubble or not. However, if the economic recovery is significantly delayed due to the prolonged pandemic, the asset price will likely face tremendous downward pressures. The government must prepare preemptive measures in advance for this case.
Tables & Figures
Figure 1.
COVID-19 New Cases and Stock Prices
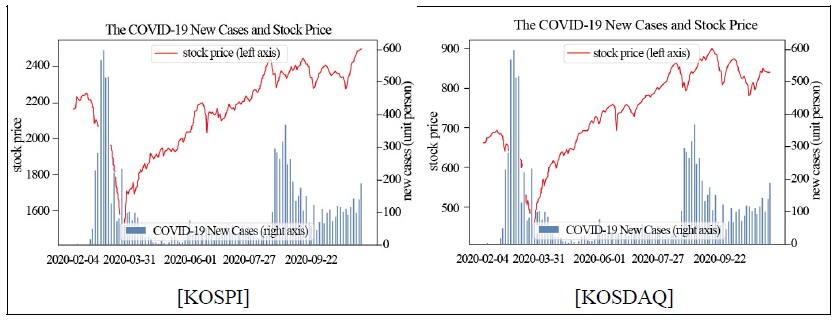
Figure 2.
Stock Return during the COVID-19 Pandemic
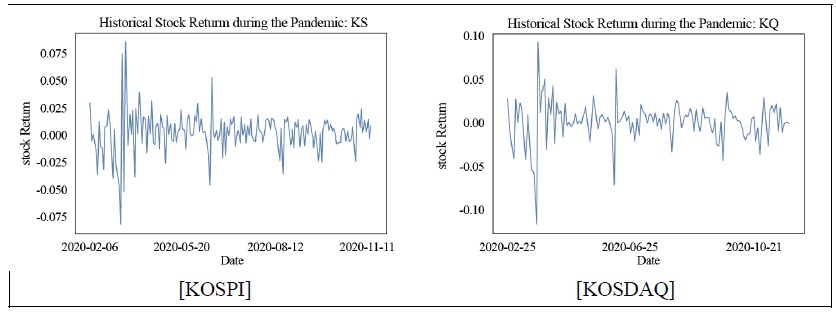
Table 1.
South Korea Government’s Primary Measures against the Coronavirus
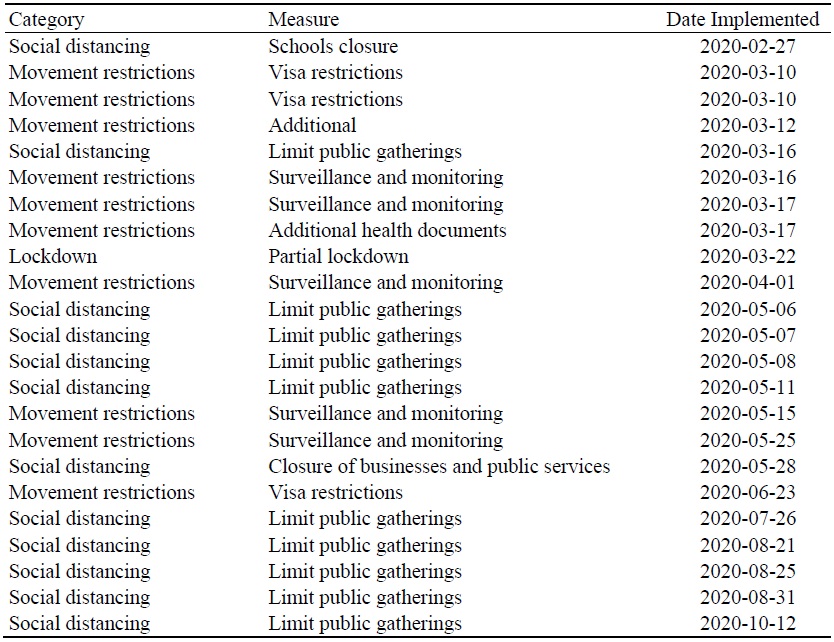
Notes: The list is not exhaustive. It only includes government measures which are classified into three categories: (i) lockdown (ii) social distancing (iii) movement restriction. In addition to these types, government responses also include public health measures, governance and socio-economic measures.
Source: ACAPS (acaps.orgacaps.org)
Table 2.
Descriptive Statistics of Variables
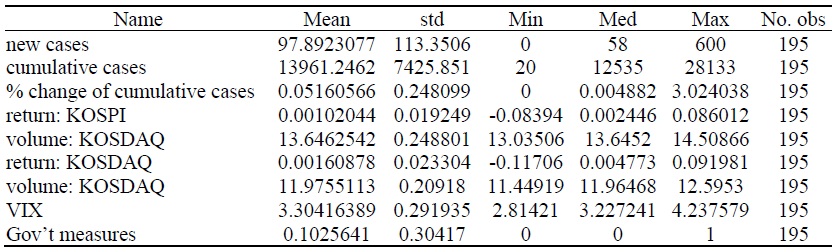
Notes: The sample period is from 04 February 2020 to 13 November 2020. Trading volumes are log-transformed and the Gov’t measures is a binary variable.
Table 3.
Estimated Parameters of Markov Regime-Switching Model on Stock Return
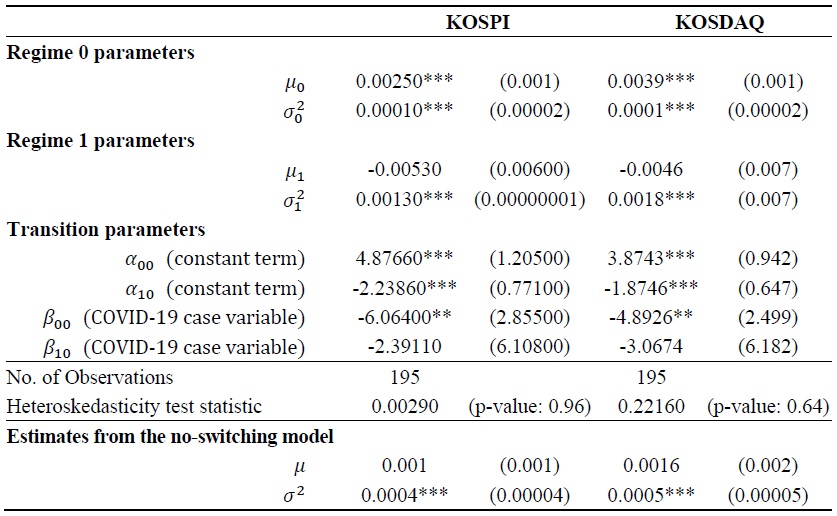
Notes: Standard errors for estimated parameters are in parentheses. Subscript in regime transition parameters (e.g.,
Figure 3.
Filtered Probability of a High Volatility Regime during the Pandemic
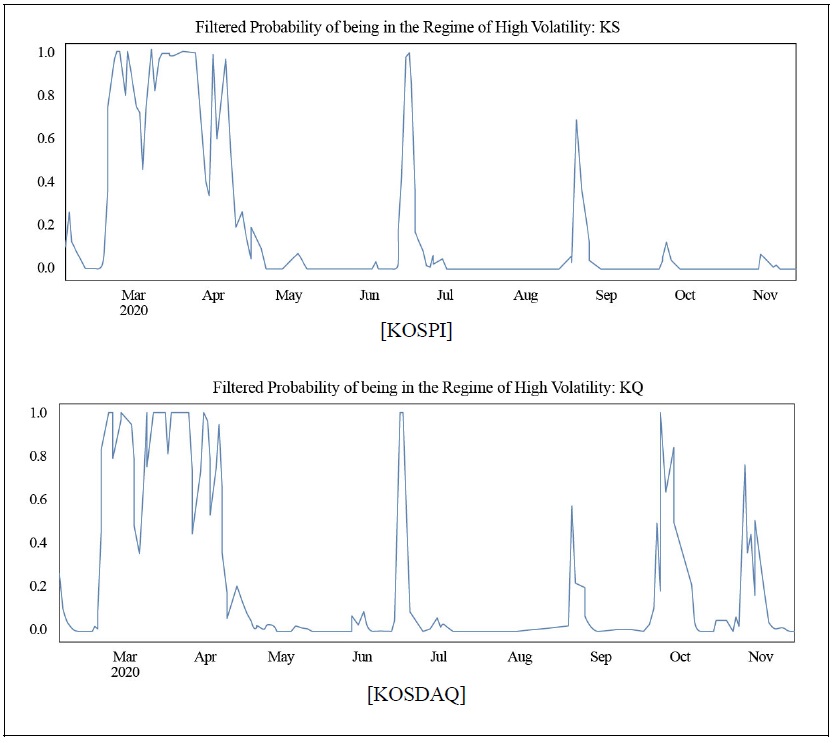
Figure 4.
Smoothed Probability of High Volatility Regime during the Pandemic
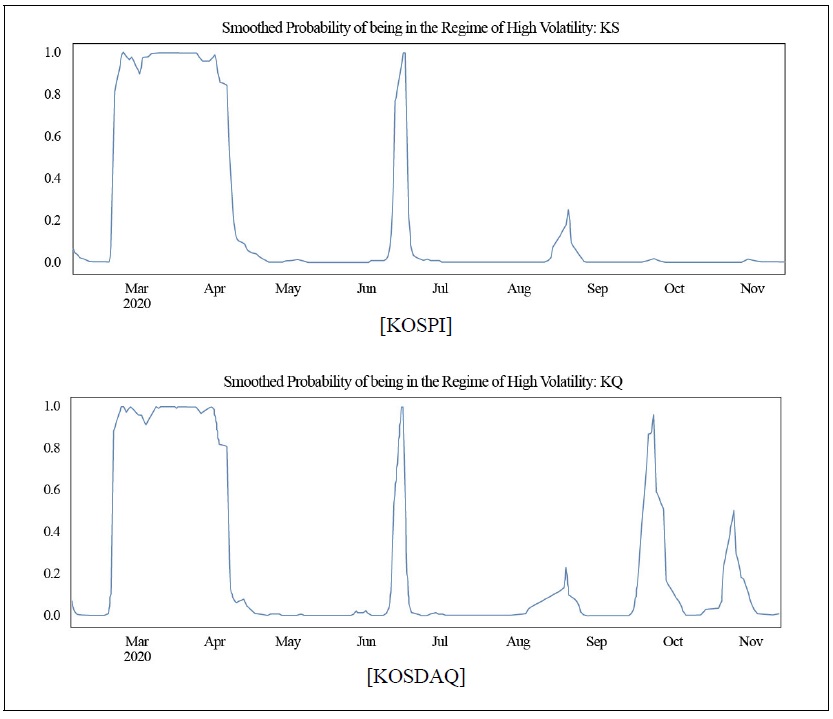
Table 4.
Probit Estimation Results
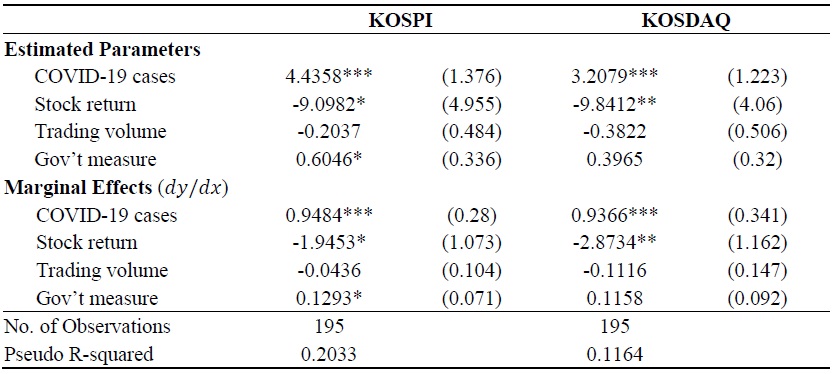
Notes: Standard errors are in parentheses. The dependent variable is a binary variable that is equal to 1 if the current trading day is in the high volatility regime. Log-transformed explanatory variables are used in the estimation. The Gov’t measure is a dummy variable which is 1 if South Korea’s government measures regarding the pandemic correspond to the following categories: (i) social distancing (ii) movement restrictions (iii) lockdown.
Figure 5.
COVID-19 New Cases Projections for South Korea
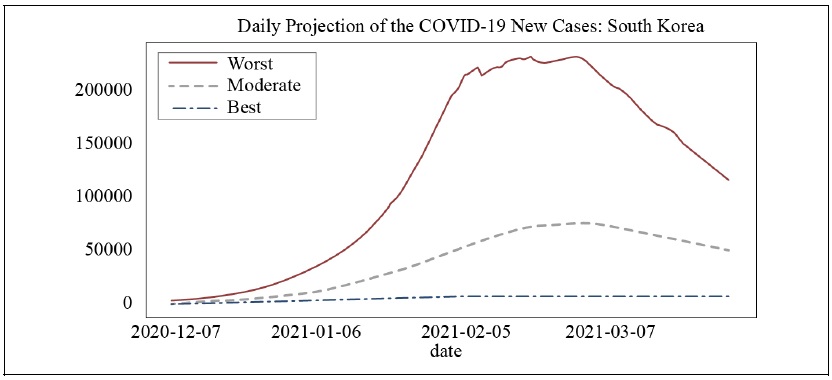
Figure 6.
Stock Price Projections: KOSPI
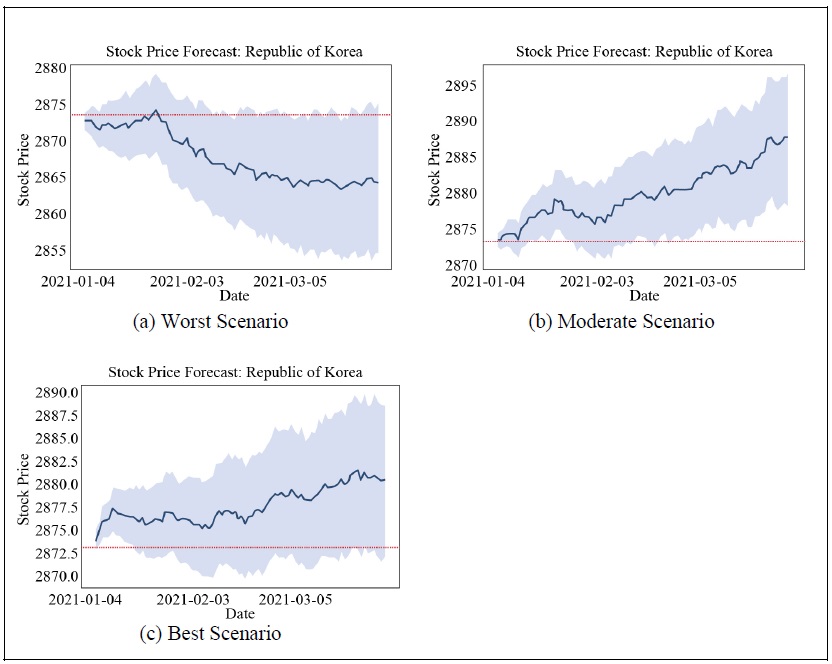
Note: Red dot line indicates the stock price on 31 December 2020.
Figure 7.
Stock Price Projections: KOSDAQ
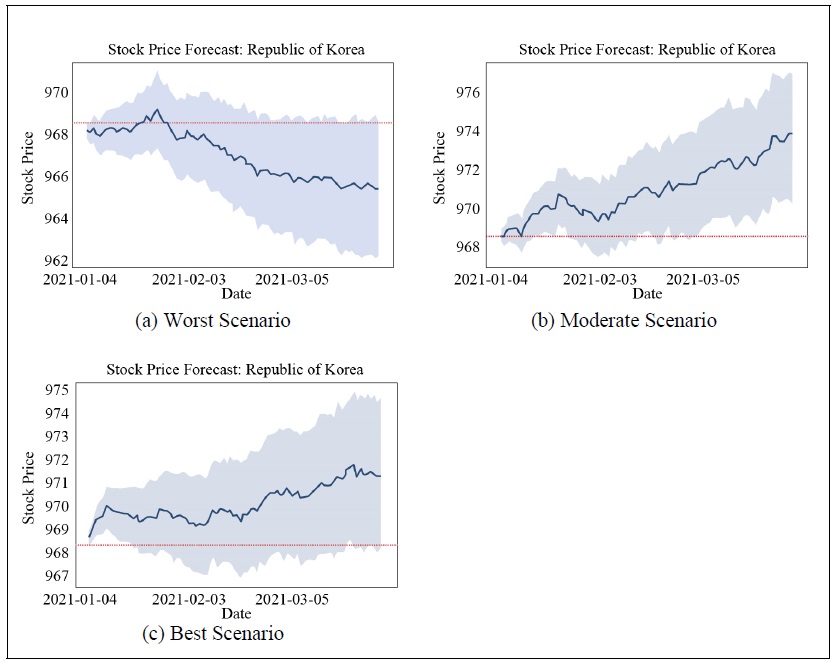
Note: Red dot line indicates the stock price on 31 December 2020.
APPENDIX A: COVID-19 CASES AND VIX (VOLATILITY INDEX)
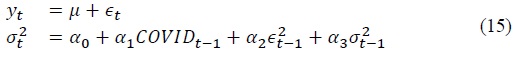
As a robustness check for major findings of this study, we carry out the following estimation model, using VIX (Volatility Index) to quantify the impact of the change in the number of new cases on the change in stock return volatility.
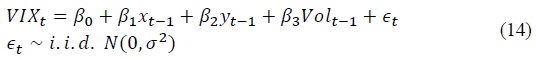
where
The results demonstrate that a 1% increase in the COVID-19 cases has led to a 3.58% increase in the VIX, suggesting the increase in new cases tends to increase volatility in stock return during the pandemic. The COVID-19 case variable maintains its statistical significance for all model specifications, with its magnitude being around 3%. These results also support the claim that stock return tends to become more volatile under the surge in COVID-19 new cases.9
9)Alternatively, this can be interpreted as an increase in fear in the financial market as new cases increases.
APPENDIX B: STOCK RETURN DURING THE MERS IN 2015
The purpose of this appendix is to confirm that the dynamic behavior stock return observed during the pandemic is peculiar to the COVID-19 or it can be characterized as a universal pattern under the spread of any infectious diseases. To achieve this goal, we will analyze the changes in the volatility of stock returns in other epidemic situations that Korea has experienced in the past by applying the same empirical approach.
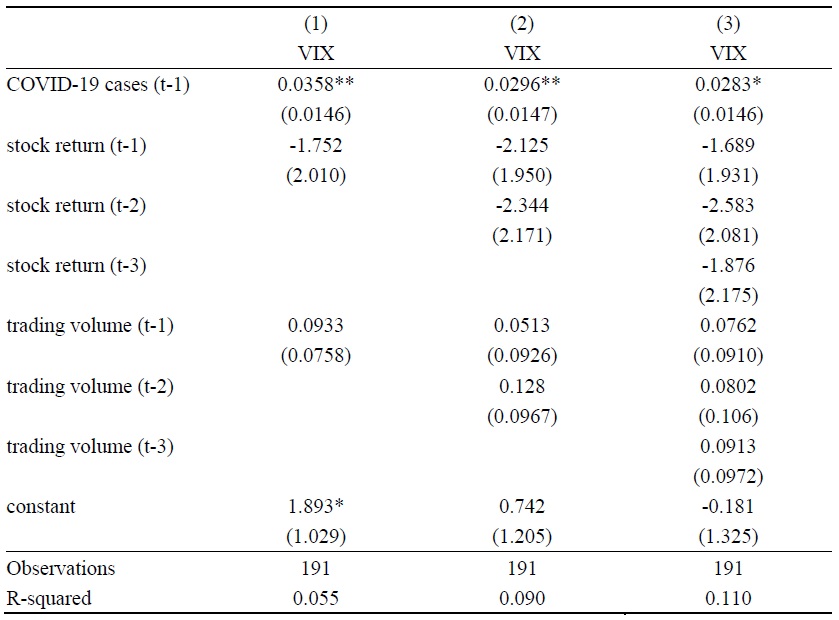
Since the coronavirus is an unprecedented global pandemic, it is quite difficult to find similar cases which are comparable to the COVID-19 in terms of the magnitudes of social and economic impacts. One candidate we can consider in this analysis is the MERS (Middle East Respiratory Syndrome), which occurred in 2015. In South Korea, the first case of the MERS was reported on 20 May 2015 and the peak level of infected cases was 186 on 5 July 2015. The cumulative cases of the MERS and stock prices during the MERS crisis are shown in Figure 8. As clearly illustrated in the figure, the duration of MERS was considerably shorter than the duration of the COVID-19, and because there were no system-wide strict government responses such as social distancing and lockdown, socioeconomic impacts of it were very limited. We can also observe that the dynamic behavior of stock prices since the onset of the MERS; in the case of the KOSPI index, it tended to decline at the beginning of the spread, but showed a sideways pattern in the following periods, while the KOSDAQ index showed a pattern of upward movement regardless of the spread of the MERS.
We ran the TVP-MRS model for stock returns during the MERS to check whether the stock return can be characterized as a dynamic process similar to what we observed during the COVID-19 pandemic.10 Table 6 shows the estimated parameters of key variables. As expected, the MERS case variable is not found to have statistically significant impacts on the regime change of the stock return.
We also ran a regime-switching model under a constant probability specification to identify the regime of stock return and subsequently estimated the probit model11 for the high volatility regime of stock return. The previous results are consistent with those derived from probit estimation as shown in Table 7; the MERS case is found to be an insignificant factor for the high volatility regime during the MERS. In sum, these results suggest that it is hard to characterize the MERS in 2015 as a pandemic similar to the COVID-19 in terms of stock return dynamics.12
10)Maximum likelihood optimization for the KOSPI Index return under the time-varying transition probability specification fails to converge at various starting values. So we only report results for the KOSDAQ index. Given that the sample size is very small, we cannot guarantee the wellbehaved asymptotic properties of estimated parameters.
11)Since no data is available for government measures during the MERS, the specification of the probit model slightly differs from the estimation model introduced in the main text.
12)In terms of the number of infected cases, the MERS in 2015 is not comparable to the COVID-19; as of 12 March, 94,686 infected cases in total are reported in South Korea and the virus spread in many local communities is still ongoing.
APPENDIX C: LINEAR EFFECTS OF THE COVID-19 ON STOCK RETURN VOLATILITY
In this section, we aim to estimate the magnitude of the impact of the COVID-19 cases on stock return volatility, using conventional GARCH models. While the Markov Regime Switching model can capture a discrete jump in stock return volatility, GARCH models allow us to examine the extent of linear effects of some exogenous variables on the conditional variance of a variable of our concern. So we model the conditional variance of stock return at time
where 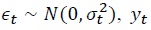 refers to stock return, and
Table 8 shows the estimated parameters of the model under the GARCH (1,1) specification.13 According to the results, the impact of information related to the COVID-19 cases on the conditional volatility of stock returns was different between KOSPI and KOSDAQ. An increase in the COVID-19 cases in the previous trading date tends to be positively associated with conditional variance of stock returns on the current trading date. The estimated parameter indicates that 1% increase in the COVID-19 cases variable leads to an increase in stock return volatility of KOSPI by 0.0278, which is in line with the main findings of this study.
However, the COVID-19 variable is not shown to exert a linear effect on the volatility of the KOSDAQ index. Given that the KODAQ index consists of firms with relatively lower market capitalization, the adjustments of stock prices facing the development of the pandemic might occur in a discrete fashion (e.g., gap down or gap up) rather than a continuous fashion.
13)For higher-order GARCH specifications, the maximum likelihood optimization does not converge for the sample data. Thus, we resort to the most parsimonious specification.
Appendix Tables & Figures
Table 5.
COVID-19 Cases and VIX (Volatility Index)
Notes: Standard errors are in parentheses. The dependent variable is the VIX (Volatility Index) of KOSPI. All variables are log-transformed.
Figure 8.
Stock Prices during the MERS (Middle East Respiratory Syndrome) in 2015
Table 6.
Estimated Parameters of Regime-Switching Model on Stock Return during the MERS in 2015
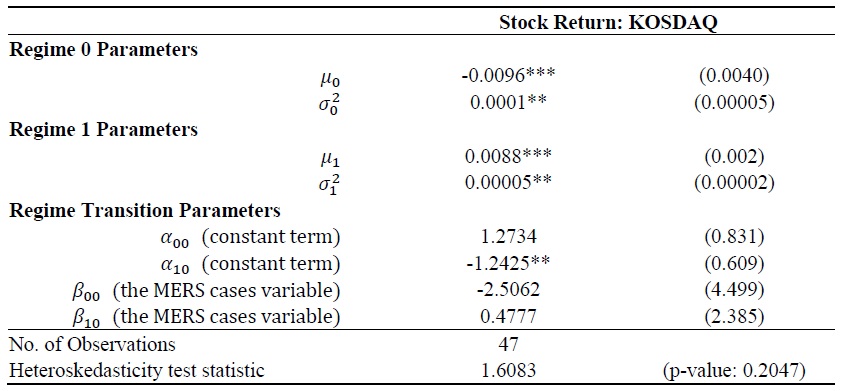
Notes: Standard errors are in parentheses. The MERS case variable denotes the percentage change in cumulative cases. The dependent variable of the estimation is a daily stock return. The sample period runs from 20 May 2015 to 29 July 2015. Subscript in regime transition paramters (e.g.,
Table 7.
Probit Estimation Results: the MERS (Middle East Respiratory Syndrome) in 2015
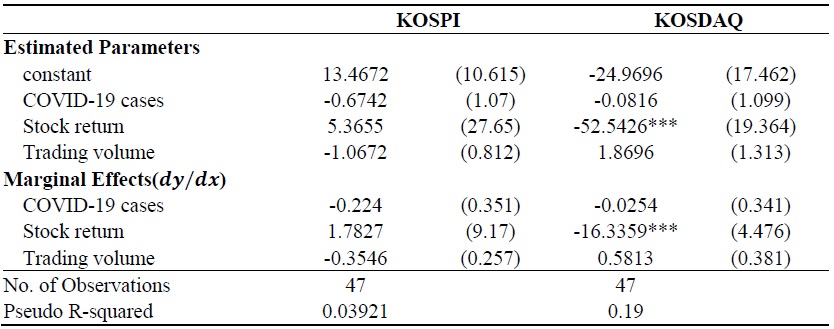
Notes: Standard errors are in parentheses. The dependent variable is a binary variable that is equal to 1 if the current trading day is in the high volatility regime. The MERS cases variable is defined as a percentage change in cumulative cases. Log-transformed trading volume is used in the estimation.
Table 8.
GARCH (1,1) Estimates
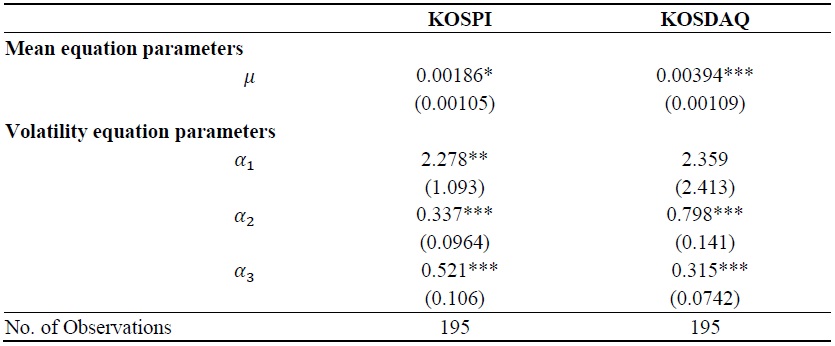
Notes: Standard errors are in parentheses. The COVID-19 cases variable is log-transformed in the estimation.
References
-
Albulescu, C. T. 2021. “COVID-19 and the United States Financial Markets’ Volatility,”
Finance Research Letters , vol. 38.
- Alfaro, L., Chari, A., Greenland, A. N. and P. K. Schott. 2020. Aggregate and Firm-Level Stock Returns During Pandemics, in Real Time. NBER Working Paper, no. 26950.
-
Altig, D., Baker, D., Barrero, H. M., Bloom, N., Bunn, P., Chen, S., Davis, S. J., Leather, J., Meyer, B., Mihaylov, E. et al. 2020. “Economic Uncertainty Before and during the COVID-19 Pandemic,”
Journal of Public Economics , vol. 191.
-
Ashraf, B. N. 2020. “Stock Markets’ Reaction to COVID-19: Cases or Fatalities?”
Research in International Business and Finance , vol. 54.
-
Baek, S., Mohanty, S. K. and M. Glambosky. 2020. “COVID-19 and Stock Market Volatility: An Industry Level Analysis,”
Finance Research Letters , vol. 37.
-
Baele, L., Bekaert, G., Inghelbrecht, K. and M. Wei. 2020. “Flights to Safety,”
Review of Financial Studies , vol. 33, no. 2, pp. 689-746.
- Baker, S. R., Bloom, N., Davis, S. J., Kost, K. J., Sammon, M. C. and T. Viratyosin. 2020. The Unprecedented Stock Market Impact of COVID-19. NBER Working Papers, no. 26945.
-
Banerjee, S. 2011. “Learning from Prices and the Dispersion in Beliefs,”
Review of Financial Studies , vol. 24, no. 9, pp. 3025-3068.
-
Engel, C. and J. Hamilton. 1990. “Long Swings in the Dollar: Are They in the Data and Do Markets Know It?”
American Economic Review , vol. 80, no. 4, pp. 689-713. -
Garcia, R. and P. Perron. 1996. “An Analysis of the Real Interest Rate under Regime Shifts,”
Review of Economics and Statistics , vol. 78, no. 1, pp. 111-125.
-
Hamilton, J. D. 1989. “A New Approach to the Economic Analysis of Nonstationary Time Series and the Business Cycle,”
Econometrica , vol. 57, no. 2, pp. 357-384.
-
Hamilton, J. D. 1994.
Time Series Analysis . Princeton, NJ: Princeton University Press. -
Haroon, O. and S. A. R. Rizvi. 2020. “COVID-19: Media Coverage and Financial Markets Behavior-A Sectoral Inquiry,”
Journal of Behavioral and Experimental Finance , vol. 27.
-
Harris, M. and A. Raviv. 1993. “Differences of Opinion Make a Horse Race,”
Review of Financial Studies , vol. 6, no. 3, pp. 473-506.
-
Kim, C. J. 1994. “Dynamic Linear Models with Markov-switching,”
Journal of Econometrics , vol. 60, no. 1-2, pp. 1-22.
-
Kim, C. J., Nelson, C. R. and R. Startz. 1998. “Testing for Mean Reversion in Heteroskedastic Data Based on Gibbs-sampling-augmented Randomization,”
Journal of Empirical Finance , vol. 5, no. 2, pp. 131-154.
-
Liu, H., Manzoor, A., Wang, C., Zhang, L. and Z. Manzoor. 2020. “The COVID-19 Outbreak and Affected Countries Stock Markets Response,”
International Journal of Environmental Research and Public Health , vol. 17, no. 8. - Onali, E. 2020. “COVID-19 and Stock Market Volatility.” Available at SSRN. <https://dx.doi.org/10.2139/ssrn.3571453> (accessed April 21, 2021)
-
Pyo, D. J. and J. Kim. 2021. “News Media Sentiment and Asset Prices in Korea: Text-mining Approach,”
Asia-Pacific Journal of Accounting & Economics , vol. 28, no. 2, pp. 183-205.
-
Tetlock, P. C. 2007. “Giving Content to Investor Sentiment: The Role of Media in the Stock Market,”
Journal of Finance , vol. 62, no. 3, pp. 1139-1168.
-
Zaremba, A., Kizys, R., Aharon, D. Y. and E. Demir. 2020. “Infected Markets: Novel Coronavirus, Government Interventions, and Stock Return Volatility around the Globe,”
Finance Research Letters , vol. 35.