

- EAER>
- Journal Archive>
- Contents>
- articleView
Contents
Citation
| No | Title |
|---|---|
| 1 | Comparative analysis of multilateral contributions by Japan and South Korea: focusing on the multi-bi portfolio / 2023 / Development Studies Research / vol.10, no.1, |
Article View
East Asian Economic Review Vol. 25, No. 4, 2021. pp. 339-360.
DOI https://dx.doi.org/10.11644/KIEP.EAER.2021.25.4.400
Number of citation : 1View
105
Download
82
Strategic Portfolio Building in Donors’ Multilateral Institutional Choice
|
|
KDI School of Public Policy and Management |
|---|

Abstract
More donors are formally assessing their multilateral aid disbursement policies as well as the multilateral institutions that they contribute to. Analyzing OECD Creditor Reporting System data from 2011 to 2019 of 23 donors and 34 multilateral organizations, we find evidence of institutional portfolio building of donors to align multilateral and bilateral aid channels. Such tendency is more pronounced for core-funding than multi-bi funding and much stronger at the recipient country level than at the sectoral level. Smaller donors that operate from a limited multilateral budget show greater preferences for geographical similarity. When donors give to institutions with sectoral specialization, they seek sectoral similarity with their bilateral aid.
JEL Classification: F35, F53, O1
Keywords
Multilateral Aid, Multi-bi Aid, Sector Complementarity, Geographical Complementarity, Multilateral Institution Portfolio
I. Introduction
With the renewal of the pledge to donate 0.7% GNI as Official Development Assistance (ODA) in 2005, donors have increasingly begun to utilize multilateral organizations as a channel of aid disbursement. In 2018, total multilateral aid reached USD 71.9 billion, accounting for approximately 38% of gross official development assistance (OECD, 2020, p. 19).
While multilateral contributions have been on the rise, how donors allocate funds across different organizations is still very much unknown. Unlike bilateral aid that has been under greater scrutiny, multilateral aid had avoided being evaluated until the early 2010s mostly because of the difficulty of tracking down how the money is being used in an organization. The global financial crisis of 2008 and the European debt crisis of 2011, however, have made donors and their constituents become more sensitive to budget use1 and multilateral aid allocation was no exception. Since 2011, donors such as the UK, Sweden, Australia, and Germany have begun to formally assess their multilateral aid disbursement policies as well as the multilateral institutions that they contribute to.
The purpose of this paper is to examine the level of donors’ contribution to different multilateral organizations and its relation to their bilateral aid allocation decisions. Is there “institutional portfolio building” (Schenider and Tobin, 2011)2 when donors delegate to multilateral organizations? Multilateral organizations are known to have stronger sectoral specialization than bilateral donors (OECD, 2020, p. 95). Is there evidence that donors are making use of this comparative advantage? To answer these questions, we study whether donors’ use of bilateral and multilateral channels shows geographical or sectoral complementarities.
We assume that donors employ the two channels accordingly to maximize their utility from foreign aid. The benefits of a donor using the multilateral channel over the bilateral one to address specific regions or sectors may rise from taking advantage of the organizations’ specialization in specific regions or sectors (OECD, 2020). On the other hand, the benefits of employing both channels for the same region or sector may come from the increasing returns in aid effectiveness when doing so (Greenhill and Rabinowitz, 2016; Tadesse et al., 2017). The costs of delegation are common: when giving to multilateral institutions, donors no longer have the same level of control over projects or programs, and interests are diluted from there being multiple donors in the institution (Schneider and Tobin, 2016).
Using OECD Creditor Reporting System (CRS) data from 2011 to 2019 of 23 Development Assistance Committee (DAC) donors and 34 multilateral organizations, we first calculate complementary indices between each organization’s contribution patterns and donor’s bilateral contribution patterns at the recipient country and sectoral levels. We then conduct fixed effects panel analysis and system-GMM analysis to study whether donors’ contributions to multilateral organizations show sectoral as well as geographical complementarities.
Many papers have explored why donors delegate to multilateral organizations (Rodrik, 1996; Addison et al., 2004; Martens, 2005; Powell and Bobba, 2006; Milner and Tingley, 2013; Bourguignon and Platteau, 2015; Greenhill and Rabinowitz, 2016; Tadesse et al., 2017; OECD, 2020), but to which institutions and by how much they delegate have rarely been studied (Schenider and Tobin [2016] is an exception). The value-added of our work comes from utilizing recent data in the OECD CRS to explore the role of portfolio complementarities and conducting subsample analysis to examine the underlying mechanism of multilateral institution choice. Scholars have previously used reported data at the donor level for sector analysis which has problems of inaccuracy and missing data (Schenider and Tobin, 2016, p. 654). CRS tracks ODA flows based on individual projects, which allows us to precisely assess contributors’ sectoral contribution levels. We also break down multilateral aid into multi-bi and core-funding. Given that donors have greater control over multi-bi aid, comparing the two aid patterns will give us insight into how donors use the multilateral channel.
We find evidence of institutional portfolio building of donors but the extent to which donors engage in such strategic behavior depends on donor as well as multilateral institution characteristics. Destination overlap matters much more than sector similarity, and more for core-funding than multi-bi aid. Smaller multilateral donors and donors giving to sector-specializing multilateral organizations seek greater alignment of their bilateral aid and multilateral organizations.
The remainder of the paper is structured as follows. chapter II is the literature review, chapter III describes data and estimation strategy, chapter IV shows results, chapter V presents a discussion, and chapter V concludes.
1)Andrew Mitchell, the Secretary of State for International Development of the UK, have made a speech in 2010 that the government needs to “ensure that aid secures 100 pence of value for every hard-earned British taxpayer’s pound we spend.”
2)
II. Literature Review
Reasons for choosing to donate to multilateral aid are numerous. From the donors’ perspective, multilateral aid effectively lowers the domestic transaction cost of aid delivery – donor governments use the multilateral channel when citizens’ information of aid is insufficient or their preferences on aid disbursement are weak (Milner, 2006). Multilateral organizations can provide information, perform monitoring, and improve targeting to enhance aid coordination and effectiveness (Rodrik, 1996; Bourguignon and Platteau, 2015; Greenhill and Rabinowitz, 2016; OECD, 2020). Some issues – such as environment, terrorism, poverty, or the pandemic – are inherently multilateral, which may demand such coordinated efforts. Multilateral organizations may also mediate between the diverging preferences of donors and recipients (Martens, 2005; Powell and Bobba, 2006). While there is not yet consistent evidence that either multilateral or bilateral aid is more effective (Biscaye et al., 2017), there exists research showing that the two channels can be complementary in enhancing aid effectiveness (Tadesse et al., 2017), which gives donors a rationale to strategically utilize multilateral aid.
To maximize the benefits of multilateral aid, donors may shape the disbursement patterns of the organizations that they contribute to or may choose organizations with certain disbursement patterns that they prefer. For instance, Neumayer (2003) finds that selected regional multilateral development banks and UN agencies gave more aid to countries with a longer experience of colonization by an OECD country. Dreher et al. (2009) find that temporary UN Security Council members received a greater number of Work Bank projects. Barro and Lee (2005) find in their study of IMF lending determinants that countries with greater bilateral trade share with the US and those that vote with the US, France, Germany, and the UK in the UN received larger and more frequent loans.
McLean (2012) finds that EU donors’ contribution to the EU, International Development Association, and the UN during the period 1960-2007 went up when the policy preferences of the members in the respective organizations measured by the UN General Assembly voting patterns were more in line with their own. McLean (2015) using 24 donors’ multilateral aid allocations to two environmental multilateral organizations – Multilateral Fund and GEF – from 1994 to 2001, finds that when donors’ domestic economic groups were likely to gain from opportunities created by the programs of the organizations, they increased contributions. Based on case studies of six countries, Australia, Belgium, Brazil, France, Norway, and the US, Greenhill and Rabinowitz (2016) find that donors appeared to delegate to multinational organizations that match their sectoral and thematic priorities rather than those that complement them. Whether donors’ bilateral geographical priorities are reflected in their organization choice was not clear. While there is evidence that some donors allocated contributions to organizations that fund recipient countries that they do not have bilateral programs (for instance, Norway, France, and Belgium), there were reports of donors such as Australia where both multilateral and bilateral contributions showed the same regional focus.
Schneider and Tobin (2016) examine the question of donor’s multilateral organization contribution choice using 22 OECD donors and 12 multilateral organizations from 1970 to 2008. Analyzing total multilateral aid without commitments to trust funds, they show that governments delegated to organizations that showed portfolio similarity with their bilateral aid in terms of geography as well as sector. They argue that such behavior is to minimize the losses from delegation. Our work differs from them in using recent project-based aid flow data that are known to be more accurate in sector categorization. We also analyze close to thrice as more multilateral organizations and break down multilateral aid to multi-bi and core-funding to get a better understanding of the mechanism behind multilateral aid decisions.
III. Data and Methods
We use gross commitment data from the OECD DAC development statistics3 for the years from 2011 to 2019. For bilateral aid and multilateral organization’s aid gross commitments across different recipient countries and sectors, we use the CRS. For donors’ yearly commitments to each multilateral organization, we take the core contributions (“aid to”) and earmarked contributions (“aid through”) in the Members’ total use of the multilateral system in the CRS. The latter data is only available from 2011 and onwards. We analyze all multilateral organizations that are listed in both databases – 34 multilateral organizations4 and 23 DAC donors.5
1. Dependent Variable
The dependent variable
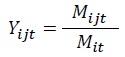
where
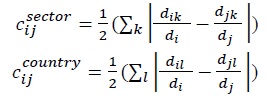
2. Key Explanatory Variables
Our key explanatory variables are the extent of complementarity of gross bilateral aid disbursements of donors and multilateral organizations at the sector and the recipient country levels. There are different ways in which we can calculate how closely the disbursement patterns match. We borrow from the trade literature and use the trade compatibility index introduced by Michaely (1996).7 For sector complementarity  we compare the share of donor i’s sector k bilateral aid disbursement (
Similarly, for recipient country or geographical complementarity  we compare the share of donor i’s bilateral aid contributions to recipient l (
3. Control Variables
We use the set of controls that are known to influence multilateral aid disbursement following closely McLean (2015) and Schneider and Tobin (2011; 2016). The set of controls are multilateral organization-specific: we capture the influence of a donor in an organization by calculating the share of donor GDP in the total GDP of all members. Greater economic powers not only contribute more to organizations and thus have a greater say but also have other political-economic means to dominate the decision-making (Mascarenhas and Sandler, 2006; Neumayer, 2003). To account for the relative importance of the organization in the aid industry, which can influence donors to join in as a member or increase contributions, we control for the number of DAC donors in the membership of the organization. We also control for the level of expertise as well as the effectiveness of the organization using its age. Finally, using UN voting records, we calculate the S-score (Signorino and Ritter, 1999) on how closely the donor votes with the US – the systems leader – and interact it with the membership of the US in the organization. The S-score is supposed to capture the extent of donor countries’ strategic relationship with the US: we expect that if a donor votes closely with the US in the UN, then if the US is a member of the organization, the donor is likely to give more aid (McLean, 2015). The data for membership of multilateral organizations comes from the Correlates of War Project (Pevehouse et al., 2020). We lag all independent variables by one year to reflect the fact that the donors’ decision-making environment and multilateral organizations’ characteristics take time in affecting donors’ multilateral contribution patterns. This is standard in the literature.
4. Empirical Model
We first estimate a panel fixed effects model described below:

 is sector complementarity, and
  is recipient complementarity.
The country and sector complementarity variables may be endogenous: an organization’s aid portfolio may be similar to a donor’s bilateral one because the donor disburses a significant amount to the organization and shapes the direction it takes in terms of sectoral and geographical priorities. Given such endogeneity, the above fixed effects estimation strategy will overestimate the importance of portfolio similarity in contribution decisions. Thus, following Schneider and Tobin (2016), we use a two-step System Generalized Methods of Moments (SGMM) estimator with Windmeijer-corrected cluster robust errors and orthogonal deviations to estimate the below level equation and its first difference equation:


Here, lagged differences of the complementarity indices are used as instruments in the level equation (2) and lagged levels of the complementarity indices are used as instruments in the difference equation (3). We use lags 4 and above to avoid autocorrelation of the errors. All other control variables are assumed to be predetermined but not strictly exogenous. To test for validity of the instruments, we perform a Hansen-J test of over-identifying restrictions and report p values for the Arellano Bond test for the autocorrelation of the residuals.
3)The data is downloadable from OECD development statistics:
4)Adaptation Fund, African Development Bank, African Development Fund, Asian Development Bank, Caribbean Development Bank, Center of Excellence in Finance, Council of Europe Development Bank, EU Institutions, Food and Agriculture Organisation, Global Alliance for Vaccines and Immunization, Global Environment Facility, Global Fund, Green Climate Fund, IFAD, Inter-American Development Bank, International Atomic Energy Agency, International Development Association, International Labour Organisation, International Monetary Fund, Islamic Development Bank, Nordic Development Fund, OSCE, UN Peacebuilding Fund, UNAIDS, UNDP, UNECE, UNEP, UNFPA, UNHCR, UNICEF, UNRWA, WFP, World Health Organisation, World Tourism Organisation.
5)Australia, Austria, Belgium, Canada, Denmark, Finland, France, Germany, Greece, Ireland, Italy, Japan, Korea, Luxembourg, Netherlands, New Zealand, Norway, Portugal, Spain, Sweden, Switzerland, United Kingdom, United States.
6)The aid literature uses commitment data to explore intentions behind aid decisions: actual disbursements can be volatile. Because our time period is only 9 years, we do not average out the values over three years.
7)A variation of the index is used in
8)Sectors used: Education, Health, Population Policies/Programmes & Reproductive Health, Water Supply & Sanitation, Government & Civil Society, Other Social Infrastructure & Services, Transport & Storage, Communications, Energy, Banking & Financial Services, Business & Other Services, Agriculture, Forestry, Fishing, Industry, Mining, Construction, Trade Policies & Regulations, Tourism, General Environment Protection, Other Multisector, General Budget Support, Development Food Assistance, Other Commodity Assistance, Action Relating to Debt, Emergency Response, Reconstruction Relief & Rehabilitation, Disaster Prevention & Preparedness, Administrative Costs of Donors, Refugees in Donor Countries, Unallocated / Unspecified.
IV. Main Results
Table 2 shows the main results. We find that with greater similarity in destinations, donors tend to give more multi-bi and core funding to the organization for both our fixed effects and system-GMM estimates. Since bilateral aid is often driven by political and economic ties, the result is consistent with the existing literature showing that recipients receive more multilateral aid if they have political and economic ties with the donors of the multilateral organizations (Neumayer, 2003; Dreher et al., 2009; Barro and Lee, 2005).
Because the fixed effects estimation fails to take into account possible endogeneity of the complementarity indices, it overestimates the importance of the portfolio similarity on contribution decisions vis-à-vis the System-GMM results. Compared with an organization that has an identical geographical destination pattern with a donor, the fixed effects estimation shows that an organization that has a completely different geographical destination pattern garners 15.9%p less multi-bi contributions and 18.7%p less core-funding from the donor. The System-GMM estimation finds 7.4%p less for multi-bi contributions and 13.2%p less for core-funding. What is interesting here is the difference in the extent of such strategic behavior. While donors prefer institutions that have similar geographical destinations, when donors have a greater say in the direction of funds as in multi-bi aid, donors diversify their aid portfolio slightly by choosing organizations that have contribution patterns less like their own.
For sector, we see that while the fixed effects estimation shows that the multi-bi as well as core funding are larger for the institutions with sectoral similarity, the System-GMM estimation shows that sector similarity plays a positive role only for core funding: compared with an organization that has an identical sectoral contribution pattern with a donor, an organization that has a completely different sectoral contribution pattern garners 6.90%p less core-funding. Sector complementarity plays no role in determining multi-bi aid destinations. These results are consistent with the findings of Schneider and Tobin (2016) of periods 1970 to 2008: the aid portfolios of donors and their core-funding recipients have geographical as well as sectoral similarities. Core-funding is close to choosing membership to an organization and is usually determined based on the donors’ economic and political power. It is unlikely that membership decisions would have changed since 2008.
What is interesting is the lack of role that sector similarity plays in choosing multi-bi destinations for our current data. There can be two explanations for this. First, multi-bi funding may always have been more likely to be used to diversify donors’ aid portfolio in terms of sector. Multi-bi funding is not mandatory and it may be more likely to be employed when the donor is interested in utilizing the partner institution’s comparative advantage addressing a certain country or sector. Second, given that the coefficients here are average effects, it could be that this is a more recent phenomenon driven by behaviors of certain donors that have begun to approach multilateral aid more systematically than before paying greater attention to the benefits of specialization of aid channels (OECD, 2015, p. 14).
V. Discussion
1. Membership
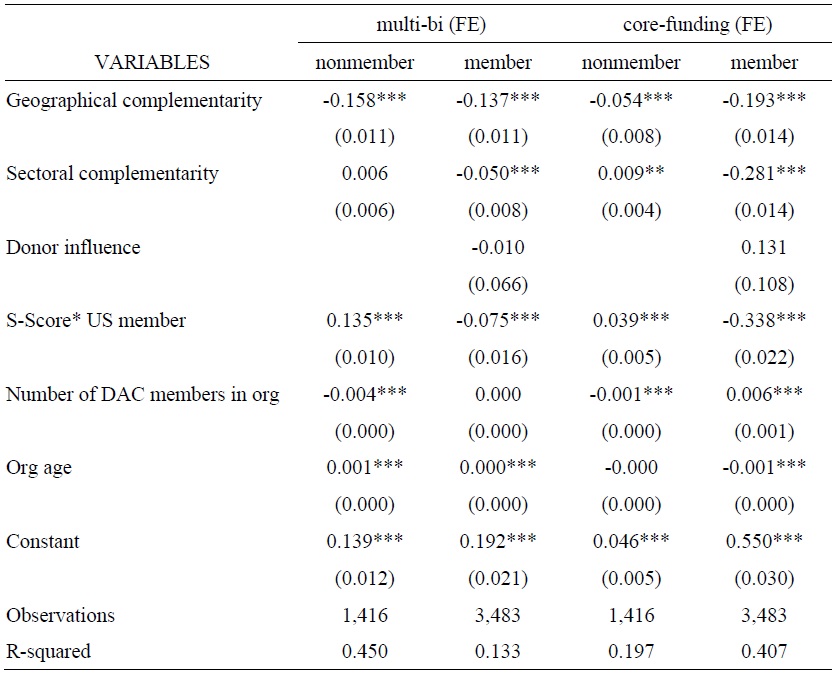
Because one’s contributions patterns could differ depending on whether you are a member of the organization or not (non-members give to multilateral organizations too), we divide the sample into two: a nonmember sample and a member sample. We only discuss system-GMM analysis results here.9 Table 3 presents the results.
We find that donors that are multilateral institution members are likely to seek geographical similarities, but more so for core-funding than multi-bi funding. When a donor is a member, an organization that shows perfect geographical complementarity will attract 6.70%p less multi-bi contributions and 14.1%p less core-funding than an organization that shows perfect similarity. The pursuit for sector similarity is only pronounced for core-funding. For multi-bi aid, there is no evidence of strategic portfolio building.
Nonmember donors when making a multi-bi contribution decision prefers organizations that focus on countries that they support bilaterally. An organization with perfect geographical similarity will attract 8.8%p more multi-bi contributions. Interestingly, we do not find any statistically significant preferences regarding sector choice. The weak but positive sign implies that nonmembers may be using the multi-bi channel to diversify their foreign aid portfolio in terms of sector.
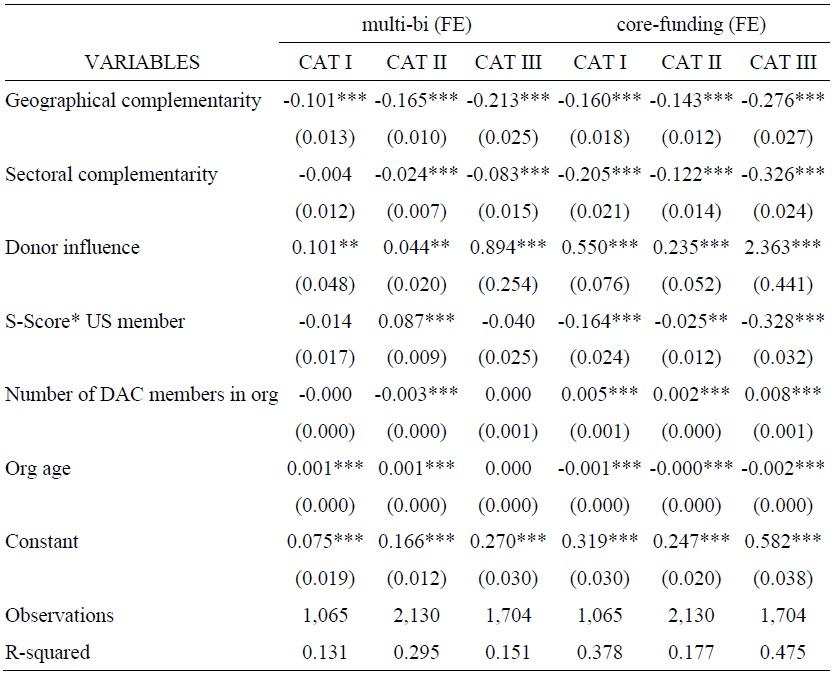
2. Multilateral Aid Size
Here we group the donors into three categories depending on their share of multilateral aid in total aid contributions and their level of multilateral aid. The donors and categories are depicted in Picture 1. Donors in Category I have high levels of multilateral aid but low shares of multilateral aid in total aid. Those in Category II have relatively low levels and shares of multilateral aid. Those in category III have relatively low levels but high shares of multilateral aid in total aid.
We first note here that categorizing donors in such a way, strategic portfolio building in terms of sector disappears entirely for core-funding as well as multi-bi funding in our System-GMM estimation. So there is no evidence of sectoral portfolio building in donors’ multilateral institution choice. There is no statistically significant evidence that Category I donors build their multilateral institutional portfolio in terms of the geographical region in our system-GMM estimation. Given our fixed effects results in Appendix Table 2 which show that Category I donors’ contributions tend to be greater for institutions with greater geographical similarities, we conclude that most of this effect is derived from these donors having greater capacity to influence or shape the direction of multilateral organization’s geographical or sectoral focus (Mascarenhas and Sandler, 2006; Neumayer, 2003).
There are strong preferences for small and medium sized donors (Category II and III) for geographical similarity. When a donor is a Category II donor, an organization with perfect geographical similarity attracts 6.6%p more multi-bi contributions and 15.4%p more core-funding than an organization with perfect geographical complementarity. While these donors operate a small multilateral budget, they are medium sized players in the foreign aid industry with a relatively large bilateral budget. The alignment of bilateral and multilateral channels in foreign aid is shown to enhance aid effectiveness (Tadesse et al., 2017). With a limited multilateral budget, Category II donors are the ones that are trying to maximize their effectiveness of aid. Note here that the tendency to pursue geographical similarities is not as pronounced for multi-bi aid compared to core-funding, implying that if donors use multilateral institutions to diversify the aid portfolio, it would be through the multi-bi channel for them.
Being heavy users of the multilateral channel but small in overall contribution size, Category III donors are preference takers rather than preference setters. While for both multi-bi aid and core funding we see these donors contributing more to institutions which have aligning geographical portfolios, it is only statistically significant for multi-bi aid.
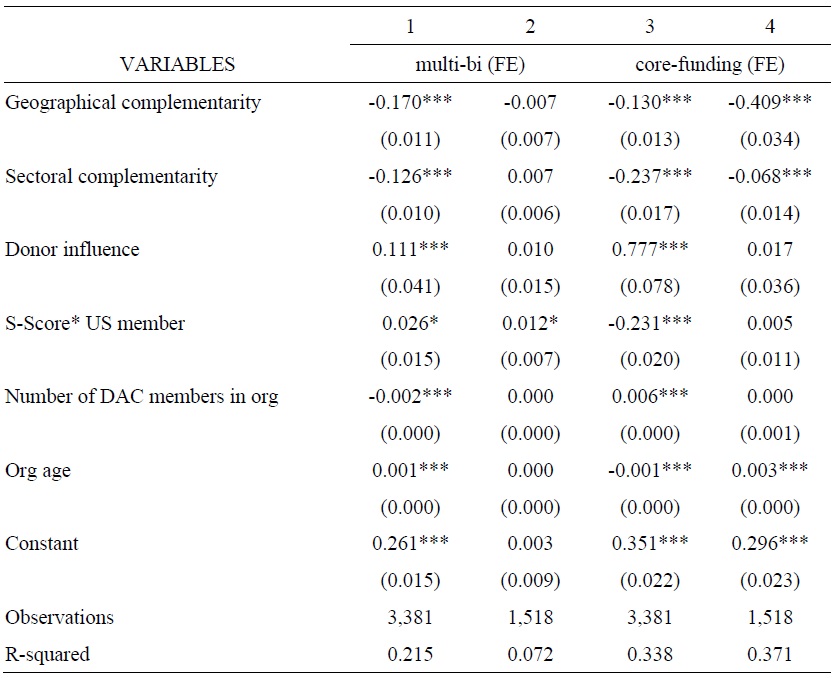
3. Multilateral Development Banks and Others
The final analysis is to separate multilateral development banks from other multilateral institutions and see whether donors have different strategies towards different types. While multilateral development banks are global and regional financial institutions that support general development agendas, the other organizations tend to have a sectoral focus. Thus, it is not surprising that for donor contributions to multilateral development banks, we do not find any significant sector complementarity.
For non-multilateral development banks, organizations with perfect sectoral complementarity garner 8.3%p less core-funding contributions than those with perfect sectoral portfolio similarity. We take this as evidence that when giving to organizations with stronger sectoral specialization, donors do look for sector similarity.
9)Appendix
VI. Conclusion
This paper looked for evidence of institutional portfolio building in international development cooperation by examining whether a DAC donor’s support for a multilateral organization is associated with the extent of geographical and sectoral complementarities between the organization and the donor’s bilateral aid commitment patterns.
The analysis of OECD CRS data from 2011 to 2019 suggests that while there exists evidence of institutional portfolio building of donors, it is more pronounced for core-funding than multi-bi funding and much stronger at the recipient country level than at the sectoral level. It seems like donors contribute to multilateral organizations not to diversify their portfolio but to align their multilateral channel with the bilateral one, especially for geographical priorities. We find that smaller multilateral donors are more strategic in their institutional portfolio building. When donors choose organizations that specialize in certain sectors, they look for sectoral alignment of their bilateral and multilateral channels.
Why donors in general do not take advantage of the sectoral and geographical specialization of the institutions remains to be answered. It could be that increasing returns from aligning sectoral and geographical priorities may outweigh the benefits of conducting programs in unfamiliar regions or sectors. The question may be addressed in future research.
Tables & Figures
Table 1.
Summary Statistics
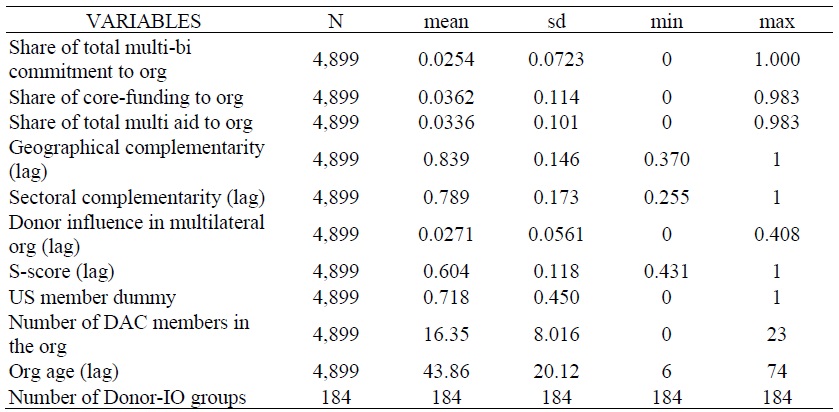
Notes: This table shows summary statistics of the dependent variables – share of total multilateral aid, multi-bi aid, and core funding commitments to an organization. Key independent variables – sectoral and geographical complementarities, and control variables are presented.
Table 2.
Multilateral Allocation and Complementarities
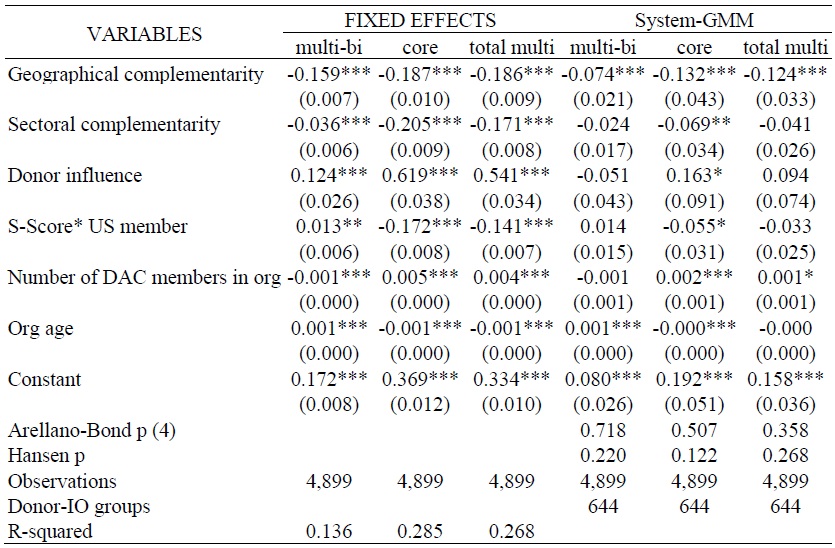
Notes: Standard errors in parentheses, *** p<0.01, ** p<0.05, * p<0.1. These are the fixed-effects (year and donor) panel and system-GMM analyses results. The dependent variable is donor i’s share of gross commitment of multi-bi, core-funding or total multilateral aid to organization j in i’s total gross commitment of multi-bi, core-funding or total multilateral aid in year t. Key independent variables are geographical complementarity and sectoral complementarity indices. The controls include the extent of donor influence in an organization, an interaction term of S-score and US membership, number of DAC members in the organization, and organization age.
Table 3.
Membership Analysis
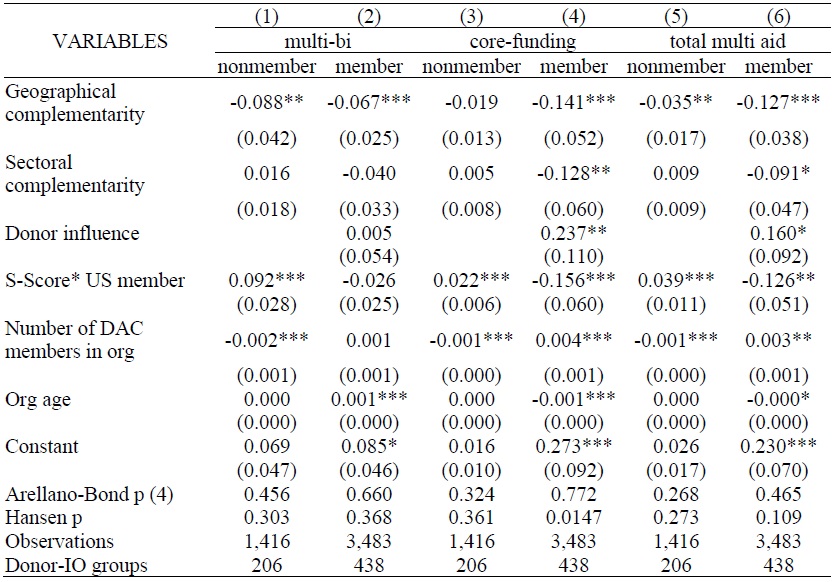
Note: Standard errors in parentheses, *** p<0.01, ** p<0.05, * p<0.1. These are the system-GMM analyses results. The dependent variable is donor i’s share of gross commitment of multi-bi, core-funding or total multilateral aid to organization j in i’s total gross commitment of multi-bi, core-funding or total multilateral aid in year t. Key independent variables are geographical complementarity and sectoral complementarity indices. The controls include the extent of donor influence in an organization, an interaction term of S-score and US membership, number of DAC members in the organization, and organization age. We divide the sample into two: nonmembers are donor-organization pairs where the donor is not a member of an organization. Members are donor-organization pairs where the donor is a member of an organization.
Figure 1.
Categorization of Donors Based on Multilateral Aid Size
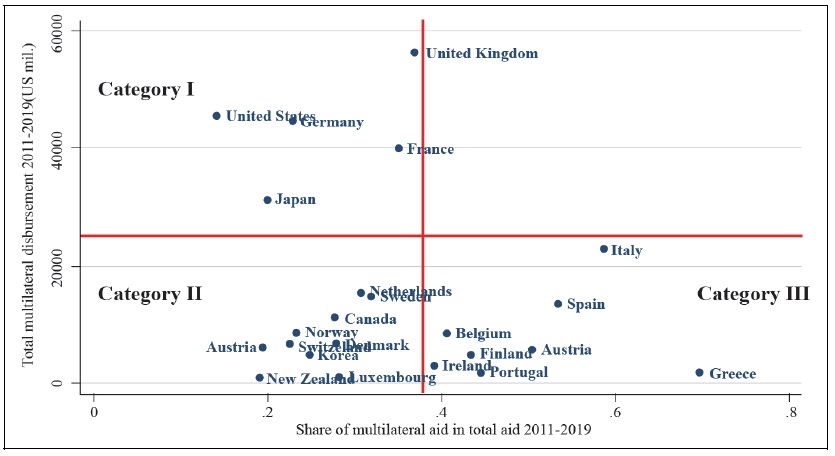
Notes: This picture scatter plots the relationship of the share of multilateral aid in total aid and total level multilateral aid disbursement to categorize donors into different groups. X-axis is the share of multilateral aid in total aid from 2011-2019 and Y-axis is the total multilateral aid disbursed from 2011-2019, both including multi-bi aid.
Table 4.
Multilateral Aid Size Analysis
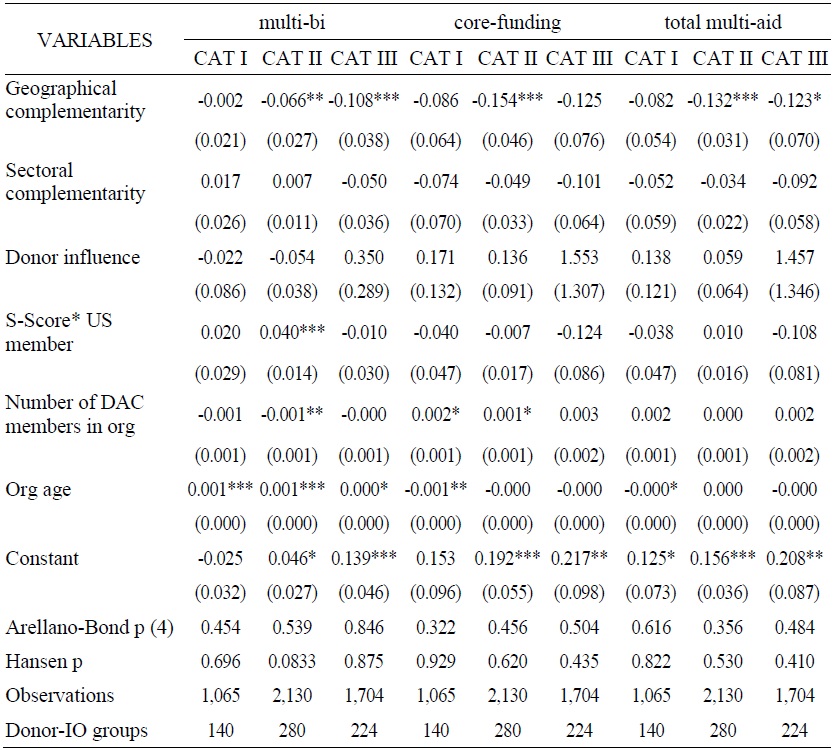
Notes: Standard errors in parentheses, *** p<0.01, ** p<0.05, * p<0.1. These are the system-GMM analyses results. The dependent variable is donor i’s share of gross commitment of multi-bi, core-funding or total multilateral aid to organization j in i’s total gross commitment of multi-bi, core-funding or total multilateral aid in year t. Key independent variables are geographical complementarity and sectoral complementarity indices. The controls include the extent of donor influence in an organization, an interaction term of S-score and US membership, number of DAC members in the organization, and organization age. We divide the sample into three categories based on their share of multilateral aid in total aid disbursement and their level of multilateral aid. Category I donors are UK, US, Germany, France, and Japan. Category II donors are Netherlands, Sweden, Canada, Norway, Australia, Switzerland, Denmark, Korea, Luxembourg, and New Zealand. Category III donors are Italy, Spain, Belgium, Austria, Finland, Ireland, Portugal, and Greece.
Table 5.
Multilateral Development Banks and the Rest
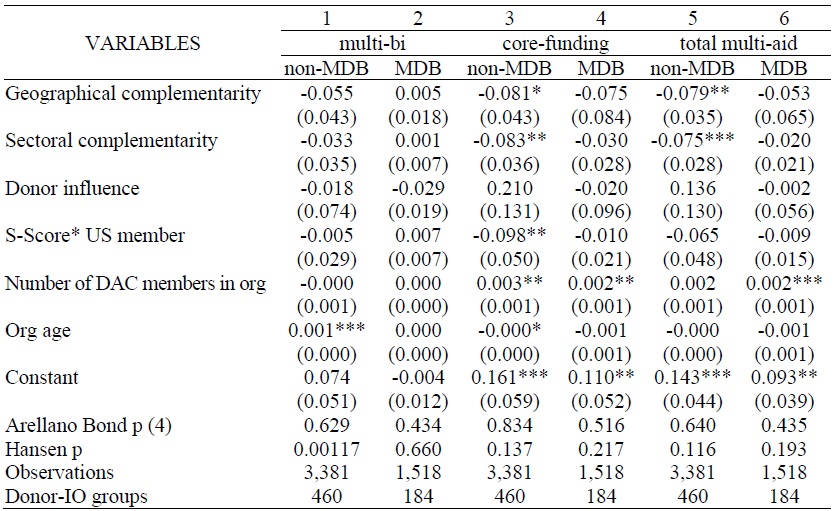
Notes: Standard errors in parentheses, *** p<0.01, ** p<0.05, * p<0.1. These are the system-GMM analyses results. The dependent variable is donor i’s share of gross commitment of multi-bi, core-funding or total multilateral aid to organization j in i’s total gross commitment of multi-bi, core-funding or total multilateral aid in year t. Key independent variables are geographical complementarity and sectoral complementarity indices. The controls include the extent of donor influence in an organization, an interaction term of S-score and US membership, number of DAC members in the organization, and organization age. Multilateral development banks include the African Development Bank, African Development Fund, Asian Development Bank, Caribbean Development Bank, Council of Europe Development Bank, Inter-American Development Bank, International Development Association (World Bank), and Islamic Development Bank.
APPENDIX
Appendix Tables & Figures
Table A1.
Membership Analysis (Fixed Effects)
Notes: Standard errors in parentheses, *** p<0.01, ** p<0.05, * p<0.1. These are the donor and year fixed-effects panel analyses results. The dependent variable is donor i’s share of gross commitment of multi-bi, core-funding or total multilateral aid to organization j in i’s total gross commitment of multi-bi, core-funding or total multilateral aid in year t. Key independent variables are geographical complementarity and sectoral complementarity indices. The controls include the extent of donor influence in an organization, an interaction term of S-score and US membership, number of DAC members in the organization, and organization age.
Table A2.
Donor Size Analysis (Fixed Effects)
Notes: Standard errors in parentheses, *** p<0.01, ** p<0.05, * p<0.1. These are the donor and year fixed-effects panel analyses results. The dependent variable is donor i’s share of gross commitment of multi-bi, core-funding or total multilateral aid to organization j in i’s total gross commitment of multi-bi, core-funding or total multilateral aid in year t. Key independent variables are geographical complementarity and sectoral complementarity indices. The controls include the extent of donor influence in an organization, an interaction term of S-score and US membership, number of DAC members in the organization, and organization age. We divide the sample into three categories based on their share of multilateral aid in total aid disbursement and their level of multilateral aid. Category I donors are UK, US, Germany, France, and Japan. Category II donors are Netherlands, Sweden, Canada, Norway, Australia, Switzerland, Denmark, Korea, Luxembourg, and New Zealand. Category III donors are Italy, Spain, Belgium, Austria, Finland, Ireland, Portugal, and Greece.
Table A3.
Multilateral Development Banks and Donor Contribution (Fixed Effects)
Notes: Standard errors in parentheses, *** p<0.01, ** p<0.05, * p<0.1. These are the donor and year fixed-effects panel analyses results. The dependent variable is donor i’s share of gross commitment of multi-bi, core-funding or total multilateral aid to organization j in i’s total gross commitment of multi-bi, core-funding or total multilateral aid in year t. Key independent variables are geographical complementarity and sectoral complementarity indices. The controls include the extent of donor influence in an organization, an interaction term of S-score and US membership, number of DAC members in the organization, and organization age. Multilateral development banks include African Development Bank, African Development Fund, Asian Development Bank, Caribbean Development Bank, Council of Europe Development Bank, Inter-American Development Bank, International Development Association (World Bank), and Islamic Development Bank.
References
-
Addison, T., McGillivray, M. and M. Odedokun. 2004. “Donor Funding of Multilateral Aid Agencies: Determining Factors and Revealed Burden Sharing.”
The World Economy , vol. 27, no. 2, pp. 173-191.
-
Barro, R. J. and J.-W. Lee. 2005. “IMF Programs: Who Is Chosen and What Are the Effects?”
Journal of Monetary Economics , vol. 52, no. 7, pp. 1245-1269.
-
Biscaye, P. E., Reynolds, T. W. and C. L. Anderson. 2017. “Relative Effectiveness of Bilateral and Multilateral Aid on Development Outcomes.”
Review of Development Economics , vol. 21, no. 4, pp. 1425-1447.
-
Bourguignon, F. and J.-P. Platteau. 2015. “The Hard Challenge of Aid Coordination.”
World Development , vol. 69, pp. 86-97.
-
Dreher, A., Sturm, J.-E. and J. R. Vreeland. 2009. “Development Aid and International Politics: Does Membership on the UN Security Council Influence World Bank Decisions?”
Journal of Development Economics , vol. 88, no. 1, pp. 1-18.
-
Greenhill, R. and G. Rabinowitz. 2016. Why Do Donors Delegate to Multilateral Organizations? A Synthesis of Six Country Case Studies. Research Report. ODI.org.
https://cdn.odi.org/media/documents/11088.pdf (accessed September 7, 2021) -
Hawkins, D. G., Lake, D. A., Nielson, D. L. and M. J. Tierney. eds. 2006.
Delegation and Agency in International Organizations , Cambridge, U.K.: Cambridge University Press. -
Martens, B. 2005. “Why Do Aid Agencies Exist?”
Development Policy Review , vol. 23, no. 6, pp. 643-663.
-
Mascarenhas, R. and T. Sandler. 2006. “Do Donors Cooperatively Fund Foreign Aid?”
Review of International Organizations , vol. 1, pp. 337-357.
-
McLean, E. V. 2012. “Donors’ Preferences and Agent Choice: Delegation of European Development Aid.”
International Studies Quarterly , vol. 56, no. 2, pp. 381-395.
-
McLean, E. V. 2015. “Multilateral Aid and Domestic Economic Interests.”
International Organization , vol. 69, no. 1, pp. 97-130.
-
Mitchell, A. 2010. “Andrew Mitchell: Value for Money and A Rigorous Focus on Results for British Aid.” SayIt. (October 5)
https://conservative-speeches.sayit.mysociety.org/speech/601438 (accessed September 7, 2021) -
Michaely, M. 1996. Trade Preferential Agreements in Latin America: An Ex-Ante Assessment. Policy Research Working Papers. World Bank Group.
https://elibrary.worldbank.org/doi/pdf/10.1596/1813-9450-1583 (accessed July 2, 2021) -
Milner, H. V. 2006. “Why Multilateralism? Foreign Aid and Domestic Principal-Agent Problems,” In Hawkins, D. G., Lake, D. A., Nielson, D. L. and M. J. Tierney. (eds.)
Delegation and Agency in International Organizations , Cambridge, U.K.: Cambridge University Press. pp. 107-139. -
Milner, H. V. and D. Tingley. 2013. “The Choice for Multilateralism: Foreign Aid and American Foreign Policy.”
Review of International Organization , vol. 8, no. 3, pp. 313-341.
-
Neumayer, E. 2003. “The Determinants of Aid Allocation by Regional Multilateral Development Banks and United Nations Agencies.”
International Studies Quarterly , vol. 47, no.1, pp. 101-122.
-
Organization for Economic Cooperation and Development (OECD). 2015. Multilateral Aid 2015: Better Partnerships for a Post-2015 World, Highlight.
https://www.oecd.org/dac/aid-architecture/OverviewChapter-MEP.pdf (accessed June 2, 2021) -
Organization for Economic Cooperation and Development (OECD). 2020.
Multilateral Development Finance 2020 . Paris: OECD Publishing.https://www.oecd.org/dac/aid-architecture/OverviewChapter-MEP.pdf (accessed June 2, 2021) -
Pevehouse, J. C., Nordstrom, T., McManus, R. W. and A. S. Jamison. 2020. “Tracking Organizations in the World: The Correlates of War IGO Version 3.0 datasets.”
Journal of Peace Research , vol. 57, no. 3, pp. 492-503.
-
Powell, A. and M. Bobba. 2006. Multilateral Intermediation of Foreign Aid: What Is the Tradeoff for Donor Countries? Working Paper, no. 594. Inter-American Development Bank.
https://publications.iadb.org/publications/english/document/Multilateral-Intermediationof-Foreign-Aid-What-is-the-Trade-Off-for-Donor-Countries.pdf (accessed July 2, 2021) -
Rodrik, D. 1996. “Why Is There Multilateral Lending?” In Bruno, M. and B. Pleskovic. (eds.)
Annual World bank conference on development economics 1995 , Washington D.C.: The World Bank. pp. 167-206. -
Schneider, C. J. and J. L. Tobin. 2011. Eenie, Meenie, Miney, Moe? Institutional Portfolios and Delegation to Multilateral Aid Institutions.
https://leitner.yale.edu/sites/default/files/files/resources/papers/schneider_tobin_leitner.pdf (accessed June 2, 2021) -
Schneider, C. J. and J. L. Tobin. 2016. “Portfolio Similarity and International Development Aid.”
International Studies Quarterly , vol. 60, no. 4, pp. 647-664.
-
Signorino, C. S. and J. M. Ritter. 1999. “Tau-b or Not Tau-b: Measuring the Similarity of Foreign Policy Positions.”
International Studies Quarterly , vol. 43, no. 1, pp. 115-144.
-
Tadesse, B., Shukralla, E. and B. Fayissa. 2017. “Are Bilateral and Multilateral Aid-for-Trade Complementary?”
The World Economy , vol. 40, no. 10, pp. 2125-2152.