

- EAER>
- Journal Archive>
- Contents>
- articleView
Contents
Citation
| No | Title |
|---|---|
| 1 | Servitization and firm productivity premium across the product value chain: evidence from Russian manufacturing firms / 2024 / Journal of Business & Industrial Marketing |
Article View
East Asian Economic Review Vol. 26, No. 4, 2022. pp. 257-277.
DOI https://dx.doi.org/10.11644/KIEP.EAER.2022.26.4.413
Number of citation : 1View
132
Download
64
Servitization and Manufacturing Firms’ Performance: Korean Firm-Level Data Evidence
|
|
Sogang University |
|---|---|
|
|
Korea Institute for International Economic Policy |

Abstract
Does servitization improve manufacturing firms’ performance, and in what condition? Following the seminal work of
JEL Classification: L25, M20, O31
Keywords
Servitization, Manufacturing, Firm Performance, Productivity
I. Introduction
Recently, manufacturing firms increasingly use services in their production process and sell services in the markets to effectively use, maintain, or upgrade their manufacturing products. In the business literature, services have been considered as components of production for a long time,1 but recently it is apparent that services as economic activities and sectors play an important role in the global economy. It is important to understand why manufacturing firms may want to focus more on services nowadays, but very few economic studies have been focused on this topic so far.
The manufacturing sector is increasingly relying on services, whether as inputs, as activities within firms or as output sold bundled with goods, which is the so-called “servicification” of manufacturing.2 Manufacturing firms use more services such as logistics, finance, engineering, R&D, design, marketing, and advertising produced internally or externally in the production of goods. In practice, although services account for an increasing proportion in the manufacturing industry, it is hard to distinguish services for inputs, activities within firms, or output sold bundled with goods without firms’ detailed input-output data.
As a specific business strategy of manufacturing firms, the production and sales of services as final products of manufacturing firms, mostly bundled with manufacturing goods, which is called “servitization” of manufacturing,3 is also emerging. For example, Apple Inc. produces electronic goods such as iMacs, iPhones, and iPads, but also provides various services bundled with their products to users through iTunes and App stores, creating a new Apple product ecosystem. A recent figure from Apple Inc. shows that its service products account for about 20% of its total revenues.4 As digital transformation accelerates, this convergence between goods and services becomes a major source of industrial competitiveness. More manufacturing enterprises provide services away from simply providing products.
This study scrutinizes the servitization of the Korean manufacturing sector with detailed firm-level final product sales data from the “Survey of Business Activities,” which is the key database of this study. While the existing related literature mainly focuses on case analysis and conducts based on small-size surveys, this study employs big data for servitization to investigate the status of manufacturing services in the overall economy. As far as we understand, this is the first paper to address firm-level “servitization” of the Korean manufacturing sector while Cho et al. (2018) and Lee (2022) use different industry-level Korean data to address industry-level servicification and in-house service activities.
We use firm-level servitization intensity with available sales data of each firm by two-digit SIC sub-sectors, following the seminal work of Crozet and Milet (2017), and answer the following questions: 1) Is servitization important in the Korean manufacturing sector? 2) Are the servitized manufacturing firms different from others? 3) Does servitization improve manufacturing firms’ performance?
We find that the proportion of service sales in the total sales of manufacturing companies increased significantly, albeit gradually between 2012 and 2019, but the Korean distribution of service intensity shows a very different shape from the French benchmark’s bi-modal distribution in Crozet and Milet (2017). The Korean distribution is more skewed toward the right compared to the French benchmark which has a clear bi-modal shape.
We also analyze the effect of servitization on firm performance indicators such as profitability, total sales, employment, and productivity measures. As many previous studies fail to find a linear relationship between servitization and firms’ performance measures, we empirically study the servitization premia to compare firms’ performance between servitized firms and non-servitized firms and perform a robustness analysis with the quantile regressions to check any non-linear relationship between servitization and firms’ performance measures. It shows that servitization in manufacturing in Korea has a positive effect on both the profits and productivity of servitized firms. It can be interpreted that in the recent trend toward servitization of manufacturing in Korea, the effect of increasing firms’ productivity and profits through servitization was stronger than the effect of intensifying market competition and lowering the profits due to servitization (paradox of servitization).5 On the other hand, when the long-term trend was controlled, causality between the index related to the firm size, such as employment and servitization was not found.
The rest of the paper is organized as follows. Section II reviews the related literature on the servitization of the manufacturing sector. Section III introduces data and measures of servitization to see the trend of servitization in Korean manufacturing from 2012 to 2019. Section IV develops empirical strategies to examine the research questions, and the results are shown in Section V. Section VI concludes the paper.
1)
2)
3)
4)Apple’s 2022 Q2 Financial Report
5)
II. Related Literature
Fang et al. (2008), Neely (2008), and Crozet and Milet (2017) study the servitization of manufacturing firms and firms’ performance. Fang et al. (2008) look at the effect of servitization on firm values for 477 listed manufacturing companies in the United States from 1990 to 2005. They measure the degree of servitization with the ratio of sales from the service sector to the total sales and the firm value as Tobin’s Q. They found a nonlinear relationship between servitization and firm values that the two variables have a negative relationship at the lower servitization level but turn to a positive correlation above a certain level. The process of servitization starts as a part of the business activities of manufacturing firms, and then service sales expand over time. In this sense, they argue that the beginning of servitization may lower the firm values, but it has a positive effect on the firm values as the service sector expands.
Neely (2008) uses the ORBIS database to compare manufacturing firms that produce services to non-servitized firms among about 12,000 manufacturing firms in the world. Based on the firms’ “description and history” in the ORBIS database, firms that report any words or phrases related to “servitized manufacturers” or “pure-services” in the business description are considered as servitized firms. His results show that service-manufacturing firms’ sales are higher than those of non-service manufacturing firms, but their profit margins are lower, and these phenomena are apparent among large-scale firms. Neely (2008) refers to these results as evidence of the “servitization paradox” that many manufacturers fail to improve their profits after entering the service sector.
Crozet and Milet (2017) is the closest research to ours. They observe about 44,000 French manufacturers between 1997 and 2007 to check whether servitization of manufacturing firms improves firms’ performance. Their results show that French manufacturers that begin to produce services have a 0.4% increase in their profitability, a 2.1% increase in their employment, and a 0.6% increase in their sales.
A few studies look at the servicification of South Korean manufacturing at industry-level, namely Cho et al. (2018) and Lee (2022) with different methods from ours which analyzes servitization at firm-level evidence. Cho et al. (2018) compute industry-level servicification with employment data by sector. They find that labor-intensive industries have lower servicification, and logistics and R&D servicification improve productivity measured with wages. Lee (2022) adopts the methods of Miroudot and Cadestin (2017) and compute the net contributions of in-house service provision to manufacturing value-added. Then, Lee (2022) compiles the service contributions with value-added estimates of domestic and foreign service outsourcing from the OECD’s TiVA dataset. The result reports that at the industry-level, in-house services are positively correlated with domestic outsourcing, but negatively correlated with foreign outsourcing, and firms with higher export intensities, wider networks of overseas subsidiaries or those located in the Seoul metropolitan area engage in more in-house service activities.
III. Data
The main data source is the Korean firms’ disaggregated sales by two-digit KSIC sector from the Survey of Business Activities of Statistics Korea, 2012-2019.6 The original data covers about 100,000 observations of firms with at least 50 full-time employees and 300 million KRW or more capital stocks and wholesale and retail trading and other services firms with capital stocks of 1 billion won or more with any employees. As the servitization of “manufacturing firms” is our main interest of research, manufacturing firms are defined as all firms that reported their main industrial specifications of “C: Manufacturing” in KSIC for at least one year.7 The data includes most characteristics of firms: employment, financial status, affiliation, import and export, investment, and business management behaviors.
The individual firm data are very noisy, so we need to clean outliers from the data. Firms reporting unusual nonpositive numbers for sales, employment, capital stocks, material costs, and value-added are excluded. We also rule out firms reporting too high value-added per worker and capital intensity (capital stock per worker), more than 100 times larger than the median level each year. Cleaning outliers leave 39,567 observations of manufacturing firms over the eight-year sample.8
As the main variable, we construct a service intensity measure of firms as the share of service-related sales in total sales revenue, similar to Crozet and Milet (2017). For panel studies, we deflate revenue with industry-level producer price indices (PPI). The service intensity measure for firm
where
When looking at the distribution of service intensity across firms depicted in Figure 1 and Figure 2, most manufacturing firms have no service sales at all. In 2019, 58.8% of manufacturing firms report no sales of services. It is worth noting that the distribution of service intensity is skewed toward the right, compared to the French benchmark, Figure 1 reported by Crozet and Milet (2017), which has a clear bi-modal distribution with two peaks in tails. In their sample, 74.6% of manufacturing firms have positive service sales, which is about 1.8 times higher than the share of servitized firms in Korea.10 While about 10% of French servitized firms report sales of services only, there are only 3.4% of servitized firms in our sample report that the sales of services take more than 99% of shares in their total sales. The difference between the two distributions may come from the fact that the Korean data exclude small manufacturers with less than 50 employees. Crozet and Milet (2017) show that small enterprises have higher servitization rates. Thus, the Korean distribution of the servitization rate may actually be more skewed toward zero than in reality.
As time passes, the left tails of the distributions in Figure 1 are stable, but the right tails of the distributions are diverse. It is hard to say the trend of servitization with these figures. To check the time trend of servitization overall in the manufacturing sector, we test whether servitization has been increasing or not over 2012-2019. The overall trend of servitization in the manufacturing sector moves when firms with a high service intensity grow faster than others (intensive margins of servitization), or when all firms increase servitization overall (extensive margins of servitization). The following primary regression eliminates the size-dependent effect by controlling for any firm characteristics and year-effects.

The first column in Table 1 reports this result, and the second column shows the overall effect, including employment weighted service intensity. The results indicate that the shares of servitized firms both in terms of number and in terms of employment size have been steadily increasing significantly over time. It suggests controlling the size effect such as firms’ employment is important in the main empirical study.
6)As K-IFRS was introduced in 2011 in Korea, financial variables of firms in the database, based on their financial reports, have discontinuity in 2011. Thus, we use the sample from 2012.
7)Firms sometimes change their industrial specifications because their main business activities change or statistical revision identifies sub-industry differently. The survey follows KSIC Rev. 9 and 10 as KSIC Rev. 10 was introduced in 2017. “Maintenance and repair services of industrial equipment (KSIC 34)” is categorized as manufacturing according to KSIC Rev. 9 but changed to services in KSIC Rev. 10. Those firms in KSIC 34 are considered as manufacturing firms in our study.
8)Data cleaning process reduces the sample size by about 24,000 observations. The largest loss comes from nonpositive value-added firms (18,470 observations) and firms with negative capital stocks (3,990 observations). Among remaining 76,000 observations after cleaning outliers, 39,567 observations are manufacturing firms.
9)Private non-trade services include transportation and storage (H: 49-52), accommodation and food service activities (I: 55-56), information and communication (J: 58-63), financial and insurance activities (K: 64-66), real estate activities (L: 68), professional, scientific and technical activities (M: 70-73), business facilities management and business support services, rental and leasing activities (N: 74-76), education (P: 85), Human health and social work activities (Q: 86-87), arts, sports and recreation related services (R: 90-91), and membership organizations, repair and other personal services (S: 94-96).
10)
IV. Empirical Strategies
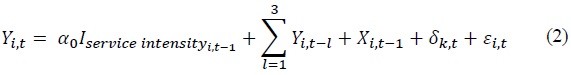
We want to analyze if the servitization of manufacturing firms affects firms’ performance. As many previous studies find non-linear relationship between firms’ servitization and firms’ performance measures, we first consider the following model (1) to compare the difference in firms’ performance between servitizated and nonservitized firms.11 Firms’ profitability, employment, total sales, and value-added per worker are used for dependent variables,

As Peters (2009) emphasizes that firms’ performance led by innovation is persistent, lagged independent variables up to three years are also controlled in the model (2).
Following Fang et al. (2008) and Crozet and Milet (2017), potential non-linear effect of servitization on firms’ performance bias the results in the previous models. To capture this, we consider quantile regression model as in the model (3). As the relationship between firm’s service intensity and its performance may not be linear, a dummy for each percentile rank,
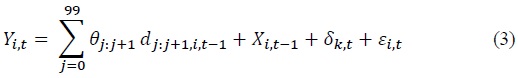
11)We also fail to find any linear relationship between firms’ servitiazation and firms’ performance measures. It suggests higher service intensity does not guarantee higher performance measures.
12)Since the service intensity indicator is stable over time, we do not consider firm-fixed effects. As
V. Results
1. Main Result: Servitization Premia
First, we discuss the servitization premia for manufacturing firms. Table 2 describes the result for firm’s profitability. Servitized firms show significant and positive profitability premia. Since profitability has weak persistence, models with lagged, (2)-1 and (2)-2 also have similar estimates for the servitization indicator on profitability. As expected, profitability and firms’ market share have a positive relationship, but the effect of employment is unstable over models. In general, smaller firms tend to have higher profitability, which is valid in the model (1)-2 and (2)-2. As a firm attains more market shares in a more centralized market, we expect higher profitability. This effect shows only for the model (1)-2 without lagged variables.
Table 3 reports the employment premia of servitized firms across models. The more dominant firms in the less concentrated markets tend to hire the more as shown in the model (1)-2. Since employment is persistent over time, adding second- and third-lagged variables takes out the servitized firms’ premia in their employment. It suggests that servitization may not replace existing employment or create new employment in the long run. This result indicates that the difference between the overall servitization trend and employment weighted servitization trend previous shown in Table 1 may be caused by industry or firm-specific effect rather than employment variation between servitized firms and others.
Table 4 shows the total sales premia of servitized firms. Only the model (1)-2 including market competition variables shows sales premia of servitizatied firms. Similar to employment, the size effect on servitization disappears when lagged variables are included as in the model (2)-1 and (2)-2. This result is consistent with the sub-sample study (Crozet and Milet, 2017) for large firms reported in their Table 5. They find that sales premia exist only for small firms that employ 11-50 workers, while over medium-sized firms that employ more than 50 workers do not have the premia in total sales.
For productivity premia of servitized firms, the result is shown in Table 5. Other than the model (1)-1, we have strong productivity premia across different models. Since value-added per worker is persistent over time, the model (2) is considered more reliable. In the model (2)-2, servitized firms tend to have about 1.3% higher productivity measured as value-added per worker than non-servitized firms when market competition structure variables are controlled.
When potential endogeneity issue between the servitization and firm performance variables is controlled with firm size, lagged variables, and market competition measures, servitized firms in the Korean manufacturing sector tends to show higher profitability and productivity. The size effect measured with employment and total sales is statistically insignificant, especially in the models with lagged variables. In the next subsection, we discuss the alternative model for the nonlinearity of service intensity and firms’ performance measures.
2. Robustness Check: Quantile Regression
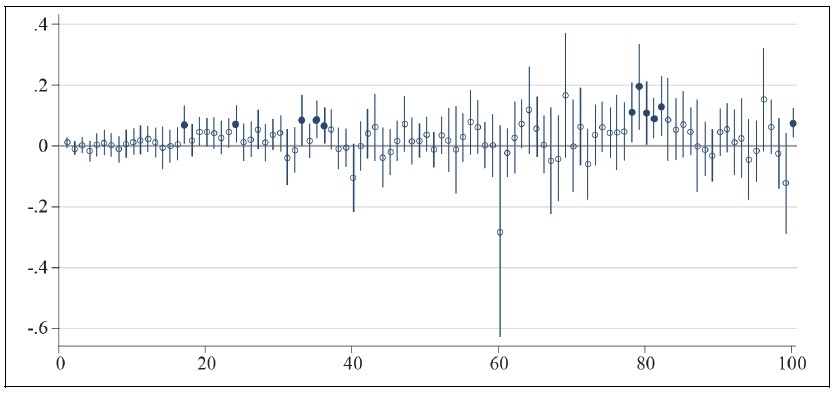
In general, quantile regression results based on the model (3) support the main finding of very strong servitization premia on size performance measures, such as profitability, employments, total sales, and value-added per worker. Figure 3 shows the sertivization premia on profitability. Not all, but about half of percentile groups with service intensity show significant servitization premia on profitability. It clearly suggests higher service intensity does not lead to higher profitability, but servitization increases firms’ profitability.
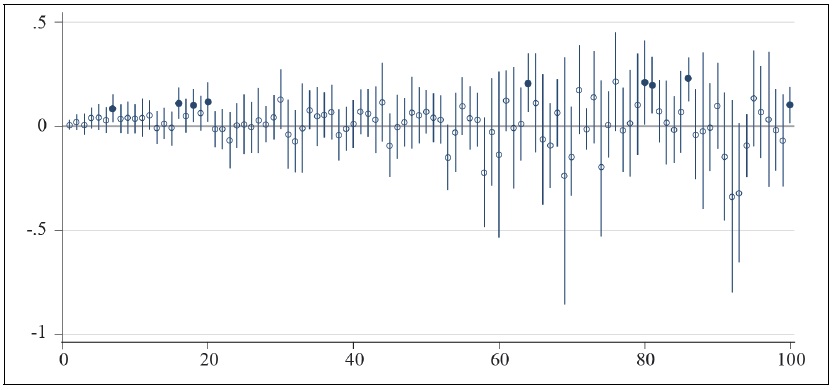
Figure 4 reports the servitization premia on employment. Across different service intensity, in general, servitized firms hire more workers than non-servitized firms, however, we observe much less statistically significant effect of servitization on employment than the previous profitability result shown in Figure 3. It is also similar to the main result of models (1) and (2) which find very diverse effects of service intensity on employment.
Figure 5 describes the quantile regression result for total sales in logs. Some groups that have service intensity around 20-40% and 60-80% show statistically significant and strongly positive sales effects. Most groups show insignificant sales premia. This pattern is similar to the previous result for employment, which is also related to the size of firms. It may suggest why sales premia in the main result are weak.
Figure 6 reports the quantile regression result about firms’ value added per worker. Positive effects of servitization on value added per worker are statistically significant for a few percentile groups by service intensity around 20% or 80%. However, some other groups lose productivity effects from servitization.
We discuss the servitization permia over different measure of firm performance. Although the size of firms is controlled with their employment, the results show some groups with service intensity have statistically and economically significant premia over all measures. In the previous subsection, we discuss the sources of servitization premia: the overall premia from servitization vs. stronger premia from larger servitized firms. The quantile regression results as a robustness check analysis suggest the premia from servitization are very heterogenous and uneven. They are related to the results of Fang et al. (2008) and Crozet and Milet (2017), the servitization paradox. The start of servitization does not improve firms’ performance necessarily. The main force of servitization premia comes from only some servitized manufacturers.
V. Conclusions
By using Korean firm-level micro data, we construct a new measure of servitization of manufacturing firms, the service intensity, as a proportion of service sales in the total sales of manufacturing firms. Several important stylized facts are found. First, servitization in the manufacturing sector has been increasing recently. The Korean servitization intensity distribution shows a very different shape from the French benchmark. Our sample shows more right-skewed distribution than the French benchmark which has a clear bi-modal shape. It may suggest that the distribution of the service intensity might be more skewed toward zero than in reality since small businesses with less than 50 employees showed a high servitization in the previous studies.
Second, servitized firms are more productive and profitable than non-servitized firms. The servitization premia within firms may be larger than the scale effect of servitized firms, which comes from no scale effect of servitization on employment across different models. It may be important to address diverse impacts of service activities on firms’ performance by industry. The results suggest a stronger effect of enhancing firms’ performance through servitization than the effect of intensifying market competition and lowering the profits due to servitization, but the effect is not universal nor linear in service intensity. It suggests a potential servitization paradox. Our empirical results have important implications for theoretical models of servitization: trade-off between stable revenue and profits vs. transition costs of servitization.
Tables & Figures
Figure 1.
Service Intensity: 2012-2019
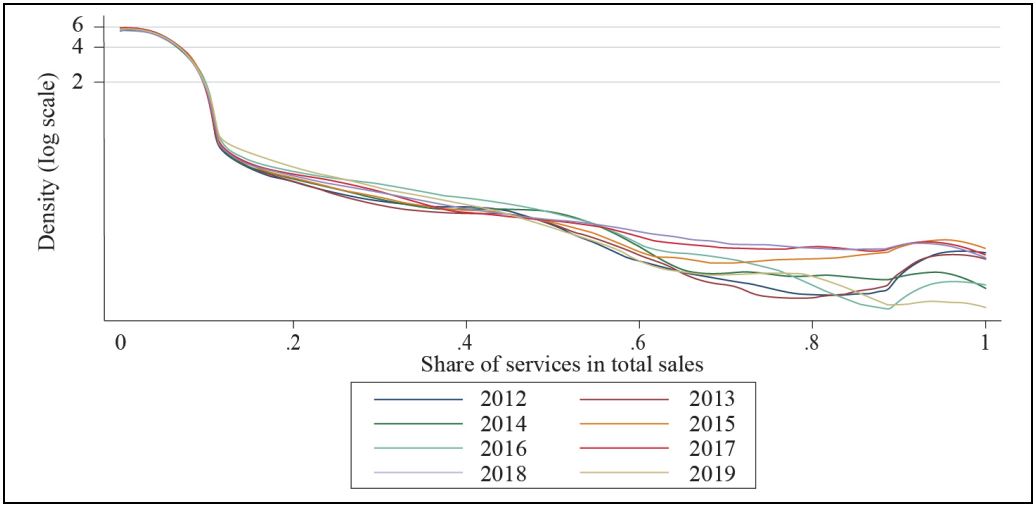
Note: Service intensity is defined as a share of non-manufacturing sales of manufacturing firms among their total sales across private non-trade services (KSIC: 49-76, 85-96), wholesales and retail trade (KSIC: 45-47), and manufacturing (KSIC: 10-34).
Figure 2.
Service Intensity: 2012 vs. 2019
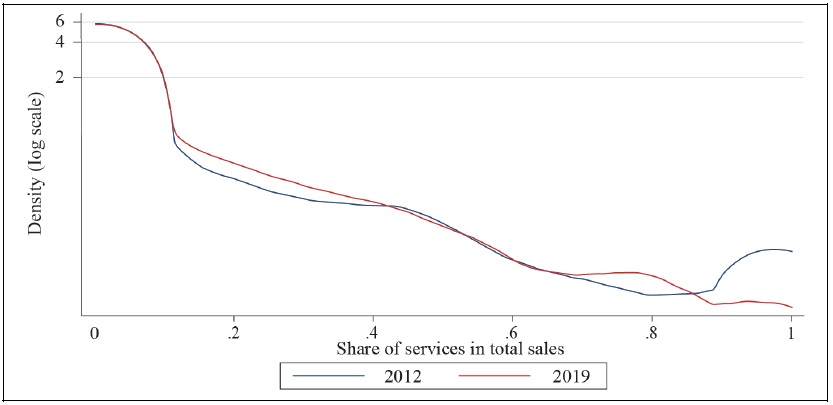
Note: Service intensity is defined as a share of non-manufacturing sales of manufacturing firms among their total sales across private non-trade services (KSIC: 49-76, 85-96), wholesales and retail trade (KSIC: 45-47), and manufacturing (KSIC: 10-34).
Table 1.
Aggregate Servitization Trend: 2012-2019
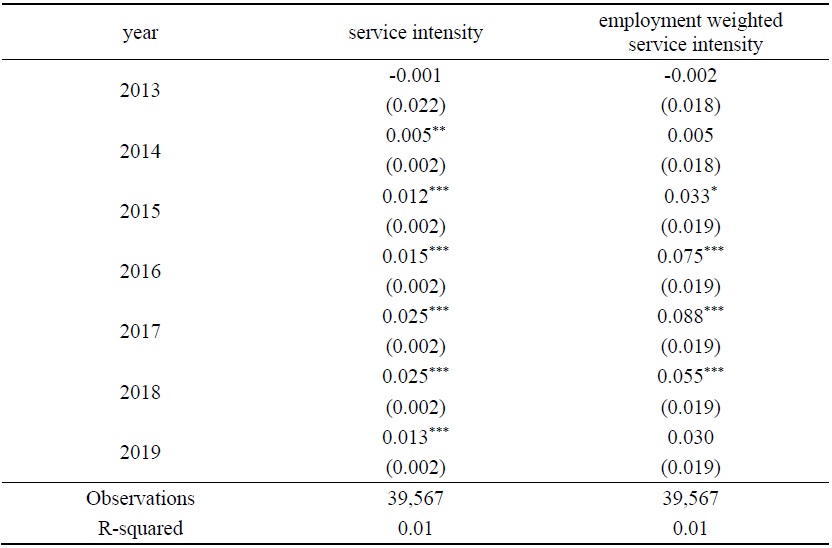
Notes: Service intensity is defined as a share of non-manufacturing sales of manufacturing firms among their total sales across private non-trade services (KSIC: 49-76, 85-96), wholesales and retail trade (KSIC: 45-47), and manufacturing (KSIC: 10-34). Year and firm fixed-effects are included. Robust standard errors are reported in parentheses. *, **, and *** indicate significance at the 10, 5, and 1-percent levels, respectively.
Table 2.
Profitability of Servitized Firms
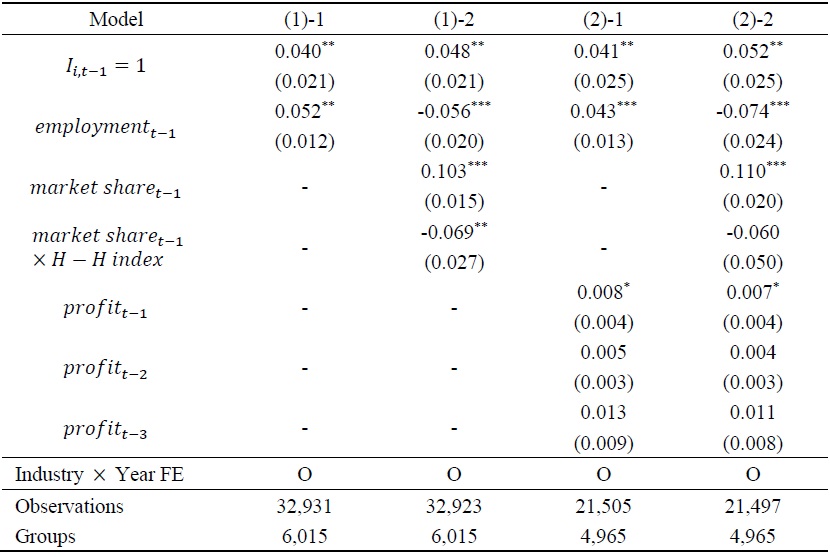
Notes: Service intensity is defined as a share of non-manufacturing sales of manufacturing firms among their total sales across private non-trade services (KSIC: 49-76, 85-96), wholesales and retail trade (KSIC: 45-47), and manufacturing (KSIC: 10-34).
Table 3.
Employment of Servitized Firms
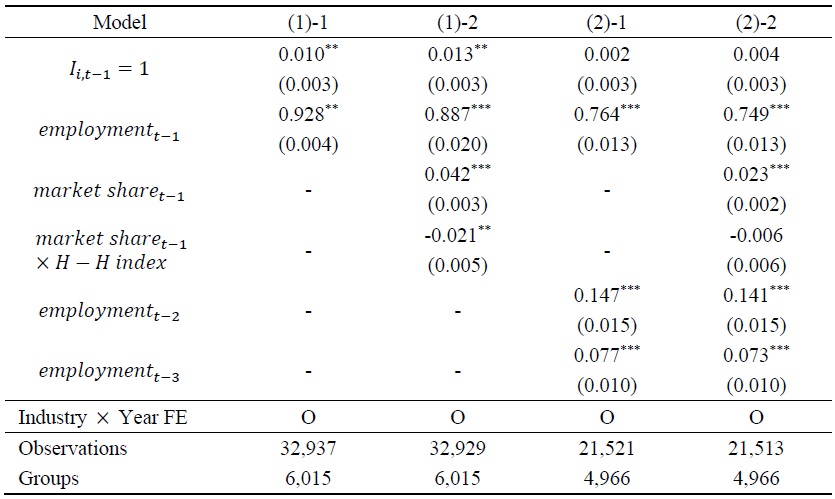
Notes: Service intensity is defined as a share of non-manufacturing sales of manufacturing firms among their total sales across private non-trade services (KSIC: 49-76, 85-96), wholesales and retail trade (KSIC: 45-47), and manufacturing (KSIC: 10-34).
Table 4.
Sales of Servitized Firms
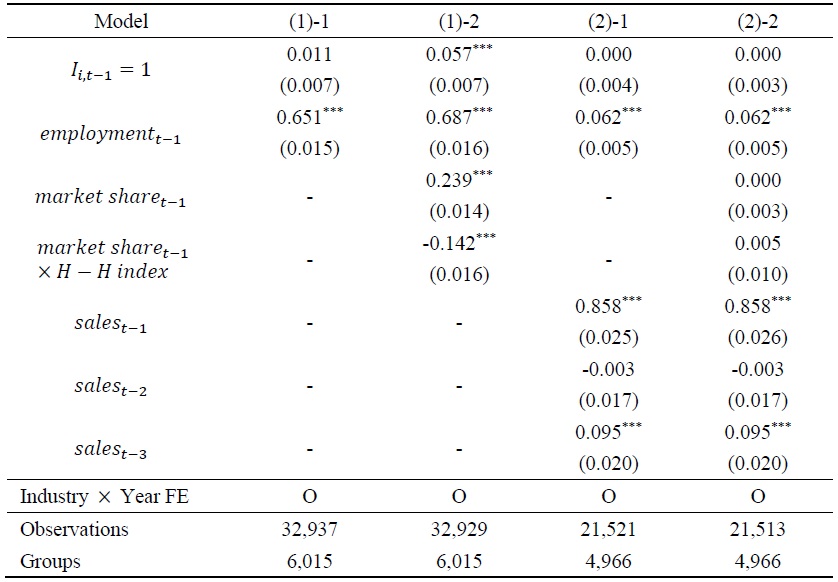
Notes: Service intensity is defined as a share of non-manufacturing sales of manufacturing firms among their total sales across private non-trade services (KSIC: 49-76, 85-96), wholesales and retail trade (KSIC: 45-47), and manufacturing (KSIC: 10-34).
Table 5.
Productivity (Value-Added per Worker) of Servitized Firms
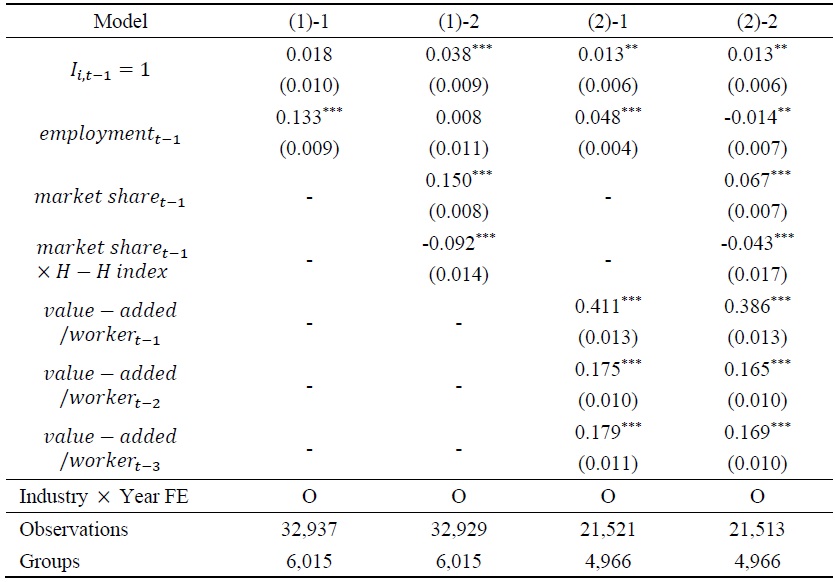
Notes: Service intensity is defined as a share of non-manufacturing sales of manufacturing firms among their total sales across private non-trade services (KSIC: 49-76, 85-96), wholesales and retail trade (KSIC: 45-47), and manufacturing (KSIC: 10-34).
Figure 3.
Quantile Regression Result: Profitability (%)
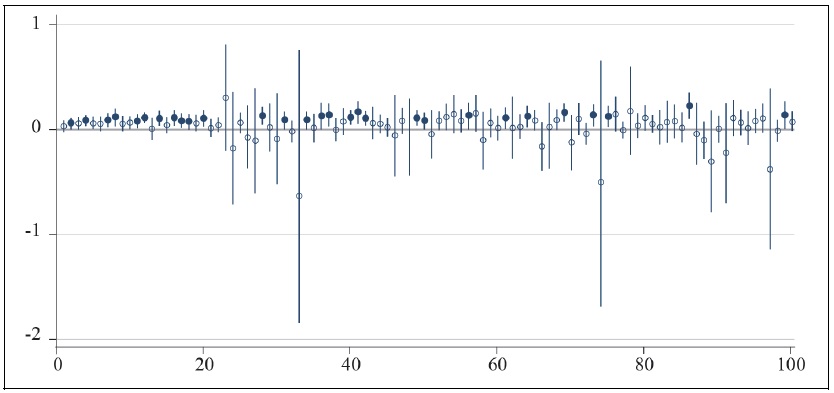
Notes: 100 groups by each percentile of service intensity with rounding. Service intensity is defined as a share of non-manufacturing sales of manufacturing firms among their total sales across private nontrade services (KSIC: 49-76, 85-96), wholesales and retail trade (KSIC: 45-47), and manufacturing (KSIC: 10-34). Industry × year fixed-effects are included. Dots represent the estimated
Figure 4.
Quantile Regression Result: Employment (logs)
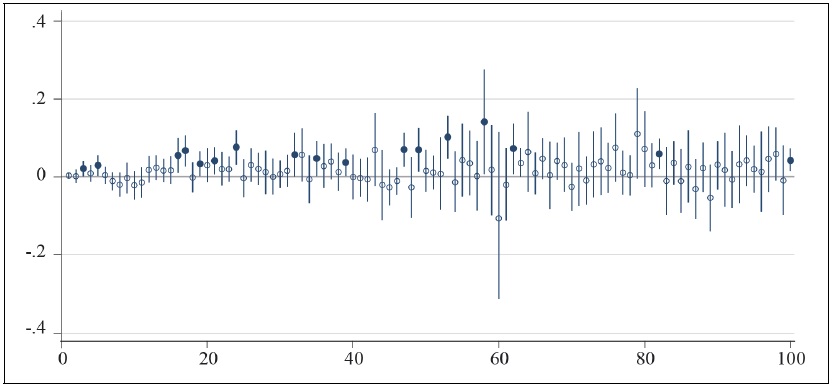
Notes: 100 groups by each percentile of service intensity with rounding. Service intensity is defined as a share of non-manufacturing sales of manufacturing firms among their total sales across private nontrade services (KSIC: 49-76, 85-96), wholesales and retail trade (KSIC: 45-47), and manufacturing (KSIC: 10-34). Industry × year fixed-effects are included. Dots represent the estimated
Figure 5.
Quantile Regression Result: Total Sales (logs)
Notes: 100 groups by each percentile of service intensity with rounding. Service intensity is defined as a share of non-manufacturing sales of manufacturing firms among their total sales across private nontrade services (KSIC: 49-76, 85-96), wholesales and retail trade (KSIC: 45-47), and manufacturing (KSIC: 10-34). Industry × year fixed-effects are included. Dots represent the estimated
Figure 6.
Quantile Regression Result: Value Added / Worker (logs)
Notes: 100 groups by each percentile of service intensity with rounding. Service intensity is defined as a share of non-manufacturing sales of manufacturing firms among their total sales across private nontrade services (KSIC: 49-76, 85-96), wholesales and retail trade (KSIC: 45-47), and manufacturing (KSIC: 10-34). Industry × year fixed-effects are included. Dots represent the estimated
Table A1.
Summary Statistics
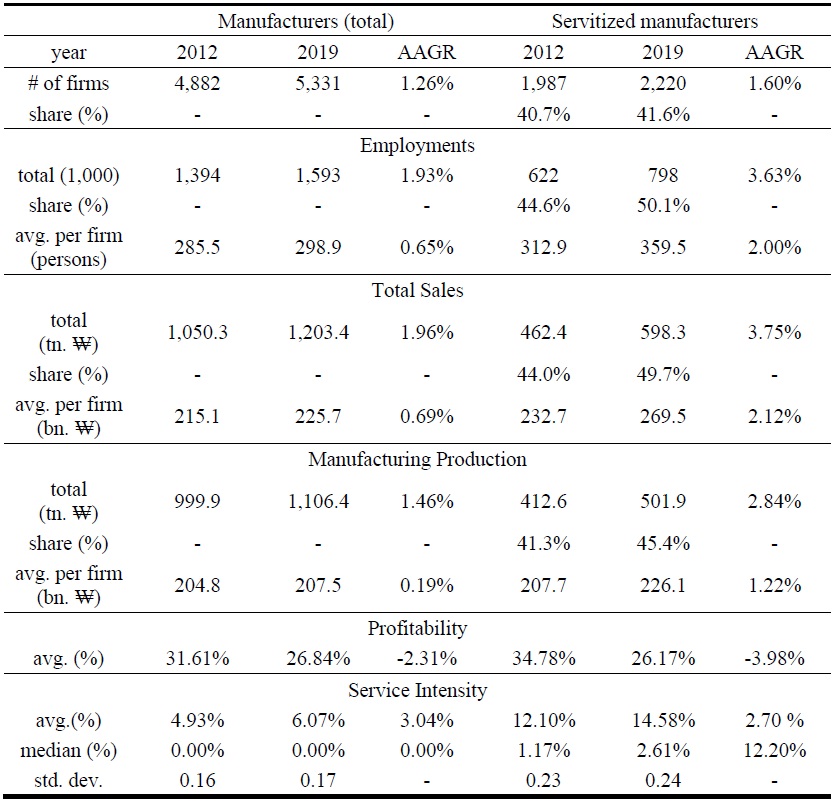
Notes: Servitized firms are defined as firms reporting any positive sales of services. AAGR stands for average annual growth rate. Profitability is the ratio of profits (EBITDA) over value-added. Service intensity is defined as a share of non-manufacturing sales of manufacturing firms among their total sales across private non-trade services (KSIC: 49-76, 85-96), wholesales and retail trade (KSIC: 45-47), and manufacturing (KSIC: 10-34).
Table A2.
Servitization by Group of Firms
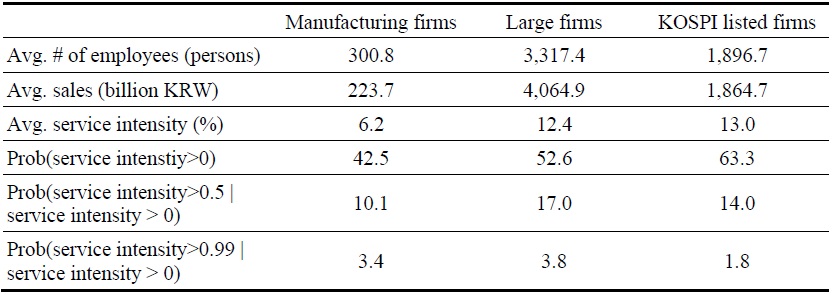
Notes: Large firms are categorized as conglomerate firms that hold asset of more than 5 trillion KRW (Fair Trade Commission of Korea). Service intensity is defined as a share of non-manufacturing sales of manufacturing firms among their total sales across private non-trade services (KSIC: 49-76, 85-96), wholesales and retail trade (KSIC: 45-47), and manufacturing (KSIC: 10-34).
References
-
Cho, J., Kim, Y. M., Yang, J. and I. Kim. 2018. “Analysis on Industrial Servicification and Its Implications.” KIET Research Reports, no. 2018-33. Korea Institute for Industrial Economics & Trade.
https://www.kiet.re.kr/research/redataView?redata_no=47 (in Korean) -
Crozet, M. and E. Milet. 2017. “Should everybody be in services? The effect of servitization on manufacturing firm performance.”
Journal of Economics & Management Strategy , vol. 26, no. 4, pp. 820-841. -
Cusumano, M. A., Kahl, S. J. and F. F. Suarez. 2015. “Services, industry evolution, and the competitive strategies of product firms.”
Strategic Management Journal , vol. 36, no. 4, pp. 559-575.
-
Fang, E., Palmatier, R. W. and Jan-Benedict Steenkamp. 2008. “Effect of Service Transition Strategies on Firm Value.”
Journal of Marketing , vol. 72, no. 5, pp. 1-14.
-
Gebauer, H., Fleisch, E. and T. Friedli. 2005. “Overcoming the Service Paradox in Manufacturing Companies.”
European Management Journal , vol. 23, no. 1, pp. 14-26.
- Kim, H., Kang, J., Keum, H. and J. Jung. 2021. “The Export Effect of Servitization in Manufacturing.” KIEP Policy Analyses, no. 21-30. Korea Institute for International Economic Policy. (in Korean)
- Lanz, R. and A. Maurer. 2015. “Services and global value chains: Some evidence on servicification of manufacturing and services networks.” WTO Working Paper, no. ERSD-2015-03, World Trade Organization, Economic Research and Statistics Division.
-
Lee, S. 2022. “What Determines In-House Service Activities within Manufacturing Firms: Micro Evidence from Korea.” Available in SSRN.
http://dx.doi.org/10.2139/ssrn.4028816 -
Levitt, T. 1972. “Production-Line Approach to Service.” Harvard Business Review, September.
https://hbr.org/1972/09/production-line-approach-to-service -
Miroudot, S. and C. Cadestin. 2017. “Services in Global Value Chains: From Inputs to Value-Creating Activities.” OECD Trade Policy Papers, no. 197. OECD.
https://doi.org/10.1787/465f0d8b-en -
Neely, A. 2008. “Exploring the Financial Consequences of the Servitization of Manufacturing.”
Operations Management Research , vol. 1, no. 2, pp. 103-118.
-
Nordwall, A. 2016. “The Servicification of EU Manufacturing: Building Competitiveness in the Internal Market.” National Board of Trade Sweden.
https://www.kommerskollegium.se/publikationer/rapporter/2016/publikation-the-servicification-of-eu-manufacturing/ -
Peters, B. 2009. “Persistence of innovation: stylised facts and panel data evidence.”
Journal of Technology Transfer , vol. 34, no. 2, pp. 226-243.
-
Reinartz, W. J. and W. Ulaga. 2008. “How to Sell Services More Profitably.” Harvard Business Review, May.
https://hbr.org/2008/05/how-to-sell-services-more-profitably -
Vandermerwe, S. and J. Rada. 1988. “Servitization of business: Adding value by adding services.”
European Management Journal , vol. 6, no. 4, pp. 314-324.
-
Visnjic, I., Wiengarten, F. and A. Neely. 2016. “Only the Brave: Product Innovation, Service Business Model Innovation, and Their Impact on Performance.”
Journal of Product Innovation Management , vol. 33, no. 1, pp. 36-52.
-
Wooldridge, J. M. 2010.
Econometric Analysis of Cross Section and Panel Data . (2nd ed.) Mass.: MIT Press.