

- EAER>
- Journal Archive>
- Contents>
- articleView
Contents
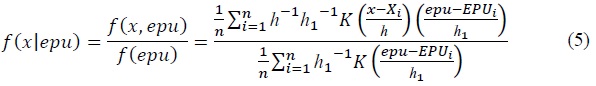
Citation
| No | Title |
|---|
Article View
East Asian Economic Review Vol. 27, No. 1, 2023. pp. 33-60.
DOI https://dx.doi.org/10.11644/KIEP.EAER.2023.27.1.417
Number of citation : 0View
63
Download
73
Analysis of ASEAN’s Stock Returns and/or Volatility Distribution under the Impact of the Chinese EPU: Evidence Based on Conditional Kernel Density Approach
|
|
University of Buner |
|---|---|
|
|
University of Peshawar |
|
|
Jiangxi Normal University |

Abstract
This paper analyzes the entire distribution of stock market returns/volatility in five emerging markets (ASEAN5) and figures out the conditional distribution of the CHI_EPU index. The aim is to examine the impact of CHI_EPU on the stock returns/volatility density of ASEAN5 markets. It also examined whether changes in CHI_EPU explain returns at higher or lower points (abnormal returns). This paper models the behaviour of stock returns from March 2011 to June 2018 using a non-parametric conditional density estimation approach. The results indicate that CHI_EPU diminishes stock returns and augments volatility in ASEAN5 markets, except for Malaysia, where it affects stock returns positively. The possible reason for this positive impact is that EPU is not the leading factor reducing Malaysian stock returns; but, other forces, such as dependency on other countries’ stock markets and global factors, may have a positive impact on stock returns (Bachmann and Bayer, 2013). Thus, the risk of simultaneous investment in Chinese and ASEAN5 stock markets, except Malaysia, is high. Further, the degree of this influence intensifies at extreme high/low intervals (positive/negative tails). The findings of this study have significant implications for investors, policymakers, market agents, and analysts of ASEAN5.
JEL Classification: C14, E44, G18, G15
Keywords
Economic Policy Uncertainty, Stock Market Returns/Volatility, Conditional Density Estimation, ASEAN5 Stock Markets
I. Introduction
Uncertainty is a crucial element in the pricing of financial assets and affects the portfolio and investment decisions of investors, thereby possibly causing changes in asset prices (Drechsler, 2013). Economic policy uncertainty (hereafter, EPU) could be described as uncertainty in the decision-making process of financial policymakers and relevant economic authorities that influence decisions on different economic units, such as investment, saving, and lending (Wu et al., 2016). Researchers have recognized several consequences of high EPU. Gozgor and Ongan (2017) argued that EPU hinders the speed of economic development and generally hampers economic and financial activities. EPU can also adversely affect the economy and increase unemployment. In addition, this uncertainty leads to the development of rules of the game for investors and consumers, apart from its influence on economic actors (Li et al., 2015; Baker et al., 2014). In large economies, uncertainty associated with government policy may adversely affect the economy and will also induce crises that may spillover to other countries. The 2008?2009 financial crisis has shown that economies tend to be more integrated in terms of financial integration and trade compared with before the crisis. Therefore, disturbances in the financial and economic system of one country are expected to significantly spread globally, either directly or indirectly. Moreover, the degree and level of such effects are prominent when disturbances particularly originate from the world’s leading economies (Forbes and Chinn, 2004). From this perspective, uncertainty originating from one country is expected to be transmitted to other countries.
The empirical literature has extensively reported the high growth rate of the Chinese economy in the last three decades. China is regarded as the world’s largest economy and has become the leading trading economy since 2013, with its role significantly increasing in international trade (Chiang and Chen, 2016). In the wake of globalization, China seeks strong trade and investment cooperation with its economic partners. The principal example of this reaching-out policy is the “One Belt, One Road” (OBOR) initiative of the Chinese government. This initiative aims to promote regional economic cooperation and integration with Asian countries, including the Association of Southeast Asian Nations (hereafter, ASEAN), in such areas as trade, transportation, information, and investment to enhance exchanges across countries. Consequently, the economic performance of China, the conditions of their capital markets, and the government’s economic policies are markedly interrelated with international stock markets. Considering the economic emergence of China as a global force, any change, slowdown, or uncertainty in the economic policy will expectedly affect its economy and also result in significant spillovers to other economies globally, particularly to China’s trading partners. Therefore, our study examines the stock pricing inferences of the Chinese EPU (CHI_EPU).
Our study aims to investigate the implications of CHI_EPU on the stock market performances of Southeast Asian economies, specifically the ASEAN5.1 This study empirically examines how the stock market returns/volatility of the ASEAN5 economies react to the CHI_EPU, and aims to show whether or not changes in the Chinese economy (i.e., the EPU) cause volatility in the ASEAN5 stock markets. The motivational factors for choosing ASEAN stock markets’ responses to CHI_EPU are as follows. First, ASEAN stock markets are rapidly growing, and emerging stock markets; compared with developed economies, respond faster to external shocks (Basher et al., 2016). Hence, these markets are highly volatile to global shocks, particularly to changes in global economic policy developments, including CHI_EPU. Second, empirical investigations have shown that uncertainty shocks originating from world-leading economies have large-scale effects on emerging economies (Christou et al., 2017). Sum (2013b) concluded that the stock market returns of ASEAN5 are negatively affected by the US_EPU. Given that China is a regional economic power and the world’s second largest economy, any changes in its policies could affect ASEAN markets. Third, we choose CHI_EPU because of the strong financial and economic integration of China with ASEAN economies. For example, China has exceeded several major different economies, including the US and Japan, and became the most important and largest external trade partner of ASEAN in 2009; by contrast, ASEAN economies have been the third-largest trading partner of China since 2011 (Miller, 2015). According to ASEAN’s external trade statistics for 2013, China was rated first (comprising 15% of the total trade) among the regional block’s top trade partners (Oh, 2017). Evidently, economies with close linkages in international trade and financial markets have a high spillover likelihood among them (Luk et al., 2017). Trade and financial linkages between countries significantly determine international spillovers (Forbes and Chinn, 2004), and the magnitude of EPU spillovers varies with bilateral relation factors (Balli et al., 2017). Furthermore, ASEAN has seen rapid growth in FDI inflow from China over the last few years (Edward, 2017), given that FDI is considered one of the significant elements in stock market development. Thus, increased CHI_EPU could have effects on the performance of ASEAN stock markets.
At present, China is undergoing structural transformation, and with its economic size and dynamism, any changes in its policies may have a substantial influence on the international financial markets (Dizioli et al., 2016), specifically for its regional financial and trade partners in Southeast Asia. Thus, the purpose of this study in the given context is to evaluate the implication of CHI_EPU on financial markets’ performance in a sample of five emerging ASEAN economies (ASEAN5). Our research builds upon and extends Tsai (2017) and Li et al. (2019). Li et al. (2019) investigated the impact of CHI_EPU on the stock market volatility of G7 countries and concluded that these markets’ volatility is significantly affected by CHI_EPU. Tsai (2017) investigated the effects of EPU on the contagion risk of investments in 22 stock markets in China, Japan, Europe, and the US from 1995 to 2015. The aforementioned study showed that CHI_EPU is the most influential and its contagion risk spread is larger than the EPU influence in the US, Japan, and Europe. However, the nexus between EPU and stock markets has received minimal attention in emerging markets, particularly in ASEAN countries.
We contribute to the extant literature as follows. First, the empirical literature on the spillover effect of EPU from an emerging economy (e.g., China) on the performance of financial markets in other countries, particularly ASEAN5, has been scarce. In the international spillover context, some studies have related it by investigating the influence of the US_EPU index on the stock markets of other emerging economies, such as BRICS and the EU (Chuliá et al., 2017; Mensi et al., 2014). Evidence from the empirical literature on the spillover effect of EPU from an emerging economy (e.g., China) on the performance of financial markets in other countries, specifically ASEAN5, has been limited. The current research aims to fill in the preceding empirical literature gap. Second, although Sum (2013b) examined the effects of the US_EPU index on the stock markets of ASEAN5 economies, the focus was stock returns and the linear framework was used to inspect the effects of US_EPU. By contrast, the current study focuses on the non-linear framework and considers the effects of CHI_EPU on the volatility of these stock markets. Our paper uses a nonparametric conditional kernel density estimation (hereafter,
Our study employs the index of EPU (BBD index) created by Baker et al. (2016) as the measure of CHI_EPU, and evaluates its significance for the stock returns/volatility of ASEAN5 markets by applying non-parametric
The remainder of this paper is organized as follows. Section II presents an overview of the theoretical background and related studies. Section III describes and explains the data analyzed and the model used to define our specification. Section IV discusses the empirical results of this study. Lastly, Section V concludes and provides some closing comments.
1)Details are given in the data description section.
II. Theoretical Background and Literature Review
The standard macroeconomic theory advocates that a surge in uncertainty can lead to a temporary collapse of economic activities, particularly stock markets. Real-option effects, financing costs, and precautionary savings are among the main channels that have emerged to describe how the economy may be affected by uncertainty. Real-option theory hypothesizes that the higher the irreversibility of investment projects (or costly to reverse), the more likely these investment projects will be deferred when there is uncertainty in the future. Several empirical studies have documented the irreversibility of capital stocks’ investment results upon the introduction of a so-called option value to delay investment when the future is uncertain. The value of the wait-and-see option increases if the uncertainty level is high, thereby leading to low current investment plans (Gulen and Ion, 2016). Financing cost is another significant channel through which uncertainty can affect the movements of a real economy and stock markets. Risk-averse investors ask for compensation for taking high risks, and as increased uncertainty could lead to increased risk and increased risk premium thereafter, investors would require risk premiums, which is a high return for taking additional risk (David and Veronesi, 2002). As such, an upsurge in uncertainty could increase the cost of financing, resulting in low-level investment expenditures (Gilchrist et al., 2014), unemployment, and economic contraction (Bloom et al., 2018). Furthermore, heightened uncertainty could increase equity risk premiums (Pástor and Veronesi, 2013) and, hence, the cost of equity. Given this financing friction of firms in the equity market, firms decrease the level of investment expenditures instead of relying on funding from the equity market (Lemmon and Roberts, 2010). Uncertainty could also affect economic activities through precautionary savings, thereby possibly leading to reduced consumers’ consumption spending (Bansal and Yaron, 2004). In response to heightened uncertainty in the economy, cautious consumers and investors tend to save rather than to spend, which may increase risk in financial markets (Pástor and Veronesi, 2012).
Our research is directly connected to the research conducted on the EPU_market nexus. Numerous empirical studies have dealt with this issue and indicated that increases in EPU levels are often linked with a decrease in the returns of financial markets. Sum (2013b) and Antonakakis et al. (2013) (US), and Bhagat et al. (2013) (India) found a negative association between stock market returns and EPU. Support for a negative relationship has also been discussed in recent and extant empirical studies (Wang et al., 2020; Baker et al., 2021; Demir and Ersan, 2018). However, Brogaard and Detzel (2015) documented that an upsurge in EPU levels could lead to a decrease in asset returns but will also result in high future returns. Sum (2012; 2013a) found negative transnational effects from the US_EPU on asset returns in BRICS and ASEAN5. Han et al. (2016) found the same spillover inferences from the EPU of the US, EU, and Japan to China by applying the global vector autoregressive (GVAR) method.
Even though the final results appear to indicate that stock market returns are adversely impacted by uncertainty, the effects have been far from conclusive. Sum (2012) established that shocks from US_EPU are insignificantly associated with the returns of Chinese, Indian, and Brazilian stock markets. Momin and Masih (2015) found similar effects from US_EPU on the stock markets of BRICS economies. Li et al. (2016) explored the link between US_EPU with the stock markets of India and China. The preceding research concluded a weak association between EPU and stock market returns. Some studies have documented that US_EPU could effectively enhance international stock markets over the investor portfolios diversification channel, thereby possibly having a positive effect on foreign financial and equity markets (Balcilar et al., 2018). To summarize, the majority of the prevailing studies have indicated a link between stock market dynamics (return and/or volatility) and EPU, although the nature of such a relationship is uncertain.
Further, researchers, policymakers, and investors have considerable interest in forecasting and modeling stock market volatilities because volatility contributes significantly to portfolio selection, deriving pricing, hedging, and risk management (Mei et al., 2017). For example, more risk-averse investors who forecast larger fluctuations in the future market will prefer to place more weight on their risk-free assets. Similarly, policymakers will exert effort to minimize the corresponding risks. Consequently, investigating the sources of capital markets’ volatilities is reasonable. In this regard, stock market integration globally has drawn widespread attention from academic and empirical researchers (Carrieri et al., 2007). Integration across financial markets could lead to prompt the risk of shock transmission associated with adverse economic conditions and diminished advantages of transnational portfolio diversification. The key issue in financial market integration is the contagion in stock markets which can be described as the existence of a significant association among the returns and/or volatility of stock markets. Several studies have investigated this topic (Boubaker et al., 2016; Bekaert and Harvey, 2003). However, our study aims to highlight uncertainty (i.e., EPU), which is another source of financial market contagion and one of the new sources that could cause stock market volatility. In financial asset pricing, current uncertainty is regarded as an important factor that has a substantial influence on the consumption and portfolio decisions of investors (Drechsler, 2013).
Moreover, most of the empirical studies have investigated the EPU-market nexus of their respective countries (Rahman et al., 2019; Arouri et al., 2016). In the context of international spillovers, some studies have related it by investigating the influence of the US_EPU index on other emerging economies, such as BRICS countries and the EU (Chuliá et al., 2017; Mensi et al., 2014). Evidence from the empirical literature on the spillover effect of EPU from an emerging economy, such as China, on the performances of the financial market in other countries, specifically on ASEAN5, is scarce. Xu et al. (2020)2 made a forecast of changes in CHI_EPU based on the financial uncertainty of ASEAN5 and Hong Kong stock markets. They found that financial uncertainty (measured by realized volatility) could significantly forecast CHI_EPU, except for Thailand. However, they disregarded the influence of CHI_EPU on the performance of these economies. ASEAN economies are the largest trade partners of China, and given their close relationship and reliance on each other, which could significantly influence their respective economies (Das, 2014), CHI_EPU is expected to affect the performances of China and ASEAN.
The preceding studies have clearly indicated a linkage between EPU and stock market performance. Although some studies have discussed this issue, relatively minimal attention has been given to the CHI_EPU linkages and ASEAN stock markets. This gap is particularly important because China is the largest trade partner of ASEAN economies. Given their close relationship and reliance on each other, which could significantly influence their respective economies (Das, 2014), CHI_EPU is expected to also affect the performances of China and ASEAN. Thus, our study seeks to empirically examine the impact of CHI_EPU on the stock market dynamics of ASEAN5 economies. Most previous studies have adopted linear models to investigate the EPU_market nexus. However, our study adopts the non-parametric
2)This study uses the same data sample to check the reverse channel and confirm whether or not CHI_EPU could also be used as an indicator, which can affect the stock market returns/volatility of the ASEAN5 economies.
III. Data and Methodology
1. Data Description
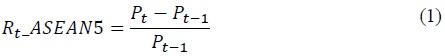
We empirically examined the likely effects of CHI_EPU3 on the financial market performance (returns and/or volatilities) of ASEAN5 economies from March 2011 to June 2018. Our data set included monthly data of the CHI_EPU index and monthly data of ASEAN5 countries’ (i.e., original members and having the major and significantly developed stock markets in ASEAN) stock market indices. ASEAN54 consists of Indonesia, Malaysia, the Philippines, Singapore, and Thailand. The monthly historical stock market data of these countries were taken from the Composite Index of Jakarta Stock Exchange (JSE), FTSE Composite Index of Kuala Lumpur Stock Exchange (KLCI), Composite Index of the Philippine Stock Exchange (PSEi), FTSE Straits Times Singapore Stock Exchange Index (STI), and The Bangkok Stock Exchange Composite Index (SETI) from March 2011 to June 2018. Investing.com and WIND databases were used to obtain data for these indices. For analysis, we calculated the returns by using the following equation:
where
Rt_ASEAN5 = returns in month t of ASEAN5 stock market indices,
Pt = stock price in month t (current month) of the stock indices of ASEAN5, and
Pt-1 = the stock prices in the previous month (month t − 1).
Following Jorion (1995), monthly aggregate realized volatility was calculated over the last 22 trading days as follows:
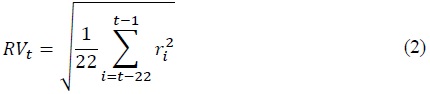
where  represents the square of daily returns at time
To determine the uncerainty degree in economic policy for the study period, monthly data for CHI_EPU5 was obtained from the EPU index constructed by Baker et al. (2016).6 We computed the rate of change of CHI_EPU by taking the first difference between two consecutive values.
2. Methodology
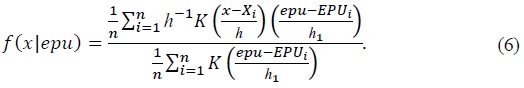
To explore the implications of CHI_EPU on the returns of ASEAN5 stock markets, our paper uses the non-parametric kernel method. We followed the empirical framework (Xu et al., 2014; 2016) of path-converged design. We can analyze the entire distribution of stock returns/volatilities and figure out the conditional distribution of the CHI_EPU index by applying non-parametric
Let
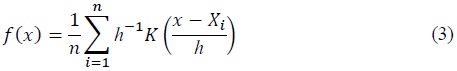
where
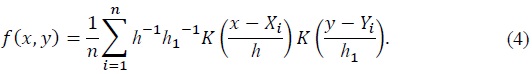
Based on a sample of (X, Y) = (X1, Y1), (X2, Y2)..... (Xn, Yn) the standard estimator of kernel density for joint density function f(x, y) is specified as:
In order to describe the initial allocation efficiency of CHI_EPU in ASEAN5 stock markets, the underlying structure of stock returns/volatilities is provided with the
See for example the studies of Silverman (1986) and Hansen (2004).
By taking a kernel production:

Then the above equation can be re-write as:
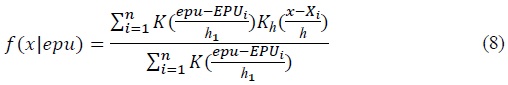
Let
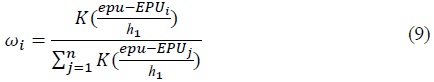
Here
where epu=0.
Technically, the identification of EPU’s distribution efficiency is challenging, as the density function

We employed the Gaussian Kernel Function in our study. In the economics and financial fields, the Gaussian Kernel Function’s popularity is related to the efficiency of its computation.
3)Instead of using real economic variables or economic growth measures as a proxy to assess the impact of one country on other economies, using the EPU index or policy measures may be a more reasonable method. EPU variables are more forward-looking and may be more appropriate in determining the extent of the economic influence of one country on other economies compared with other real economic variables
4)The paper used a sample of five economies to represent ASEAN because these economies constitute about 73% of the group’s population and 95% of its GDP.
5)
6)The CHI_EPU index is monthly news-based (i.e., from newspaper articles). Article data were taken from the South China Morning Post (SCMP), which is a prominent English-language Hong Kong newspaper. To be included in the index, articles must cover the related terms linked to the economy or economic, uncertainty or uncertain, and one or more policy-related terms. We strongly recommend visiting
IV. Empirical Results
1. Descriptive Statistics
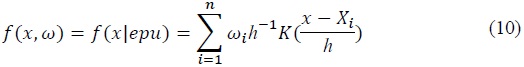
Table 1 presents the data used in our study. For the sample period, the average monthly rate of returns for the sample countries is positive. Average return value for the Philippines (R_PHIL) is the highest, followed by the returns of Indonesia (R_INDO) and Thailand (R_THAI). The mean and average monthly returns for Malaysia (R_MAL) and Singapore (R_SING) are the lowest. Furthermore, the difference between maximum and minimum returns is relatively large, which is evidence of high volatility. Standard deviation (SD), which measures risk, appears to be low for R_MAL and relatively high for R_THAI and R_PHIL. Note that stock returns of ASEAN5 financial markets are more volatile compared with the differences in CHI_EPU. CHI_EPU has more SD than the stock returns of the ASEAN5 countries because EPU measures the policy risk of the economy. In the majority of cases, stock returns are negatively skewed and possessed excess kurtosis, except for R_PHIL. Accordingly, this situation indicates that stock returns in these countries have a heavy left–tail, and the distribution of returns has a high peak. This result confirms that data are not normally distributed, thereby providing an initial incentive to check the impact of EPU over the stock returns’ entire distribution.
Figure 1 shows the monthly return rate of the selected five stock markets and changes in CHI_EPU. Note that emerging economies have more volatile equity markets compared with developed markets, and ASEAN5 confirms this phenomenon. In particular, fluctuations in the stock returns of Indonesia, Thailand, and the Philippines are higher, whereas Malaysia has low fluctuations, followed by Singapore. Figure 1 also shows that stock returns of nearly all financial markets are generally distributed in the range of (−0.4, 0.04) from March 2011 to June 2018. However, there are large spikes in the data at certain points, which can be treated as outliers or abnormal returns. For simplicity, we defined abnormal returns or outliers as returns above (0, 0.04) and/or below (−0.04, 0). The rationality of choosing this interval as a “benchmark” is that most of the returns of all the countries are between the two intervals during the sample period. Moreover, returns below and/or above these intervals are treated as abnormal returns or outliers in our paper. Thus, the impact of EPU at these points should be evaluated as well.
We raised the following questions, given the preceding variations:
1. Does CHI_EPU have any impact on the stock returns/volatility density of ASEAN5 markets? If there is any, explain.
2. Do changes in EPU explain the returns at higher or lower points (abnormal returns)?
2. Conditional Distribution of CHI_EPU for ASEAN5
Figures 2 to 6 illustrate the kernel density estimation (
(1) Conditional distribution of CHI_EPU for Indonesia
The curves in Figure 2(a) and data in Table 2 show that as EPU level changes, the R_INDO distribution shifts from the interval (−0.005, 0.0368), and fluctuation increases. Fluctuation area is 5.64%. In particular, yield range (−0.005, 0.0368) transfers to two major intervals (−0.0367, −0.005) and (−0.0734, −0.0367), and transfer areas are 2.97% and 3.12%, respectively. This result indicates that EPU causes fluctuations in Indonesia’s stock returns. However, this fluctuation is high at the interval (−0.0734, −0.0367). This interval shows the abnormal returns of the Indonesian stock market, in which EPU shifted leftward, indicating that CHI_EPU explains the abnormal returns at this interval, and its impact is negative. At the extreme high interval (positive tail), EPU explains the abnormal returns with a negative impact, although the fluctuation area is small. In general, CHI_EPU information increases the probability of the returns at extreme low tails (left-tail). Given that the left tail is fatter, the risk of a stock price crash increases. These results confirm the explanation of Christou et al. (2017) by suggesting the negative effect of EPU on stock market returns.
For the distribution of volatility, Figure 2(b) and data in Table 3 show that the probability of large fluctuations increases. CHI_EPU positively explains the Vol_INDO. These findings confirm the explanations of Liu and Zhang (2015), who reported a positive effect of EPU on stock market volatility.
By summarizing the two figures of return and volatility distribution, we can conclude that CHI_EPU may cause the stock market of Indonesia to fall because it leads to increased volatility and decreased returns.
(2) Conditional distribution of CHI_EPU for Malaysia
The curves in Figure 3 and data in Table 2 show that as EPU level changes, the R_MAL distribution shifts from the interval (−0.0042, 0.0379), and fluctuation increases. Fluctuation area is 18.13%. In particular, yield range (−0.0042, 0.0379) transfers to two intervals (−0.0712, −0.0042) and (0.0379, 0.06), and transfer areas are 13.51% and 1.82%, respectively. Fluctuation at the interval (−0.0712, −0.0042) is high. Considering the conditional distribution of EPU, EPU shifted rightward, indicating the positive effect of CHI_EPU on the stock returns of the Malaysian stock market index. The possible reason for this positive impact is that uncertainty is not the leading factor in depressing stock returns in Malaysia. In particular, there may be other forces, such as dependence on other countries’ stock markets and global factors, which could affect stock returns positively (Bachmann and Bayer, 2013).
For the distribution of volatility, Figure 3(b) show that the probability of large fluctuations is small. CHI_EPU has no influence on the distribution of Vol_MAL.
Therefore, CHI_EPU may cause the stock market of Malaysia to rise because it leads to increased returns.
(3) Conditional distribution of CHI_EPU for the Philippines
Figure 4(a) shows the conditional distribution of CHI_EPU on the R_PHIL. The curves show that R_PHIL are fluctuating with the EPU levels. That is, as EPU increases, return distribution shifts from the interval (−0.0242, 0.0244) to the three sides, and fluctuation increases. Fluctuation area is 4.97%. In particular, yield range transfers to intervals (−0.087, −0.0572), (−0.0572, −0.0242), and (0.0244, 0.08), and transfer areas are 2.8%, 2.02%, and 4.39%, respectively. This result indicates that EPU causes fluctuations in the R_PHIL. At the extreme low interval (negative tails) and extreme high interval (positive tail), the impact on stock returns is negative, thereby explaining the abnormal stock returns.
For the distribution of stock market volatility, Figure 4(b) and data in Table 3 shows that the probability of large fluctuations increases. CHI_EPU positively explains the volatility distribution.
Therefore, CHI_EPU may cause the stock market of the Philippines to fall because it leads to increased volatility and decreased returns.
(4) Conditional distribution of CHI_EPU for Singapore
Figure 5(a) presents the conditional distribution of CHI_EPU for the Singapore financial market stock returns. The curves show that stock returns fluctuate with EPU levels. The impact of EPU on stock returns is negative at the extreme low and high intervals (abnormal returns). The intervals (−0.0912, −0.0663) and (0.0286, 0.0713) are shown in Table 2. Change areas at these intervals are 2.52% and 3.79%, respectively. For the distribution of stock market volatility, Figure 5(b) shows that EPU has no impact on volatility distribution. Therefore, CHI_EPU may cause the stock market to fall because it leads to decreased returns.
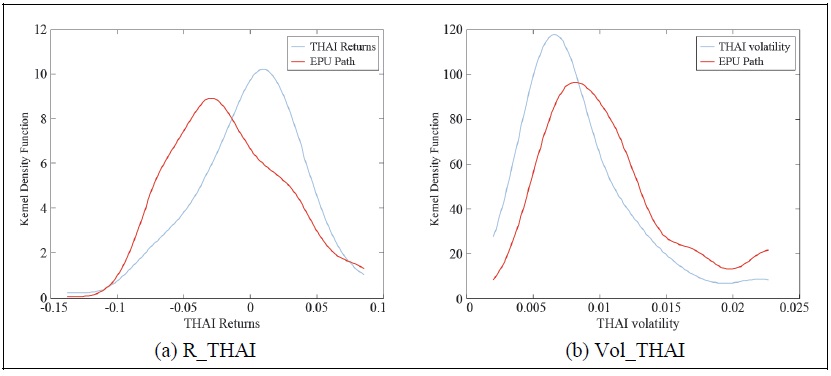
(5) Conditional distribution of CHI_EPU for Thailand
Figure 6(a) and data in Table 2 show that as the EPU level changes, fluctuation increases. The curves show that R_THAI fluctuate with EPU levels. The impact of EPU on stock returns is negative. In particular, yield range (−0.1113, −0.0068) transfers to intervals (−0.101, −0.1113) and (−0.0068, 0.0559), and transfer areas are 0.41% and 17.43%, respectively. This result indicates that EPU causes fluctuations in the R_THAI. CHI_EPU and returns of the stock market at the extreme low and high intervals (negative and positive intervals) show a negative association. The result is consistent with Christou et al. (2017). Figure 6(b) shows that with an increase in EPU value, volatility distribution significantly rises. Therefore, CHI_EPU may cause the stock market to fall because it leads to decreased returns and increased volatility.
3. Discussions
Our study aims to investigate the implications of CHI_EPU on the stock market performance of ASEAN5. In particular, this study empirically examines how stock market returns and volatility of ASEAN5 economies react to CHI_EPU, and intends to show whether or not changes in the Chinese economy (EPU) cause volatility in ASEAN5 stock markets. Furthermore, our focus is to check whether or not fluctuations and abnormal returns (as shown in Figure 1) in the stock markets of these economies are explained by CHI_EPU.
The findings show that CHI_EPU has an influential negative impact on the returns of ASEAN5 stock markets, except in Malaysia, where EPU positively explains stock returns distribution. The possible reason for this positive impact is that uncertainty is not the leading factor in depressing stock returns in Malaysia. There may be other forces, such as dependence on other countries’ stock markets and global factors, which could affect stock returns positively (Bachmann and Bayer, 2013). Another reason for this positive relationship is that an increase in EPU causes investors to demand a risk premium in exchange for assuming the risk of uncertainty caused by Chinese EPU, resulting in higher stock prices and positive stock returns, as shown by Brogaard and Detzel (2015). Moreover, Malaysia is one of the Asian economies that has received the largest levels of FDI inflow during 2002 and 2016, which has fuelled the growth of stock markets and economic expansion (Hoque and Yakob, 2017). An increase in FDI inflows into the economy, which is vital for the development of the stock market, could have a positive impact on stock performance. Another vital finding is that EPU explains fluctuations in stock markets of all ASEAN5 economies between March 2011 and June 2018. These results suggest that fluctuations in these stock markets are affected by CHI_EPU. However, note that there is significant variation in fluctuations of stock returns at different intervals. This result is consistent with the findings of Arouri et al. (2016), in which EPU influence on the stock market is non-linear. This result implies that the relationship is not uniform between variables and is conditional to EPU’s transfer level from China to the respondent countries. The presence of this discrepancy across economies may be attributable to differences in their dependence on EPU, global factors, and links with financial markets in other economies, which may affect stock returns differently. The impact of EPU could fluctuate depending on how well or poorly the stock market is performing. The association between financial markets and EPU is therefore heterogeneous according to the different market situations (Bekiros et al., 2016). The current results are related to Kannadhasan and Das (2020), who found that emerging financial markets react differently to the world's economic and geopolitical uncertainty and depend on both bear and bull markets. For example, a bullish financial market may respond to EPU differently than a bearish market. Moreover, a distinct connection has been observed between EPU and stock returns, given the low-tail intervals (negative- and positive-tails).
Our results show that in terms of the CHI_EPU impact on stock markets, information from CHI_EPU exerts a spillover effect on ASEAN5 markets. We infer some possible reasons for these effects. Pierce and Schott (2016) indicated that the impact of international trade generally depends on trade exposure and that greater trade exposure results in a stronger effect. Although they did not directly examine the transmission mechanism of EPU to systematic risk within the stock markets of ASEAN5, their findings suggest probable supply shock channels via inter-regional trade value chains (TVCs) network partnerships. This result may be attributed to trade connectivity between China and ASEAN and the increasing emphasis of China on regional production networks. Evidently, the preceding argument is supported by Abiad et al. (2020), who documented that services and trade networks between China and ASEAN have been strengthened further, which is generally driven by global value chains (GVCs). Furthermore, uncertainty shocks in emerging economies behave as supply shocks (Kumar et al., 2021). These arguments indicate that China’s vital role in regional production networks and GVCs is a potential supply-side channel for EPU contagion to its regional trade partners. Thus, we are convinced that the supply-side channel contributes to the strong effects of CHI_EPU on these markets. The spillover likelihood between economies with close trade and financial linkages is arguably high (Luk et al., 2017). Trade and financial linkages between countries significantly determine international spillovers (Forbes and Chinn, 2004), and the magnitude of EPU spillovers varies with bilateral relation factors (Balli et al., 2017).
V. Conclusion and Policy Implications
1. Conclusion
Our study contributes to the current literature on the influences of EPU on economic factors. We analyze the entire density distribution of returns/volatilities of stock markets from a sample of five emerging economies (i.e., ASEAN5), and determine the conditional distribution of the CHI_EPU index by applying non-parametric
2. Policy Implications and Recommendations
The findings of this study may have the following implications.
This study supports the extant literature by extending the understanding of how CHI_EPU shapes the performance of ASEAN stock markets, which has received minimal or no attention in the literature. Our study contributes and adds fresh evidence to the EPU-market nexus in the context of an emerging economy and regional trade partners. Thus, the outcomes of this study exhibit the importance of accounting for the transnational effects of CHI_EPU on regional financial markets, which is relevant for risk management and portfolio diversification (Wang et al., 2020). Furthermore, ASEAN5 policymakers should implement suitable policies and monitor changes in CHI_EPU. While deciding on investment strategies, they should consider risks related to China’s policies and design policies that will help reduce/avoid the negative effects of uncertainty and contagious effects.
The investment community may predict the stock market dynamics in these economies by including EPU in their information set. Investors can buy or take a long position (can sell or take a short position) on ASEAN5 financial markets when CHI_EPU is lower (higher). During extreme high and extreme low intervals (positive and negative tails), when stock returns vary inversely with EPU, investors in these economies may protect themselves by applying risk management strategies. However, as in the case of Malaysia, a positive association between CHI_EPU and stock returns is observed, and investors and market agents can diversify and lead to maximize their portfolio returns, specifically when there is high uncertainty in China.
The current study also has some limitations, which should be addressed in future research. First, given that this research used monthly data, future studies can use weekly or daily data to obtain accurate results. Future studies can also investigate the response of sectorial returns to CHI_EPU. Moreover, future studies may play a significant role in revealing how other associated economies, such as BRICS and G-20, respond to CHI_EPU to obtain generalized results for the contagious effects of CHI_EPU. Lastly, an interesting undertaking is to inspect whether CHI_EPU or EPU of ASEAN is more influential to the stock market dynamics of ASEAN5.
Tables & Figures
Table 1.
Summary for the Chinese EPU (CHI_EPU) Index and ASEAN5 Stock Returns
Figure 1.
Chinese EPU and ASEAN5 Stock Market Returns
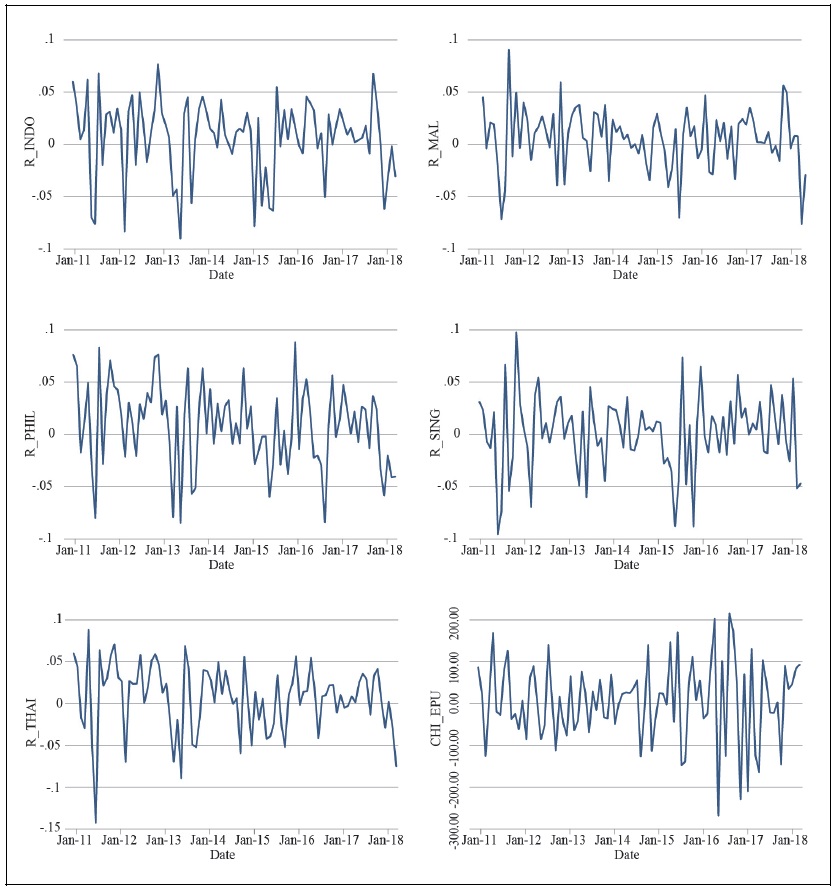
Figure 2.
The Kernel Density of Returns (a) and Volatility (b) under EPU Conditions: INDONESIA
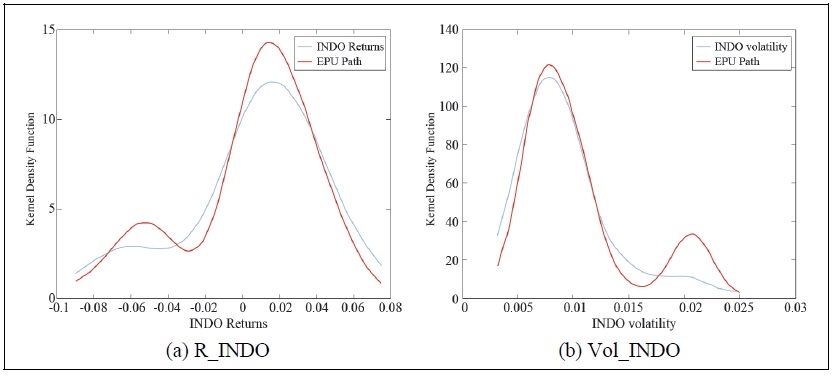
Table 2.
The Change Interval Area of ASEAN5 Stock Returns
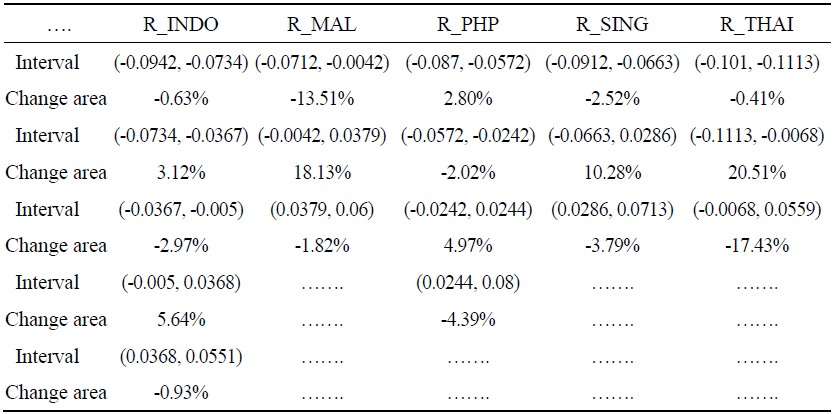
Table 3.
The Change Interval Area of ASEAN5 Stock Volatility
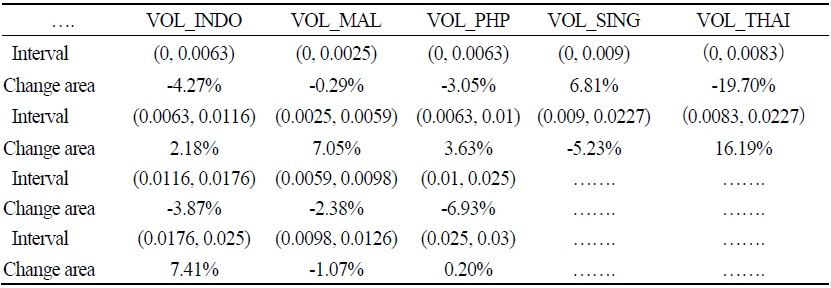
Figure 3.
The Kernel Density of Returns (a) and Volatility (b) under EPU Conditions: MALAYSIA
Figure 4.
The Kernel Density of Returns (a) and Volatility (b) under EPU Conditions: PHILLIPHINE
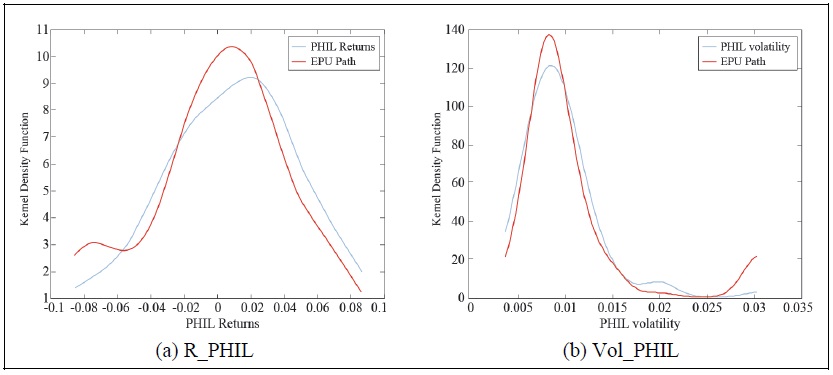
Figure 5.
The Kernel Density of Returns (a) and Volatility (b) under EPU Conditions: SINGAPORE
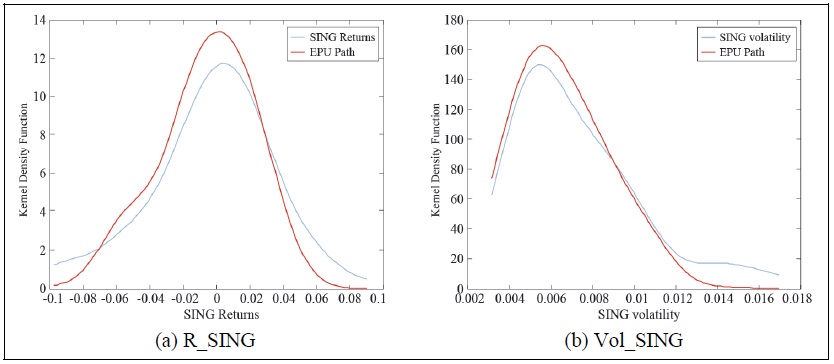
Figure 6.
The Kernel Density of Returns (a) and Volatility (b) under EPU Conditions: THAILAND
References
- Abiad, A., Arao, M., Dagli, S., Ferrarini, B., Noy, I., Osewe, P., Pagaduan, O., Park, D. and R. Platitas. 2020. “The economic impact of the COVID-19 outbreak on developing Asia.” ADB Briefs, no. 128. Asian Development Bank.
-
Antonakakis, N., Chatziantoniou, I. and G. Filis. 2013. “Dynamic co-movements of stock market returns, implied volatility and policy uncertainty.”
Economics Letters , vol. 120, no. 1, pp. 87-92.
-
Arouri, M., Estay, C., Rault, C. and D. Roubaud. 2016. “Economic policy uncertainty and stock markets: Long-run evidence from the US.”
Finance Research Letters , vol. 18, pp. 136-141.
-
Bachmann, R. and C. Bayer. 2013. “‘Wait-and-See’ business cycles?”
Journal of Monetary Economics , vol. 60, no. 6, pp. 704-719.
-
Baker, S. R., Bloom, N., Canes-Wrone, B., Davis, S. and J. Rodden. 2014. “Why Has US Policy Uncertainty Risen since 1960? ”
American Economic Review , vol. 104, no. 5, pp. 56-60.
-
Baker, S. R., Bloom, N. and S. J. Davis. 2016. “Measuring economic policy uncertainty.”
Quarterly Journal of Economics , vol. 131, no. 4, pp. 1593-1636.
- Baker, S. R., Bloom, N., Davis, S. J. and Marco C. Sammon. 2021. “What Triggers Stock Market Jumps?” NBER Working Papers, no. 28687. National Bureau of Economic Research.
-
Balcilar, M., Gupta, R., Kim, W. J. and C. Kyei. 2019. “The role of economic policy uncertainties in predicting stock returns and their volatility for Hong Kong, Malaysia and South Korea.”
International Review of Economics & Finance , vol. 59, pp. 150-163.
-
Balcilar, M., Gupta, R., Kyei, C. and M. E. Wohar. 2016. “Does economic policy uncertainty predict exchange rate returns and volatility? Evidence from a nonparametric causality-inquantiles test.”
Open Economies Review , vol. 27, no. 2, pp. 229-250.
-
Balcilar, M., Gupta, R., Nguyen, D. K. and M. E. Wohar. 2018. “Causal effects of the United States and Japan on Pacific-Rim stock markets: nonparametric quantile causality approach.”
Applied Economics , vol. 50, no. 53, pp. 5712-5727.
-
Balli, F., Uddin, G. S., Mudassar, H. and S.-M. Yoon. 2017. “Cross-country determinants of economic policy uncertainty spillovers.”
Economics Letters , vol. 156, pp. 179-183.
-
Bansal, R. and A. Yaron. 2004. “Risks for the long run: A potential resolution of asset pricing puzzles.”
Journal of Finance , vol. 59, no. 4, pp. 1481-1509.
-
Basher, S. A., Haug, A. A. and P. Sadorsky. 2016. “The impact of oil shocks on exchange rates: A Markov-switching approach.”
Energy Economics , vol. 54, pp. 11-23.
- Bekaert, G. and C. R. Harvey. 2003. “Market integration and contagion.” NBER Working Papers, No. 9510. National Bureau of Economic Research.
-
Bekiros, S. and R. Gupta. 2015. “Predicting stock returns and volatility using consumptionaggregate wealth ratios: A nonlinear approach.”
Economics Letters , vol. 131, pp. 83-85.
-
Bekiros, S., Gupta, R. and A. Majumdar. 2016. “Incorporating economic policy uncertainty in US equity premium models: A nonlinear predictability analysis.”
Finance Research Letters , vol. 18, pp. 291-296.
- Bhagat, S., Ghosh, P. and S. P. Rangan. 2013. “Economic Policy Uncertainty and Economic Growth in India.” IIMB Working Paper, no. 407. Indian Institute of Management Bangalore.
-
Bloom, N., Floetotto, M., Jaimovich, N., Saporta‐Eksten, I. and S. J. Terry. 2018. “Really uncertain business cycles.”
Econometrica , vol. 86, no. 3, pp. 1031-1065.
-
Boubaker, S., Jouini, J. and A. Lahiani. 2016. “Financial contagion between the US and selected developed and emerging countries: The case of the subprime crisis.”
Quarterly Review of Economics and Finance , vol. 61, pp. 14-28.
-
Brogaard, J. and A. Detzel. 2015. “The asset-pricing implications of government economic policy uncertainty.”
Management Science , vol. 61, no. 1, pp. 3-18.
-
Carrieri, F., Errunza, V. and K. Hogan. 2007. “Characterizing world market integration through time.”
Journal of Financial and Quantitative Analysis , vol. 42, no. 4, pp. 915-940.
-
Chiang, T. C. and X. Chen. 2016. “Empirical analysis of dynamic linkages between China and international stock markets.”
Journal of Mathematical Finance , vol. 6, no. 1, pp. 189-212.http://doi.org/10.4236/jmf.2016.61018
-
Christou, C., Cunado, J., Gupta, R. and C. Hassapis. 2017. “Economic policy uncertainty and stock market returns in PacificRim countries: Evidence based on a Bayesian panel VAR model.”
Journal of Multinational Financial Management , vol. 40, pp. 92-102.
-
Chuliá, H., Gupta, R., Uribe, J. M. and M. E. Wohar. 2017. “Impact of US uncertainties on emerging and mature markets: Evidence from a quantile-vector autoregressive approach.”
Journal of International Financial Markets, Institutions and Money , vol. 48, pp. 178-191.
-
Das, D. K. 2014. “The Role of China in Asia's Evolution to Global Economic Prominence.”
Asia & the Pacific Policy Studies , vol. 1, no. 1, pp. 216-229.
-
David, A. and P. Veronesi. 2002. “Option prices with uncertain fundamentals.” Available at
http://pietroveronesi.org/research/option.pdf -
Demir, E. and O. Ersan. 2018. “The impact of economic policy uncertainty on stock returns of Turkish tourism companies.”
Current Issues in Tourism , vol. 21, no. 8, pp. 847-855.
- Dizioli, A., Guajardo, J., Klyuev, V., Mano, R. and M. Raissi. 2016. “Spillovers from China’s growth slowdown and rebalancing to the ASEAN-5 Economies.” IMF Working Papers, no. 2016/2017. International Monetary Fund.
-
Drechsler, I. 2013. “Uncertainty, time‐varying fear, and asset prices.”
Journal of Finance , vol. 68, no. 5, pp. 1843-1889.
-
Edward, N. 2017. “The Rise of Chinese FDI into ASEAN.” Nikko Asset Management.
https://emea.nikkoam.com/files/pdf/insights/2017/20171005-The-Rise-of-Chinese-FDIinto-ASEAN.pdf -
Fan, J., Yao, Q. and H. Tong. 1996. “Estimation of Conditional Densities and Sensitivity Measures in Nonlinear Dynamical Systems.”
Biometrika , vol. 83, no. 1, pp. 189-206.
-
Forbes, K. J. and M. D. Chinn. 2004. “A decomposition of global linkages in financial markets over time.”
Review of Economics and Statistics , vol. 86, no. 3, pp. 705-722.
- Gilchrist, S., Sim, J. W. and E. Zakrajšek. 2014. “Uncertainty, financial frictions, and investment dynamics.” NBER Working Papers, no. 20038. National Bureau of Economic Research.
-
Gozgor, G. and S. Ongan. 2017. “Economic policy uncertainty and tourism demand: Empirical evidence from the USA.”
International Journal of Tourism Research , vol. 19, no. 1, pp. 99-106.
-
Gulen, H. and M. Ion. 2016. “Policy uncertainty and corporate investment.”
Review of Financial Studies , vol. 29, no. 3, pp. 523-564. -
Han, L., Qi, M. and L. Yin. 2016. “Macroeconomic policy uncertainty shocks on the Chinese economy: a GVAR analysis.”
Applied Economics , vol. 48, no. 51, pp. 4907-4921.
-
Han, X., Kant, S. and Y. Xie. 2018. “Bidder’s private value distributions in standing timber auctions in the Jiangxi Province of China.”
Canadian Journal of Forest Research , vol. 48, no. 12, pp. 1441-1455.
-
Hansen, B. E. 2004. “Nonparametric conditional density estimation.” Available at
https://www.ssc.wisc.edu/~bhansen/papers/ncde.pdf -
Hoque, M. E. and N. A. Yakob. 2017. “Revisiting stock market development and economic growth nexus: The moderating role of foreign capital inflows and exchange rates.”
Cogent Economics & Finance , vol. 5, no. 1. -
Jorion, P. 1995. “Predicting volatility in the foreign exchange market.”
Journal of Finance , vol. 50, no. 2, pp. 507-528.
-
Kannadhasan, M. and D. Das. 2020. “Do Asian emerging stock markets react to international economic policy uncertainty and geopolitical risk alike? A quantile regression approach.”
Finance Research Letters , vol. 34.
-
Kumar, A., Mallick, S. and A. Sinha. 2021. “Is uncertainty the same everywhere? Advanced versus emerging economies.”
Economic Modelling , vol. 101.
-
Lemmon, M. and M. R. Roberts. 2010. “The response of corporate financing and investment to changes in the supply of credit.”
Journal of Financial and Quantitative Analysis , vol. 45, no. 3, pp. 555-587.
-
Li, X.-M., Zhang, B. and R. Gao. 2015. “Economic policy uncertainty shocks and stock–bond correlations: Evidence from the US market.”
Economics Letters , vol. 132, pp. 91-96.
-
Li, X.-L., Balcilar, M., Gupta, R. and T. Chang. 2016. “The causal relationship between economic policy uncertainty and stock returns in China and India: Evidence from a bootstrap rolling window approach.”
Emerging Markets Finance and Trade , vol. 52, no. 3, pp. 674-689.
-
Li, Y., Ma, F., Zhang, Y. and Z. Xiao. 2019. “Economic policy uncertainty and the Chinese stock market volatility: New evidence.”
Applied Economics , vol. 51, no. 49, pp. 5398-5410.
-
Liu, L. and T. Zhang. 2015. “Economic policy uncertainty and stock market volatility.”
Finance Research Letters , vol. 15, pp. 99-105.
-
Luk, P., Cheng, M., Ng, P. and K. Wong. 2017. “Economic Policy Uncertainty Spillovers in Small Open Economies: The Case of Hong Kong.” Economic Policy Uncertainty.
https://www.policyuncertainty.com/media/HK_EPU_Paper.pdf -
Mei, D., Liu, J., Ma, F. and W. Chen. 2017. “Forecasting stock market volatility: Do realized skewness and kurtosis help?”
Physica A: Statistical Mechanics and its Applications , vol. 481, pp. 153-159.
-
Mensi, W., Hammoudeh, S., Reboredo, J. C. and D. K. Nguyen. 2014. “Do global factors impact BRICS stock markets? A quantile regression approach.”
Emerging Markets Review , vol. 19, pp. 1-17.
-
Miller, M. 2015. “China’s Relations with Southeast Asia: Testimony for the US-China Economic and Security Review Commission.” Report presented at Hearing on China’s Relations with Southeast Asia. May 13. Washington D.C.
https://www.uscc.gov/sites/default/files/Miller_Written%20Testimony_5.13.2015%20Hearing.pdf -
Momin, E. and M. Masih. 2015. “Do US policy uncertainty, leveraging costs and global risk aversion impact emerging market equities? An application of bounds testing approach to the BRICS.” MPRA Paper, no. 65834. Munich Personal RePEc Archive.
https://mpra.ub.uni-muenchen.de/65834/1/MPRA_paper_65834.pdf -
Oh, Y. A. 2017. “China’s Economic Ties with Southeast Asia.” World Economic Brief, no. 7-18. Korea Institute for International Economic Policy.
https://www.kiep.go.kr/gallery.es?mid=a20301000000&bid=0007&act=view&list_no=5016&cg_code= -
Pástor, L. and P. Veronesi. 2012. “Uncertainty about government policy and stock prices.”
Journal of Finance , vol. 67, no. 4, pp. 1219-1264.
-
Pástor, L. and P. Veronesi. 2013. “Political uncertainty and risk premia.”
Journal of Financial Economics , vol. 110, no. 3, pp. 520-545.
-
Pierce, J. R, and P. K. Schott. 2016. “The surprisingly swift decline of US manufacturing employment.”
American Economic Review , vol. 106, no. 7, pp. 1632-1662.
-
Rahman, M. U., Xu, B., Xiao, Y. and W.-T. Lai. 2019. “Explaining Disparities in AH Stock Premium Returns with Chinese Economic Policy Uncertainty: Evidence Based on a Non-Parametric Analysis.”
Journal of Advanced Computational Intelligence and Intelligent Informatics , vol. 23, no. 4, pp. 658-666.
-
Silverman, B. W. 1986.
Density estimation for Statistics and Data Analysis . London: Champman and Hall. -
Sum, V. 2012. “The reaction of stock markets in the BRIC countries to economic policy uncertainty in the United States.” Available at
http://dx.doi.org/10.2139/ssrn.2094697 -
Sum, V. 2013a. “The ASEAN stock market performance and economic policy uncertainty in the United States.”
Economic Papers: A Journal of Applied Economics and Policy , vol. 32, no. 4, pp. 512-521.
-
Sum, V. 2013b. “Economic policy uncertainty in the United States and Europe: A cointegration test.”
International Journal of Economics and Finance , vol. 5, no. 2, pp. 98-101.
-
Tsai, I.-C. 2017. “The source of global stock market risk: A viewpoint of economic policy uncertainty.”
Economic Modelling , vol. 60, pp. 122-131.
-
Wang, Z., Li, Y. and F. He. 2020. “Asymmetric volatility spillovers between economic policy uncertainty and stock markets: evidence from China.”
Research in International Business and Finance , vol. 53. -
Wu, T.-P., Liu, S.-B. and S.-J. Hsueh. 2016. “The causal relationship between economic policy uncertainty and stock market: a panel data analysis.”
International Economic Journal , vol. 30, no. 1, pp. 109-122.
-
Xu, B., Rahman, M. U. and H. Yu. 2020. “Forecasting Chinese EPU based on financial uncertainty in emerging market economies (EMEs): evidence from six selected East Asian economies.”
Economic Research-Ekonomska Istraživanja , vol. 34, no. 1, pp. 628-649.
-
Xu, B., Zeng, J. and J. Watada. 2014. “Chapter 2: Changes in Allocation Efficiency from Equity to Efficiency-Oriented.” In
Changes in Production Efficiency in China . New York: Springer. -
Xu, B., Zeng, J. and J. Watada. 2016.
Changes in Production Efficiency in China . New York: Springer. -
Yin, L. and L. Han. 2014. “Spillovers of macroeconomic uncertainty among major economies.”
Applied Economics Letters , vol. 21, no. 13, pp. 938-944.
-
Zhang, D., Lei, L., Ji, Q. and A. M. Kutan. 2019. “Economic policy uncertainty in the US and China and their impact on the global markets.”
Economic Modelling , vol. 79, pp. 47-56.