

- EAER>
- Journal Archive>
- Contents>
- articleView
Contents
Citation
| No | Title |
|---|
Article View
East Asian Economic Review Vol. 27, No. 2, 2023. pp. 145-176.
DOI https://dx.doi.org/10.11644/KIEP.EAER.2023.27.2.421
Number of citation : 0View
57
Download
43
Foreigners’ Short Selling in the Korean Stock Market around the Financial Crisis
|
|
Kyonggi University |
|---|---|
|
|
Sangmyung University |
|
|
Seoul National University |

Abstract
This paper investigates short selling behavior, particularly by foreign investors, during event days of non-normal times on an intraday basis in the Korean stock market around the global financial crisis. Although, in the several subsamples, we cannot excludes the predatory short-selling possibility, we did not find any conclusive evidence of abusive short selling behaviors in the overall intraday trading activities. While foreign investors demonstrate higher levels of participation in short-sale trading, their impact on price declines is not as pronounced compared to the effects of pure selling. Following the lift of the short-sale ban, foreign investors appear to engage in long selling trading more frequently, and their influence on price changes primarily stems from long selling rather than short selling compared to the past.
JEL Classification: G12, G14, G15
Keywords
Short Selling, Financial Crisis, Foreign Investors, Price Reversals, Short-sale Ban
I. Introduction
The controversy surrounding large investors’ short sales has been a longstanding issue, and the Korean stock market is no exception. The Korean stock market categorizes investors into three types: institutional, foreign, and individual investors. Short selling is typically a challenging practice for individual investors. In times of stock market decline, small investors have often accused the other two types of larger investors, especially those engaging in short selling, of causing the market to plunge. To address market turmoil, the Korean financial authority has frequently implemented short-sale bans as a first-aid measure. During the Covid-19 pandemic, while most other countries did not implement short-sale bans, Korea reinstated the practice in its stock market.
Financial regulators seem to favor the anti-short selling arguments and imposed temporary restrictions on short selling. In September 2008, financial regulators across the world began implementing temporary bans on short selling. The Financial Services Authority (FSA) in the U.K. banned short selling on 32 stocks of financial services companies on September 18th. The Securities and Exchange Commission (SEC) in the U.S. followed suit on September 19th by restricting short selling on all financial stocks. On the same day, the Canadian securities administrators also banned short selling of 13 shares of financial sector issuers that were inter-listed with the U.S. market. Australia implemented a temporary ban on all forms of short selling on September 21st, and several European countries also banned short selling of financial stocks. In Korea, a ban on short selling of all stocks was imposed on October 1st, 2008. The ban was lifted on June 1st, 2009, but remained in place for financial stocks.
These widely observed short-sale bans are at odds with the view of most financial sector practitioners and academic researchers: nothing is wrong with short selling (Brunnermeier and Oehmke, 2014, p. 2154; Deng et al., 2020) and the short-sale bans would lead to the opposite result to the intention of regulators, causing substantial deterioration of market quality (Beber and Pagano, 2013; Boulton and Braga-Alves, 2010). Most economists believe that short selling is a valuable market activity and that short sellers facilitate more efficient price discovery, mitigate price bubbles, increase market liquidity, and promote risk management activities: In New York Times, “Simply put, short-selling is a vital investment strategy that responds to market fundamentals and contributes to the integrity of stock prices” (Younglai, 2008).
Despite the significant discord between regulatory bodies and academic scholars, prevailing empirical research predominantly supports the benefits of short selling, with studies presenting alternative outcomes being comparatively infrequent.1 However, the pertinent question that needs to be asked is whether short selling poses a threat to the market stability in exceptional circumstances. When regulators put restrictions on short selling, it was clearly stated that they introduced those restrictions “on an emergency basis” and “at a time of extreme market turbulence, manifested in the forms of high and prolonged price volatility and downward pressure on the prices of financial stocks in particular” (FSA, 2009). To ascertain the justification for a short selling ban, thus, it is essential to examine whether short-selling practices are genuinely exploitative and predatory during times of stress and occasional market excesses, as opposed to regular market operations. If we include both normal and non-normal days in our sample, the results may be biased towards the normal days, and thus the empirical findings may not be informative of the non-normal time short selling. To identify the effects during non-normal times, we employ the methodology presented by Shkilko et al. (2007; 2009; 2012).
When examining the behavior of stock prices in Korea, it is important to consider the impact of foreign investors. During the financial crises that struck Asian countries in 1997 and 2008, foreign investors were often blamed for the crash of the financial and foreign exchange markets. For instance, Stiglitz (1998) contended that “developing countries are more vulnerable to vacillations in international capital flows than ever before.” Politicians and journalists also contributed to the anti-short-selling arguments. Former Malaysian Prime Minister Mahathir stated that “currency trading is unnecessary, unproductive and immoral” and that “they should be shot.” Even after two decades have passed, he still denounces “currency traders as unscrupulous profiteers in an immoral line of work.”2 In contrast to these claims, empirical research has found little evidence of the destabilizing effect of foreign investors’ activity on stock and currency prices.3
We intertwine these two narratives regarding the influence of short selling in the non-normal days and the involvement of foreign investors. First, we examine the impact of short selling on the Korean stock market on the event days of non-normal times at an intraday level. Second, we investigate whether foreign short sellers have a destabilizing effect on the market. Third, we analyze the impact of short selling restrictions during the global financial crisis period in the Korean stock market. Finally, we aim to identify the channels through which short-selling activity affects stock prices during non-normal times.
The rest of this paper is organized as follows: In Section II, we provide a brief overview of the regulations and restrictions on short selling in the Korean stock market, along with a review of the relevant literature. Section III presents the data used in this study and provides descriptive statistics on short selling trading activities in Korea. In Section IV, we outline our methodology for identifying event days, following the approach taken by Shkilko et al. (2007; 2009; 2012). The section also summarizes interesting features of event days. Section V focuses on the behavior of foreign short sellers. In Section VI, we estimate a dynamic panel model to investigate the intricate relationships between different factors that shape intraday price patterns. Our analysis also identifies various channels through which short-selling impacts stock prices. Finally, in Section VII, we draw our conclusion and provide a summary of the main findings of our study.
1)For unfavorable evidence, see
2)
3)For the analysis of the Korean market, see
II. Short-sale Bans in Korea and Related Literature
In the Korean stock market, investors are divided into three categories: individuals, institutions, and foreigners. The practice of short selling was first introduced in 1969 with several restrictions. However, it was only in 1996 and 1998 that institutional and foreign investors were permitted to engage in short selling, respectively. Initially, naked short sales were permissible, but this was later prohibited following the default of a large naked short-sale transaction in June 2000. It is important to note that the Korean stock market operates under up-tick rules, which require large short-selling transactions to be reported and disclosed. In times of market instability, short sales, particularly those made by foreign investors, have been repeatedly banned and criticized. Table 1 below illustrates the recent short-sale bans imposed in the Korean stock market.
Numerous studies have investigated the impact of short-sale bans in Korea, and most have failed to provide conclusive evidence of market destabilization. However, these bans seem to have some detrimental effects on market quality, which is consistent with research conducted in other countries. Table 2 below provides a summary of the literature on short sales in the Korean stock market.
There is little literature that has analyzed short-selling behavior during non-normal days. Brunnermeier and Pederson (2005) and Brunnermeier and Oehmke (2014) theoretically show that “even though short-selling activity is beneficial during normal times, at times of stress short sellers can destabilize a financial institution.” Shkilko et al. (2007; 2009; 2012) empirically identify days with large intraday price reversals (event days) and show that short sellers are abnormally aggressive and put substantially further pressure on price decline on those event days, even though short-selling enhances market efficiency during normal times. We also examine the short selling activity in the Korean stock market on an intraday basis during periods of market stress, with a specific focus on the influence of foreign short sellers.
To the best of our knowledge, Hahn and Rhee (2015) represent the first study to explore short selling activities in the Korean market on an intraday basis during non-normal times. Nonetheless, their analysis did not encompass the crisis period. The present study expands upon the work of Hahn and Rhee (2015) by extending the sample period to encompass the global financial crisis and by employing the Shkilko et al. (2007; 2009; 2012) methodology. Consequently, our investigation can be considered a more robust and rigorous examination relative to the previous study.
III. Data and Overview
We utilize complete intraday trades and quotes (TAQ) data for stocks listed on the Korea Exchange (KRX)4 that involve short sales, spanning from January 3rd, 2007 to December 28th, 2010. The TAQ and short selling data are sourced from the Korea Capital Market Institute (KCMI) and the KRX.5 At the raw data level, our examination comprises 773 stocks and 688,652 stock-day observations. However, to enhance the quality and reliability of our analysis, we restrict our sample by excluding stocks that were traded for less than 240 days per year, those with an initial year price below KRW 1,000, and those whose trading was suspended during the analysis period. Following the application of these filtering criteria, our final sample consists of 540,896 stockday observations of 704 stocks.
Figure 1 depicts the fundamental pattern of short-sale trading throughout the 2007-2010 period. Notably, in the Korean stock market, the volume of short-sale trading exhibited a consistent upward trend until the onset of the global financial crisis. Following the prohibition of short selling on all stocks from October 1st, 2008, the prevalence of short-sale transactions declined sharply, with negligible trading activities observed until the regulatory restriction was lifted on June 1st, 2009. Despite a rebound in short-sale trading activity following the lifting of the ban, the volume remained subjugated compared to the pre-crisis period.
Figure 2 shows that the proportion of daily trading volume attributable to short-sale trading during the examined period did not exceed 3%. During the ban period, the share of short-sale trading fell precipitously to nearly 0%, and even after the lifting of the ban, the proportion remained much lower than the pre-crisis levels. Figure 3 highlights the preponderance of foreign entities in the short-sale trading sphere. Specifically, the mean foreign share of short-sale trading activity was 87% over the sample period. The foreign share dipped to less than 40% during the ban period but subsequently returned to almost full recovery following the lifting of the ban.
4)
5)The short selling dataset of this paper does not include the unreported cases which could exert important influence on the stock prices.
IV. Identification of Event Days
1. Methodology to Identify Event Days6
An event day of non-normal times can be defined as a day with a large price reversal and the identification process involves two distinct stages. Firstly, a historical intraday volatility of stock
Subsequently, the range of price reversal within a day is established, with the reversal comprising a pre-rebound stage characterized by substantial price decline, and a post-rebound stage characterized by a recovery in price. For a day to be designated as an event day, two prerequisites must be met. Specifically, the decrease in the stock
The aforementioned methodology facilitates the distinction between an event day and a non-event day. Typically, on an event day, the stock price exhibits marginal fluctuations around its initial level throughout the day. However, instances of predatory short selling or adverse news can trigger sharp declines in prices. To differentiate between the two scenarios, the price must exhibit a recovery range between 90% to 110%. According to Shkilko et al. (2012, p. 350), the impact of new information is likely to result in a new price level at the end of the day, with a positive impact for the good news and a negative impact for the bad news. In cases where the price is influenced solely by predatory short-selling, the price is expected to converge to the initial level. Consequently, this requirement can be leveraged to eliminate the possibility of an information effect.
Following the identification of event days, we apply filters to our results to select cases that align with our purposes. Firstly, we exclude data for which prices at the beginning of the year were lower than 1,000 KRW and for which price changes are unavailable on specific trading days. Given our aim to identify information-free reversals, we seek to further minimize the effects of information by scrutinizing the DART8 disclosure system of FSS (Korean Financial Supervisory Service) and KIND9 system of KRX for corporate announcements and other news surrounding price reversal days. We exclude reversals that occur within a [–5; +5] day window surrounding an earnings or dividend announcement reported to FSS and KRX, as well as those that occur within a [–10; +10] day window surrounding other significant corporate news events transmitted by major business news outlets such as SEO (seasoned equity offerings), embezzlement, M&A, among others.
To conduct intraday analysis, we partitioned each regular trading day (9:00 am – 3:00 pm) into 72 intervals of 5-minute duration (
We further divided each price reversal into 10 pre-rebound and 10 post-rebound intervals. This additional procedure enables us to discern the influence of short selling over a longer time horizon, as some short selling may affect prices in the very short run, while others may exert an influence over a more protracted period. However, this method entails a reduction in the number of observations. Furthermore, we note that price declines may be larger as short-selling becomes increasingly aggressive. To examine this possibility and acquire a more comprehensive understanding of price fluctuations, we divided the entire sample into four groups based on the magnitude of the pre-rebound price decline |Δrvert| : 2 ×
2. Trend and Features of Event Days
Figure 5 and Figure 6 show a basic trend of event days. Out of 6,723 event day observations after the filtering, 2,087 event days were observed with short-sale trading, while on the other 4,636 event days, short selling was not observed at all. The event days both with and without short-sales declined during the period of short-sale ban, and recovered after the lift. One thing interesting is that ratio of event days with short-sales to those without short-sales becomes much lower after the ban than before. This finding together with the facts that most of short-sale trading is carried out by foreigners suggests that there might be some change in foreign short sellers’ behavior after the short-sale ban.
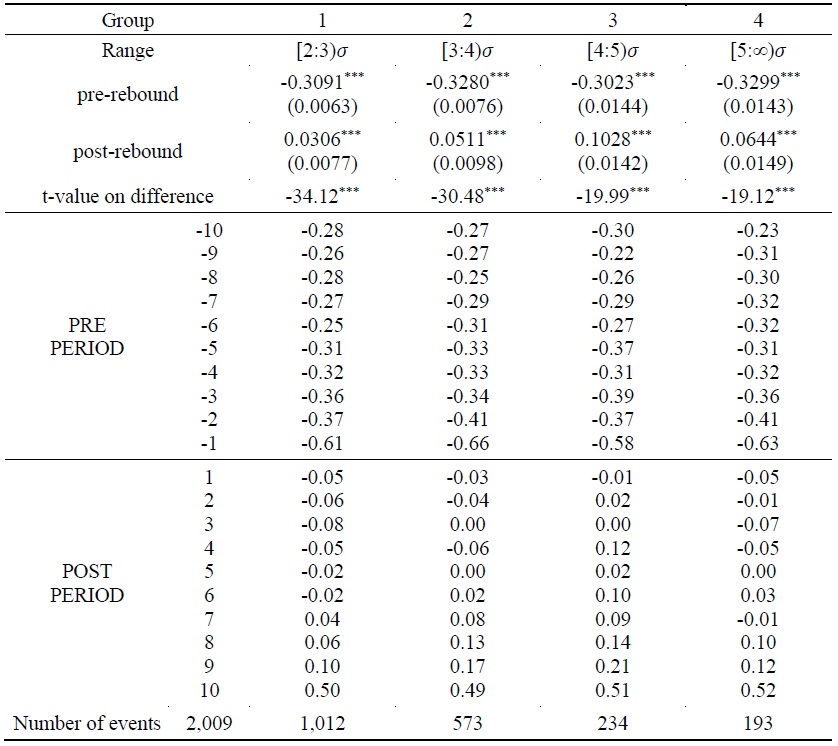
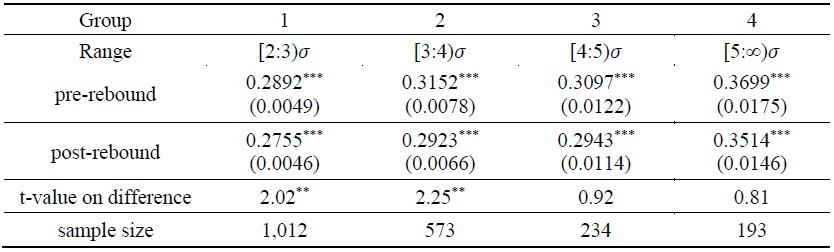
Table 3A and Table 3B indicate large intraday price reversals on event days and the numbers in the tables are cumulative intraday returns. Panel A shows the total pre-rebound and post-rebound cumulative returns in event days with short sales, and Panel B without short sales. It is confirmed that larger declines are followed by the lager rebound. For example, in the case of event days with short sale in Table 3A, the first group, in which the price change magnitude is between two and three standard deviations, shows the smallest price reversal of 2.27% point from -1.99% to 0.27%, while the last group, in which the magnitude is larger than five standard deviations, the biggest reversal of 5.04% point from -4.91% to 0.13%. Table 3B, the case of event days without short sales, exhibits the similar features but the degree of reversal is much higher.
6)This part is borrowed from
7)This example assumes |Δ
8)Data Analysis, Retrieval and Transfer System (DART).
9)Korea Investor’s Network for Disclosure System (KIND).
V. Characteristics of Short Selling Activity
The extant literature on short sales and market quality has largely centered on two questions: whether short sales are destabilizing for the market and if short sales are conducive to or detrimental to market efficiency. Prior to delving into these questions in depth, we shall initially examine whether short-sale trading exhibits abnormal patterns on event days. Nevertheless, the presence of abnormal short sales alone cannot be taken as an indication of market quality deterioration. Hence, we shall also investigate two further topics: the aggressiveness of short sales in relation to market destabilization and the liquidity associated with market efficiency.
1. Abnormality of Short Sale
In order to investigate the fundamental relationship between short sales and price reversions, we initially assess whether short sale activity is higher than usual on event days. To do this, we utilize the standardized short sale measure rather than the raw short-sale trading volume.

In the above equation (1),
Table 4A shows that the
One exception is the group 4 in the portfolio for the period between 2008 and 2009, where we observed distinct results. Furthermore, in the large size and high individual trading portfolio, the group 1 exhibited different outcomes and the other groups’ t-values are not statistically significant. Notably, we identified significant variations in the difference between pre- and post-rebound abnormal short-sales, indicating the presence of potentially predatory short-selling activities during a specific period and in certain stylized portfolios.
However, it seems that the overall intraday market data did not yield evidence supporting the existence of predatory short-sales. While there may have been instances of predatory short-selling during specific periods and within certain portfolios, these activities did not manifest in the broader intraday market data. Overall, our findings suggest that predatory short-selling activities may have occurred in isolated cases, but we did not find conclusive evidence of such practices in the overall intraday market data.
This results are different from Shkilko et al. (2009). In the U.S. market, they found that “Overall,
2. Aggressiveness of Short Sale
While the above short sale volume may hint short seller’s abusiveness, we need a separate measure of aggressiveness of short sales to be differentiated from other characteristics. Speculative short sellers tend to place sell orders more aggressively when prices are declining, resulting in a larger seller-initiated trading volume than buyer-initiated trading volume during the pre-rebound stage of price decline. Conversely, when prices rebound, buy orders will consume all sell orders, leading to a smaller seller-initiated trading volume (Sifat and Mohamad, 2015, p. 8; Shkilko et al., 2009, pp. 15-16). Therefore, as a measure of short-sale aggressiveness, we propose using the Short Order Imbalance (shoib):

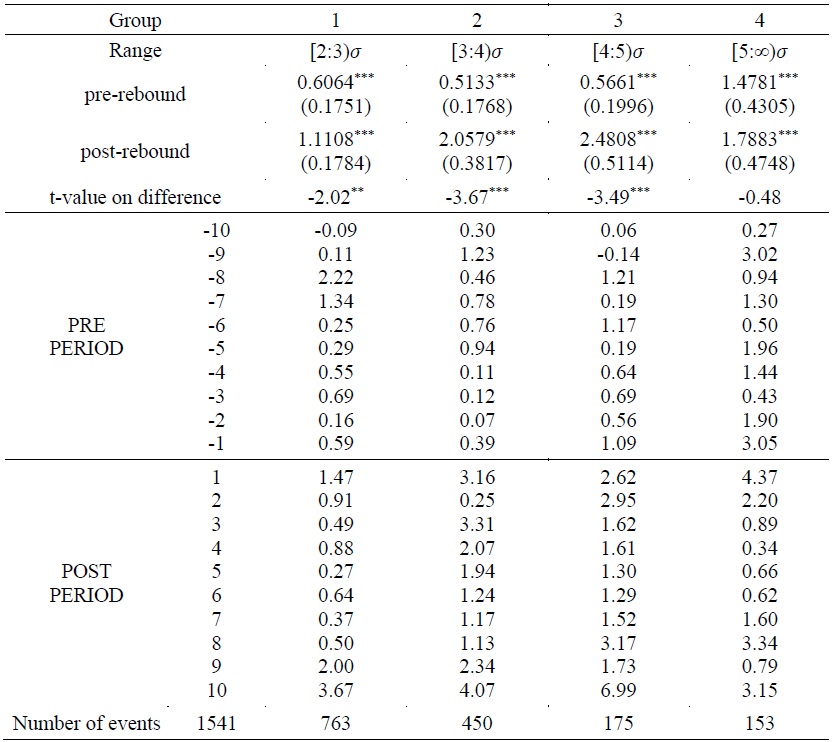
Table 5A illustrates the order imbalances of foreign short sellers in the pre-rebound and post-rebound stages on event days. Contrary to expectation, the foreigners’ selling activities appear to be relatively tepid in the pre-rebound stage of price declines. Estimates of order imbalances are generally positive but are not statistically significant. Conversely, in the post-rebound stage of price reversals, buyers are dominant and order imbalance becomes positive and statistically significant as theorized. This suggests that short sales are not predominantly seller-initiated and short sellers are not particularly assertive when price declines.
Order imbalances may be caused not only by foreign short selling, but also by long selling (Brunnermeier and Pederson, 2005).10 To analyze aggressiveness between short sales and long sales, we also present the estimates of long order imbalances (loib) in Table 5B. This demonstrates that as price drops, sellers dominate and long order imbalances are largely negative. This prevalence remains very strong until price begins to rebound. Once price reversals start in the post-rebound stage, long order imbalances become positive. In the case of non-short-sale, long order imbalances both in the pre-rebound and in the post-rebound stages are consistent with our expectations. This result shows that non-short-sale is much more aggressive than short sale.
3. Short sale and market liquidity
Short sales may negatively influence market efficiency by impacting market liquidity. Increasing short sales may lead to an increase in potential sellers within the market, which in turn can improve market liquidity through increased trading volumes and lower transaction costs (FSA, 2009, p. 10). On the other hand, Madrigal (1996) and Cai et al. (2006) posit that excessive short selling may reduce liquidity and, consequently, increase transaction costs, leading to a decline in market efficiency. In particular, when short sellers deliberately put excessive pressure on prices, they “may be actively promoting withdrawals of liquidity on the bid side or inducing additional short selling by contacting other traders” (Shkilko et al., 2009, p. 23) and thus exacerbate price declines during the pre-rebound stage.
As a measure of market liquidity, Amihud (2002) proposed the daily ratio of absolute stock return to its trading volume, averaged over time. Nevertheless, this measure has certain restrictions when applied to our data, thus we use the percentage quoted spreads as a proxy measure of market liquidity, as suggested by Shkilko et al. (2009).

Table 6 demonstrates that there is not a substantial difference between the two stages in terms of quoted spreads, however, spreads tend to be wider during the pre- rebound stage of price decreases than in the post-rebound stage of price reversals. This suggests that market liquidity might be slightly constrained during the period of price decrease compared to those of price reversal. As price decreases become more severe in the pre-rebound stage, quoted spreads also become more extensive, implying that more active short selling might limit market liquidity to a greater extent than less active scenarios.
10)“Long selling” means the sales of already purchased shares and this term is used as in
VI. Channels of Intraday Price Changes
In the preceding section, we explored the behavior of foreign short sellers, namely the abnormality of short sales, order imbalance of foreign investors, and liquidity, which are thought to impact intraday price change on event days with substantial price reversals. Although we have investigated the effects of these variables individually, it would be naive to assume that their influences on market price are independent. To identify the channels that short sales affect intraday piece changes, we must also examine the interplay of different variables in shaping intraday price patterns.
1. The Model
To investigate the influences of various factors on intraday price changes, we specify a dynamic panel model incorporating the variables considered above. Moreover, we include non-short sale volume (
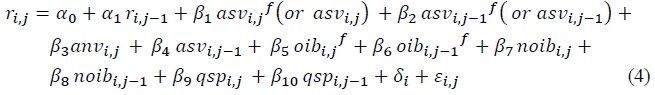
where
2. Results
Table 7 reports the empirical results of equation (4) with three different specifications, Model (A), Model (B), and Model (C) for the pre-rebound stage and with only Model (C) for the post-rebound stage.
Model (A) includes only abnormality trading variables on the event days (
Model (B) additionally includes order imbalance variables specifically associated with short sale (
Model (C) incorporates both short-sales of foreigners and non-short-sales (
An important and noteworthy result is that the coefficients of order imbalances of short-sales and non-short-sales are both positive and highly significant. However, the latter is much larger, suggesting that aggressive seller-initiated trading by non-short sellers can result in negative order imbalances and further price declines. Even though the impact of order imbalances of non-short-sale is substantial, the coefficient of
In Table 8, we divide the whole period into two sub periods; before the implementation of the short-sale ban on October 1st, 2008 and after the lifting the ban on June 1st, 2009. This is to analyze the differences between the two sub periods and measure the effect of the ban. The results in the pre-ban and the post-ban periods appear similar to one another, however, a few things are worth noting. Firstly, the coefficients of
When these findings are considered in conjunction with previous findings which suggest that event days increase in the post-ban period due to non-short-sale trading, and that most of short-sale is carried out by foreigners, it appears that foreigners are more likely to utilize non-short-sale trading in the post-ban period than before. Therefore, the ban may have some effect in changing foreigners’ behavior in the short market. Even after the lift of ban the foreigners’ influence on price changes seems to come more through non-short-sales rather than through short-sales compared to the past.
VII. Conclusion
In this paper, we examined the characteristics of short-sale activities not during normal times but during non-normal times of occasional excesses on an intraday basis in the Korean stock market. Using the methodology explained by Brunnermeier and Pederson (2005) and Shkilko et al. (2009; 2012), we first identified event days of large price reversals. In the Korean stock market, short-sale trading is mostly conducted by foreigners. The event days without short-sales outnumber those with short-sales, albeit the ratio of event days with short-sales decreased in the post-ban period. Moreover, we observed that the price reversals with short-sales are larger than those without.
Subsequently, we investigated whether short-sales affect market quality in terms of market destabilization and market efficiency, by examining short-sale abnormality, order imbalances, and market liquidity. We found little evidence of short-sale abnormality and abusiveness on the event days, and short sellers generally behaved as a contrarian traders rather than momentum traders. Comparing the aggressiveness of short-sales and non-short-sales by the variables of order imbalances, we found that non-short-sales are much more aggressive than short-sales in the Korean stock market. Observing the quoted spreads measuring market liquidity, we could find that market liquidity might be limited during the price decline stage, yet slightly improves during the price reversal stage.
With a dynamic panel model, we tried to identify the channels through which short selling activities affect stock prices during non-normal times, disaggregating the compound effect of short-sales into differentiated ones not only through the pure trading channel of short selling but also through other complicated channels such as long selling channel and market sentiment changes. Overall, the dynamic panel regressions show results consistent with the findings of the previous sections. In the Korean stock market, short sellers tend to exhibit contrarian trading behavior rather than momentum trading. Furthermore, seller-initiated aggressive trading of non-short-sale has been observed to lead to negative order imbalances and a subsequent price declines. For short sellers, pure selling channel is important, while both pure selling and other channels are important for long sellers. The effects of foreign short sellers on price change were found to be very small when compared to those of long sellers. Additionally, the quoted spreads were found to be insignificant, suggesting a limited influence of short-sales on market liquidity.
We also compared the pre-ban period and the post-ban period and found two things which are noteworthy. First, the impact of pure selling channel was reduced in the post-ban period. Second, foreign investors exhibited a greater use of non-short-sale trading in the post-ban period than before. This suggests that the ban has had some effect on shifting foreign investors’ behavior in the short market, even after the ban has been lifted. In other words, in the post-ban period, the influence of foreign investors on price movement was more likely to manifest through non-short-sale rather than short-sale compared to the pre-ban period.
Tables & Figures
Table 1.
Short-sale Bans in Korean Stock Markets
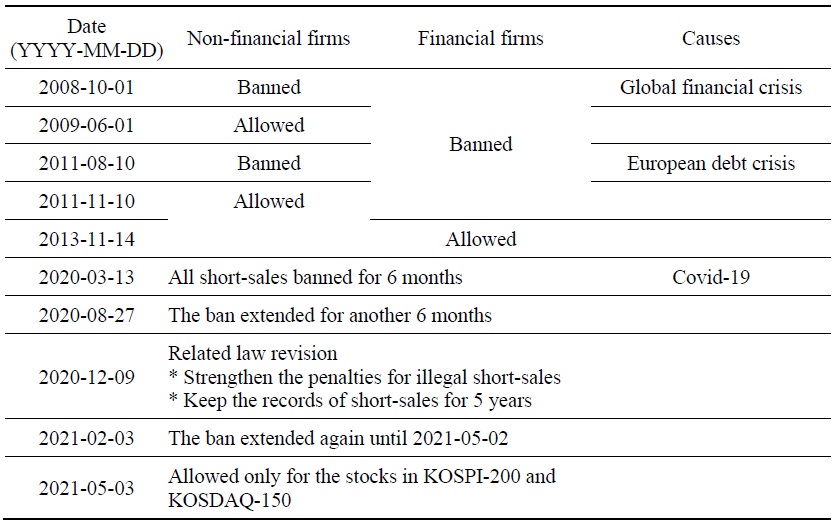
Table 2.
Literature Review on Short-sale Bans in Korean Stock Markets
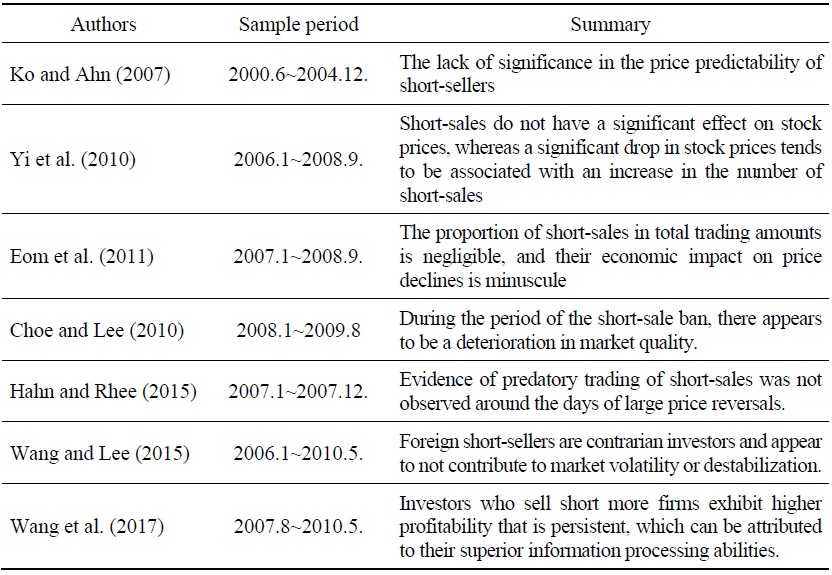
Figure 1.
Stock Trading Volume and Short-sales
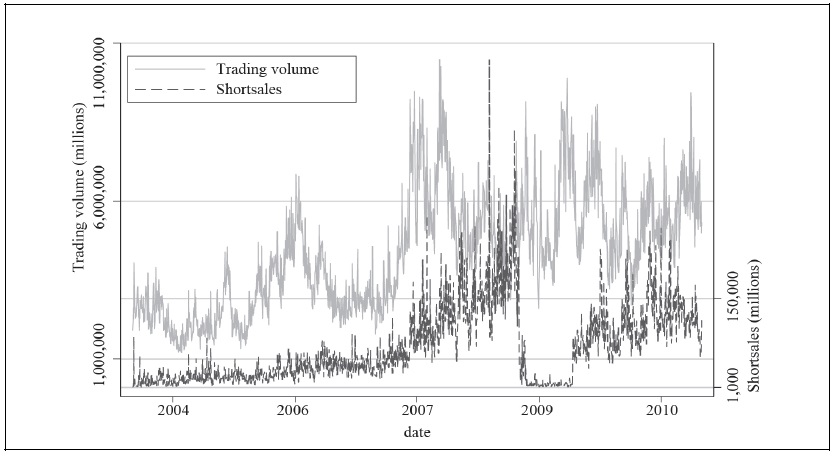
Note: In Korea, short-sales of are banned from October 2008 and, only for the non-financial firms, allowed again in June 2009.
Figure 2.
Proportion of Short-sales in Trading Volume
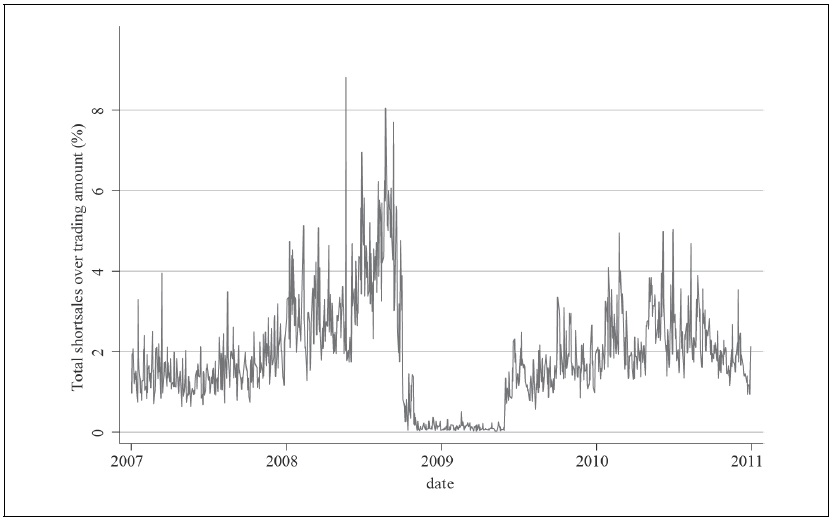
Figure 3.
Share of Short-sales: Foreigners vs. Institutions
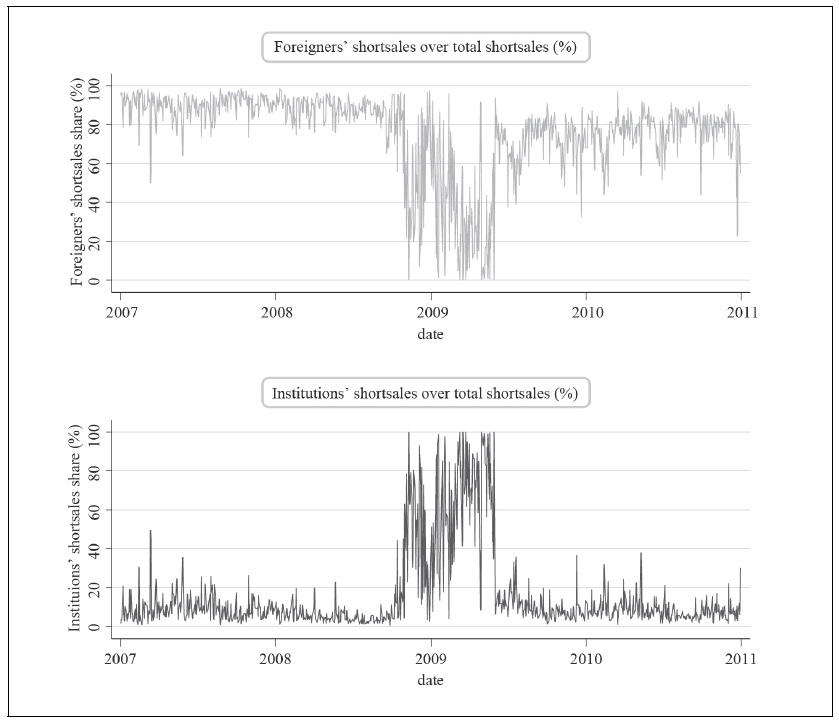
Notes: In Korea, short-sales of are banned from October 2008 and allowed again in June 2009 for the non-financial firms. During the ban, the portion of foreigners’ short-sales is dramatically reduced. Also note that the portion of individuals is negligible.
Figure 4.
Identification of large price reversal
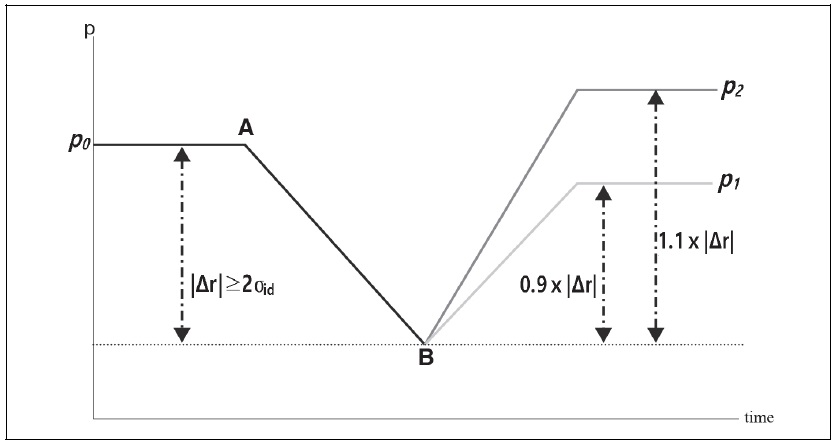
Notes: As in
Figure 5.
Number of Event Days
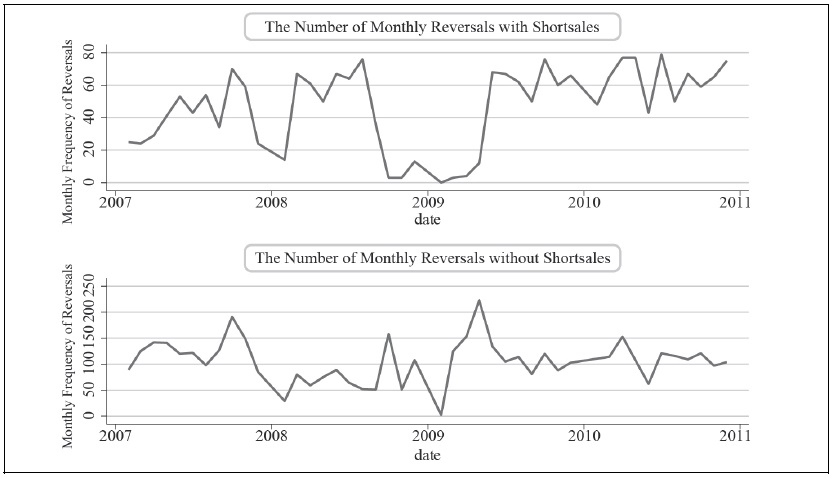
Notes: The event days are identified as days during which stock price declines to a level equal to (or lower than) two standard deviations of historical intraday cumulative returns,
Figure 6.
Ratio of Two Type Event Days (Short-sales / Non-short-sales)
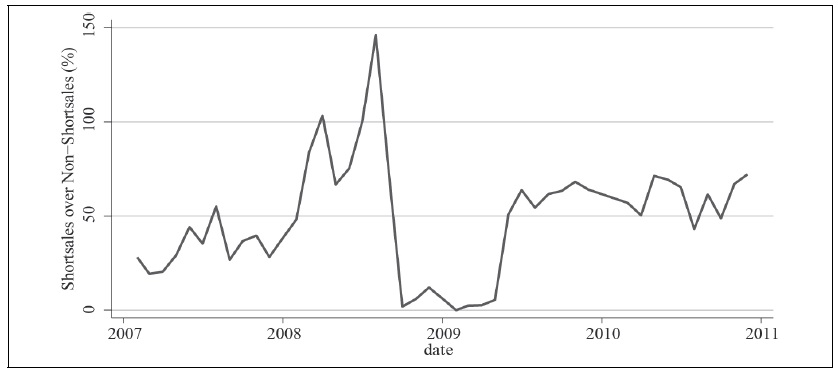
Notes: The event days are identified as days during which stock price declines to a level equal to (or lower than) two standard deviations of historical intraday cumulative returns,
Table 3A.
Price Changes on Event Days with Short-sale (%)
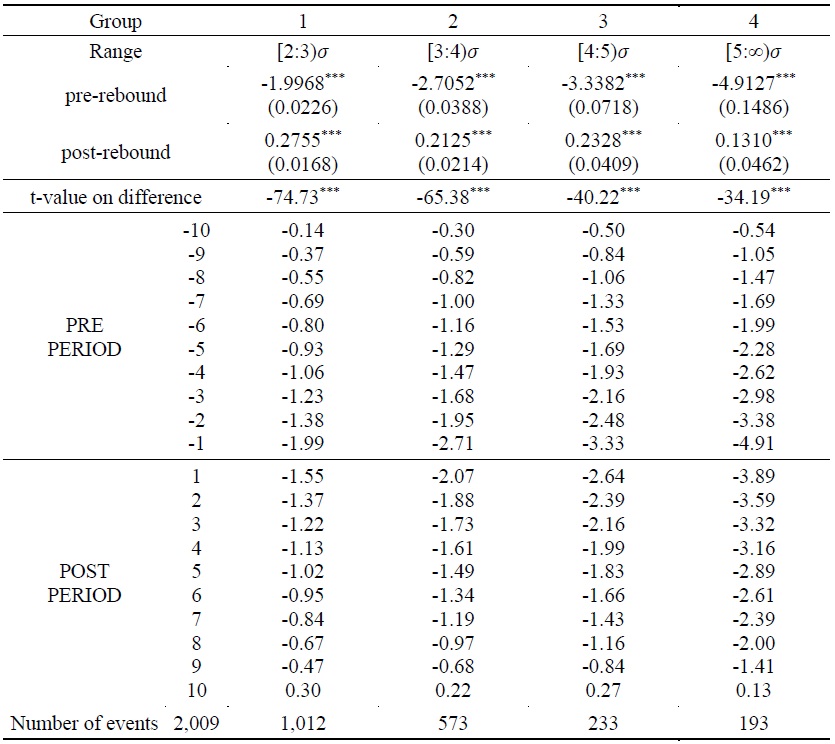
Notes: We followed the definitions in
Table 3B.
Price Changes on Event Days without Short-sale (%)
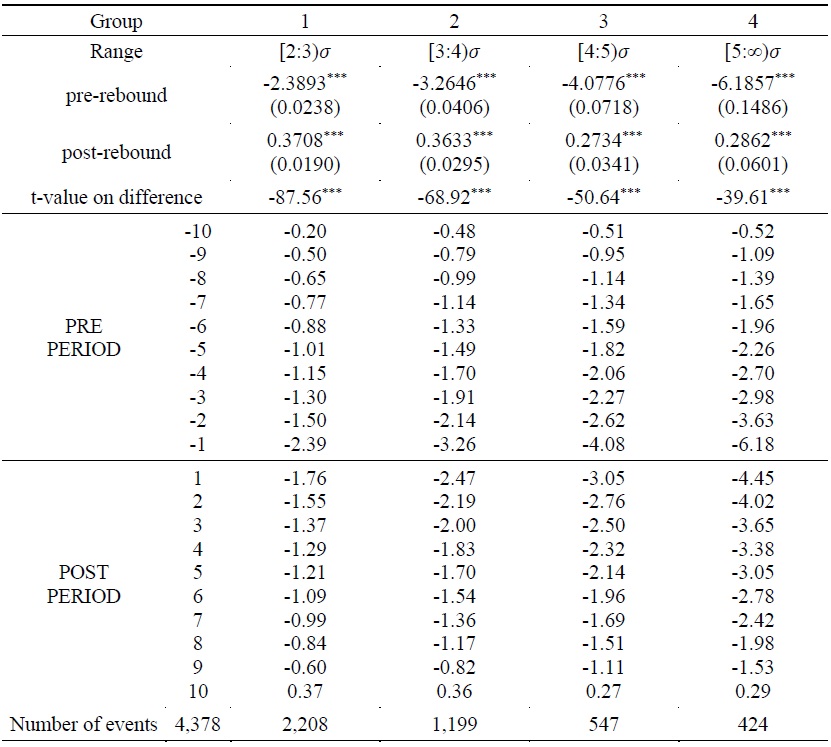
Notes: 1. Standard errors are reported in parentheses.
2. ***, ** and * denote significance at 1%, 5%, and 10% level, respectively.
Table 4A.
Foreigner’s Abnormal Short-sale during Large Price Reversals
Notes: The definitions of group, pre- and post-rebound are the same with Table 3. This table reports the foreigner’s “abnormal short-sale(asv)” which is demeaned by the mean and then denominated by the standard deviation.
Table 4B.
Foreigner’s Abnormal Short-sale during Large Price Reversals by Subperiods
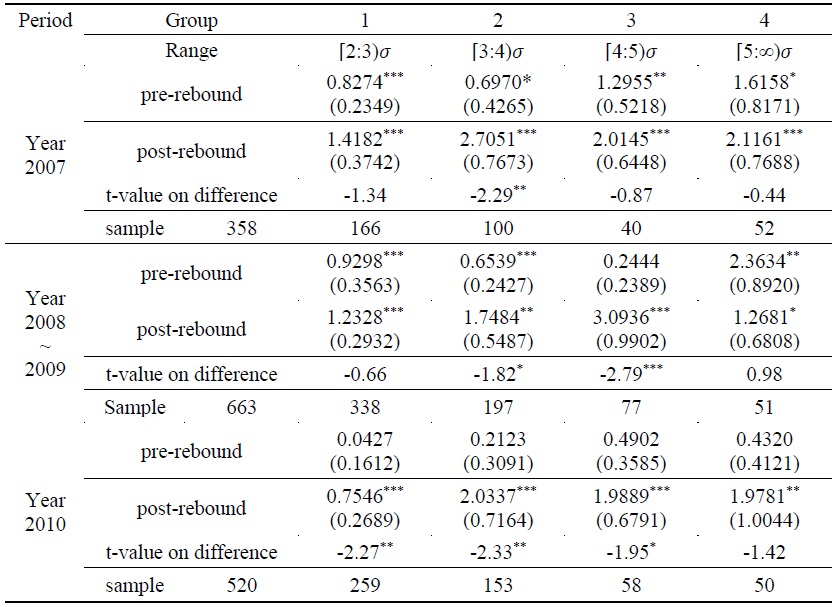
Note: The definitions of group, pre- and post-rebound are the same with Table 3.
Table 4C.
Foreigner’s Abnormal Short-sale during Large Price Reversals by Firm Size and Individual Trading Activities
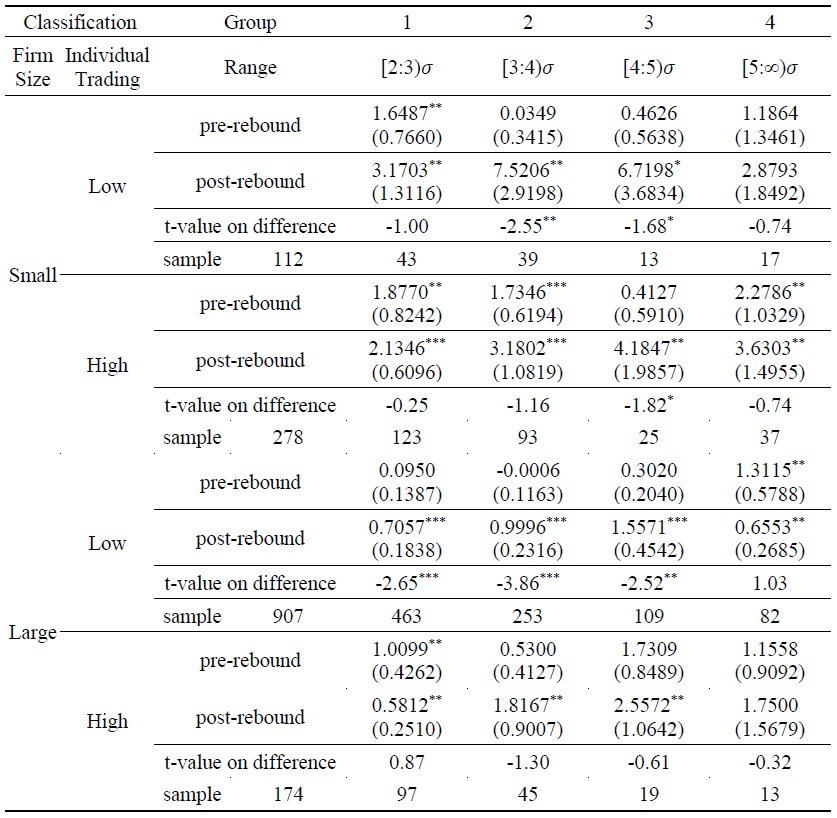
Notes: Firm size means the market value of the companies at the end of year 2006. The degree of individual trading activity is obtained by adding the individual buy and sell volumes and dividing by the total trading volume multiplied by 2 in 2006. The definitions of group, pre- and post-rebound are the same with Table 3.
Table 5A.
Short Order Imbalance of Foreigner during Large Price Reversals
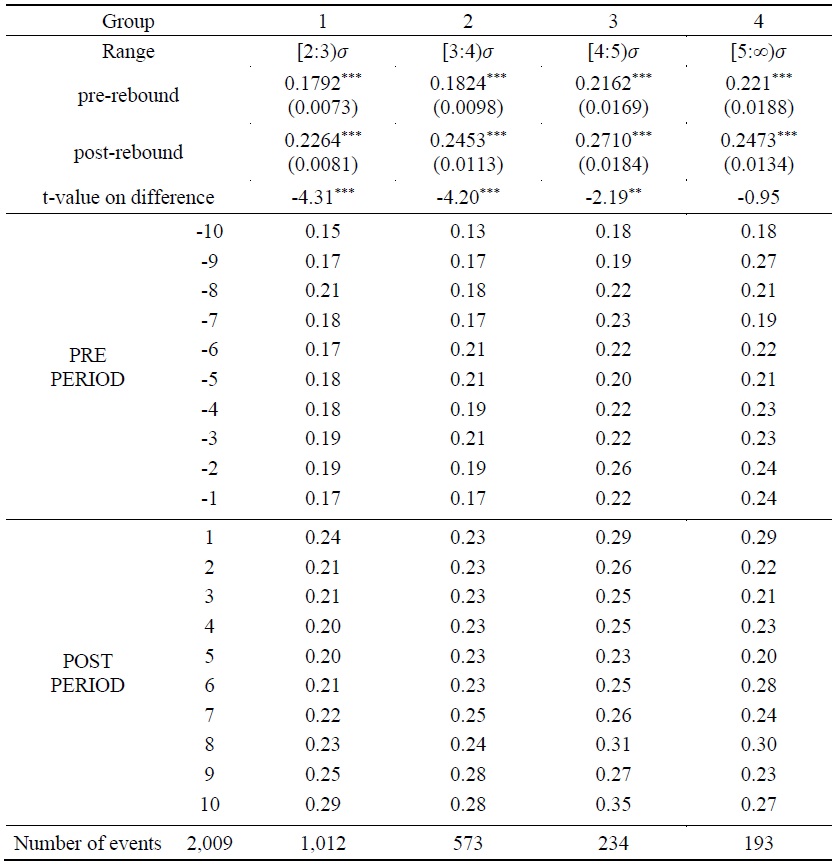
Notes: The definitions of group, pre- and post-rebound are the same with Table 3. This table reports the foreigner’s “short order imbalance (shoib)” during large price reversals.
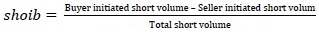 (see Equation 2). Standard errors are reported in parentheses. ***, ** and * denote significance at 1%, 5%, and 10% level, respectively.
Table 5B.
Order Imbalance with Non-short-sale during Large Price Reversals
Notes: 1. Standard errors are reported in parentheses.
2. ***, ** and * denote significance at 1%, 5%, and 10% level, respectively.
Table 6.
Liquidity: Quoted Spreads during Large Price Reversals
Notes: The definitions of group, pre- and post-rebound are the same with Table 3. This table reports the “percentage quoted spreads”(qsp) as a proxy measure of market liquidity, following 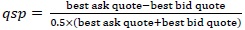 (see Equation 3). Standard errors are reported in parentheses. ***, ** and * denote significance at 1%, 5%, and 10% level, respectively.
Table 7.
Determinants of Intraday Returns
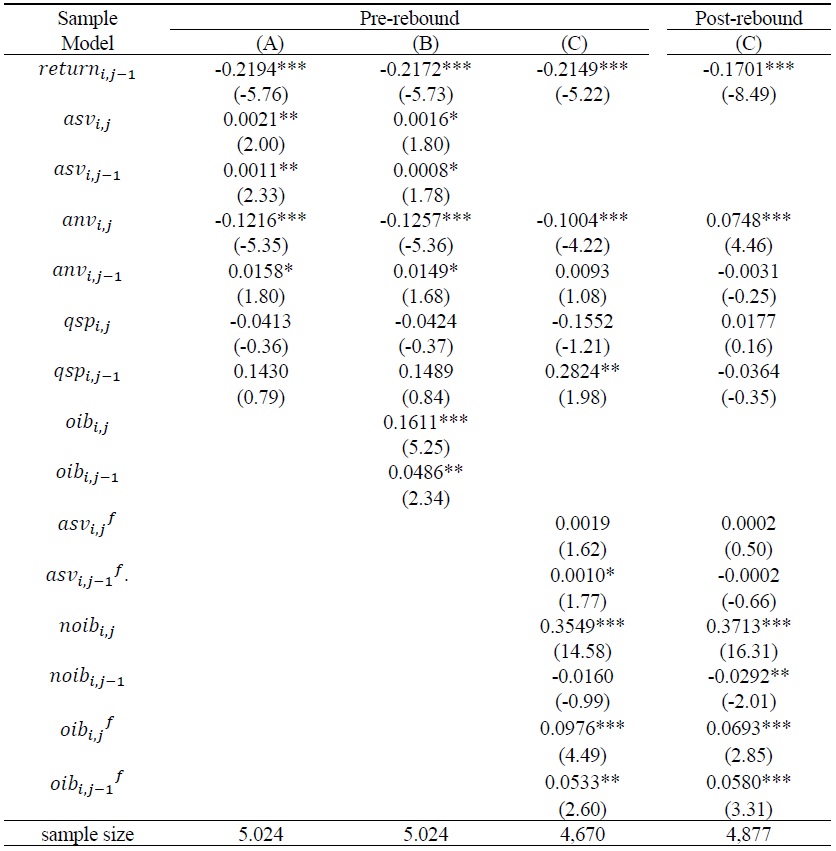
Notes: This table reports the dynamic panel regression of pre- and post-rebound returns. The explanatory variables
Table 8.
Determinants of Intraday Returns in the Pre-rebound
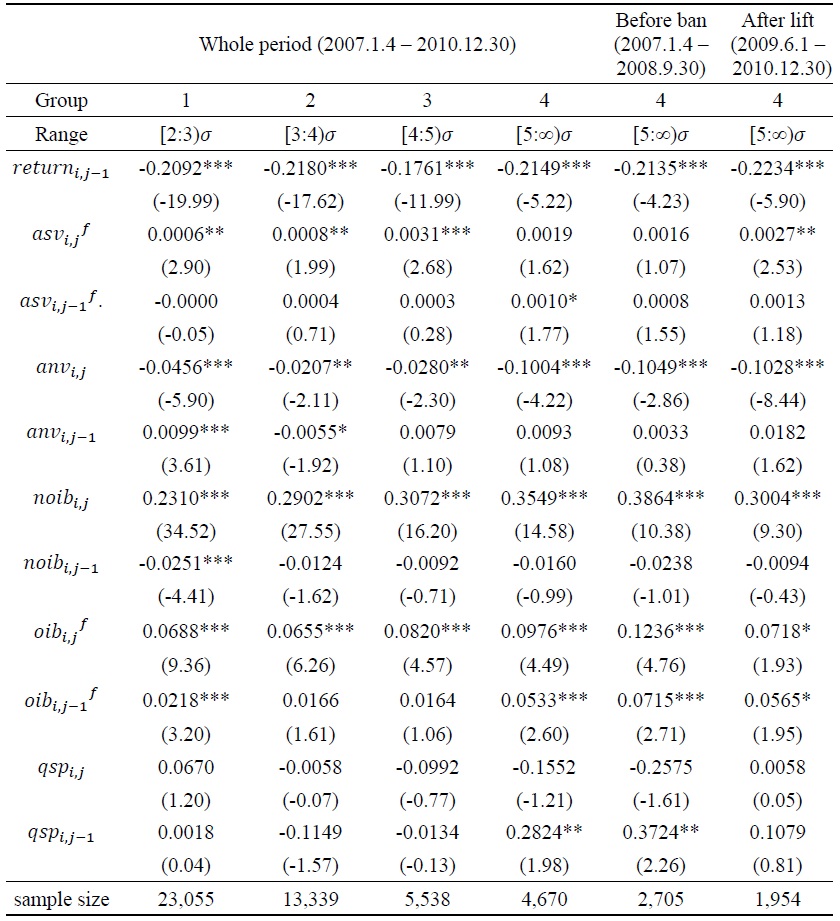
Notes: This table reports the regression results of model (C) in
References
-
Amihud, Y. 2002. “Illiquidity and Stock Returns: Cross-section and Time-series Effects.”
Journal of Financial Markets , vol. 5, no. 1, pp. 51-56.
-
Bark, T.-H. and Y.-S. Rhee. 2011. “The G20: from Seoul to Paris and Beyond.”
Journal of International Trade and Industry Studies , vol. 16, no. 1, pp. 1-42. -
Beber, A. and M. Pagano. 2013. “Short-selling Bans around the World: Evidence from the 2007-2009 Crisis.”
Journal of Finance , vol. 68, no. 1, pp. 343-381.
-
Bechmann, K. 2004. “Short Sales, Price Pressures, and the Stock Price Response to Convertible Bond Calls.”
Journal of Financial Markets , vol. 7, no. 4, pp. 427-451.
-
Binh, K.-B. 2009. “Do Foreign Investors’ Short Selling Destabilize Stock and Foreign Exchange Markets?”
KCMI Capital Market Perspective (ceased) , vol. 1, no. 1, pp. 46-69.https://www.kcmi.re.kr/publications/pub_end2_view?syear=2009&zcd=002001003&zno=463&cno=1538 (in Korean) -
Blundell, R. and S. Bond. 1998. “Initial Conditions and Moment Restrictions in Dynamic Panel Data Models.”
Journal of Econometrics , vol. 87, no. 1, pp. 115-143.
-
Boehmer, E., Jones, C. M. and X. Zhang. 2009. “Shackling Short Sellers: The 2008 Shorting Ban.”
Review of Financial Studies , vol. 26, no. 6, pp. 1363-1400.
-
Boulton, T. J. and M. Braga-Alves. 2010. “The Skinny on the 2008 Naked Short-Sale Restrictions.”
Journal of Financial Markets , vol. 13, no. 4, pp. 397-421.
-
Brunnermeier, M. K. and L. H. Pederson. 2005. “Predatory Trading.”
Journal of Finance , vol. 60, no. 4, pp. 1825-1863.
-
Brunnermeier, M. K. and M. Oehmke. 2014. “Predatory Short Selling.”
Review of Finance , vol. 18, no. 6, pp. 2153-2195.
-
Cai, J., Li, Y. and L. Xia. 2006. “Liquidity, Information Asymmetry and Short Sales Constraints: Evidence from the Hong Kong Stock Market.” Available at SSRN:
http://dx.doi.org/10.2139/ssrn.979688 -
Choe, H., Kho, B.-C. and R. M. Stulz. 1999. “Do Foreign Investors Destabilize Stock Markets? The Korean Experience in 1997.”
Journal of Financial Economics , vol. 54, no. 2, pp. 227-264.
-
Choe, H. and H.-J. Lee. 2010. “Effects of Short Sale Ban on Market Information on Liquidity and Price.” Paper presented at the 2010 Joint Conference with the Allied Korea Finance Associations. May 28 and 29. no. 43.
http://akfa.or.kr/bbs/board.php?tbl=reference&mode=VIEW&num=31&chr=&category=2010&findType=&findWord=&sort1=&sort2=&page=1 (in Korean) -
Deng, X., Gao, L. and J.-B. Kim. 2020. “Short-sale constraints and stock price crash risk: Causal evidence from a natural experiment.”
Journal of Corporate Finance , vol. 60.
-
Diether, K. B., Lee, K.-H. and I. M. Werner. 2009. “Short-sale Strategies and Return Predictability.”
Review of Financial Studies , vol. 22, no. 2, pp. 575-607.
-
Eom, K.-S., Binh, K. B. and J.-S. Kim. 2011. “Foreign Investors’ Short Sales and Individual Stock Prices in the Korean Stock Market.”
Financial Management Review , vol. 28, no. 3, pp. 139-187. (in Korean) - Financial Services Authority (FSA). 2009. “Short Selling.” FSA Discussion Paper, no. 09/1.
-
Hahn, S. B. and Y. Rhee. 2015. “Short Selling and Price Pressures in the Korean Stock Market.”
Korean Journal of Futures and Options , vol. 23, no. 2, pp. 265-287. (in Korean) -
Henry, T. R. and J. L. Koski. 2010. “Short Selling around Seasoned Equity Offerings.”
Review of Financial Studies , vol. 23, no. 12, pp. 4389-4418.
-
Kim, J.-S. 2010. “Analysis on the Effect of Short Sale Ban on the Korean Stock Market.”
KCMI Capital Market Perspective (ceased) , vol. 2, no. 1, pp. 49-59.https://www.kcmi.re.kr/publications/pub_end2_view?syear=2010&zcd=002001003&zno=465&cno=1550 (in Korean) -
Ko, B. and S.-K. Ahn. 2007. “Empirical Analysis on Short Sale’s Predictability of Future Return.” Paper presented at the 2007 Joint Conference with the Allied Korea Finance Associations.
https://www.earticle.net/Article/A241083 (in Korean) -
Madrigal, V. 1996. “Non-fundamental Speculation.”
Journal of Finance , vol. 51, no. 2, pp. 553-578.
-
Mitchell, M., Pulvino, T. and E. Stafford. 2004. “Price Pressure around Mergers.”
Journal of Finance , vol. 59, no. 1, pp. 31-63.
-
Park, K.-B. 2011. “How Does the Restriction of Shortsale Affect the Motives to Do Shortsale?”
Korean Journal of Business Administration , vol. 24, no. 2, pp. 723-741. (in Korean) -
Securities and Exchange Commission (SEC). 2006. “Economic Analysis on the Short Sale Price Restrictions under the Regulation SHO Pilot.” Office of Economic Analysis, U.S. Securities and Exchange Commission.
https://www.sec.gov/news/studies/2007/regshopilot020607.pdf -
Shkilko, A., Van Ness, N. and R. Van Ness. 2007. “Predatory Short Selling.”
mimeo . Financial Support from the NASDAQ Educational Foundation. -
Shkilko, A., Van Ness, N. and R. Van Ness. 2009. “Aggressive Short Selling and Price Reversals.” Available at SSRN
http://dx.doi.org/10.2139/ssrn.971210 -
Shkilko, A., Van Ness, N. and R. Van Ness. 2012. “Short Selling and Intraday Price Pressures.”
Financial Management , vol. 41, no. 2, pp. 345-370.
-
Sifat, I. M. and A. Mohamad. 2015. “Order Imbalance and Selling Aggression under a Shorting Ban: Evidence from the UK.”
International Review of Financial Analysis , vol. 42, pp. 368-379.
- Stiglitz, J. E. 1998. “Boats, Planes and Capital Flows.” Financial Times, March 25.
-
Wang, S.-F. and K.-H. Lee. 2015. “Do Foreign Short-sellers Predict Stock Returns? Evidence from Daily Short-selling in Korean Stock Market.”
Pacific-Basin Finance Journal , vol. 32, pp. 56-75.
-
Wang, S.-F., Lee, K.-H. and M. C. Woo. 2017. “Do individual short-sellers make money? Evidence from Korea.”
Journal of Banking & Finance , vol. 79, pp. 159-172.
-
Yi, J. and G. Jang. 2009. “Analysis on the Causation between Short Sale and Stock Price.” Paper presented at the 2009 Joint Conference with the Allied Korea Finance Associations, session 2, part 8. May 22.
http://akfa.or.kr/bbs/board.php?tbl=reference&mode=VIEW&num=30&chr=&category=2009&findType=&findWord=&sort1=&sort2=&page=1 (in Korean) -
Yi, J., Binh, K.-B. and G. Jang. 2010. “The Causal Relationship between Stock price and Short Sales: Evidence from the Korean Stock Market.”
Korean Journal of Financial Studies , vol. 39, no. 3, pp. 449-489. (in Korean) - Younglai, R. 2008. “Are Short-sellers really to blame.” New York Times, September 23.