

- EAER>
- Journal Archive>
- Contents>
- articleView
Contents
Citation
| No | Title |
|---|
Article View
East Asian Economic Review Vol. 27, No. 2, 2023. pp. 89-114.
DOI https://dx.doi.org/10.11644/KIEP.EAER.2023.27.2.419
Number of citation : 0View
135
Download
74
The Effects of Strategic Goods Control on Productivity: The Case of Korea
|
|
Kyung Hee University |
|---|---|
|
|
Kyung Hee University |

Abstract
This paper empirically examines how controlling strategic goods affects productivity by focusing on Korean industries from 2015 to 2019. We hypothesize that strategic goods control positively affects productivity because it promotes international trade by making up for market failures, building up national credibility, and stabilizing market environment; in turn, international trade contributes to productivity growth. The regression results are congruent with our hypothesis. The effects of strategic goods control on productivity were positive and statistically significant in general. These positive effects were more prominent in the group of industries that include strategic goods and, thus, are technologically intensive. The results also support that international trade is a key medium for the effects of strategic goods control on productivity. Consequently, our empirical results support government policy on strategic goods control, ensuring that strategic goods control can contribute to economic growth by reducing diplomatic friction and stabilizing the global market.
JEL Classification: F13, F14
Keywords
Strategic Goods Control, Total Factor Productivity
I. Introduction
Strategic goods refer to products, software, and technology that can be used for both civilian and military applications which can contribute to the proliferation of weapons of mass destruction, chemical, biological and nuclear weapons, and conventional military goods. To prevent their proliferation and guarantee national security, United Nations Security Council Resolution 1540 emphasizes that, based on effective legal basis, countries should implement strategic goods control and transparently release a list of strategic military and dual-use items. Also, the Wassenaar Arrangement has been established in order to contribute to security and stability, by promoting transparency and greater responsibility in transfers of conventional arms and dual-use goods and technologies, thus preventing destabilizing accumulations.1 Accordingly, nations of the world created a strategic goods control act that permits for imports, exports, and reexports of strategic goods: exports as well as imports of strategic goods requires a license from government. Korea also introduced a system for strategic goods control in 1987 and established the Korea Security Agency of Trade and Industry (KOSTI) by Article 29 of the Foreign Trade Act in 2007. Since then, KOSTI has officially managed strategic goods in business transactions in Korea and annually publishes their list by the 10-digit Harmonized System (HS) code, based on the international organization such as the Wassenaar arrangement and other countries. Figure 1 reports the annual number of strategic goods and their portion of total products in Korea during the 2015–2020 period. The number of strategic goods and their portion constantly increased in the mid and late 2010s. In particular, the year 2020 witnessed a sharp increase, implying that strategic goods control has become even more important for trade policies in Korea. Indeed, 17.16% of all processed goods are designated as strategic goods in 2020.2
Despite the growing importance of strategic goods control, few studies have examined strategic goods control (Jang and Song, 2021). In addition, previous studies have mainly focused on identifying the relationship between strategic goods control and international trade, rather than other economic performances. Considering that international trade is a key medium to affect policy goals such as economic growth and employment, it will be important to examine how strategic goods control ultimately affects these economic performances via international trade. The objective of this paper is to fill this seeming lacuna in the research. This paper empirically examines how strategic goods control affected productivity in Korea during the 2015–2019 period.
With this new research topic, this paper also makes other contributions. Previous studies have only considered strategic goods control as an independent variable due to data limitation in the regressions, ignoring other factors that might affect a dependent variable, resulting in an endogeneity problem due to the omitted variables. Unlike previous studies, we built up a unique industry-level dataset classified using the 3- or 5-digit Korean Standard Industrial Classification (KSIC) code and considered various industrial characteristics as well as strategic goods control. To do this, we converted the 10-digit HS code in the original dataset of KOSTI to the 5-digit KSIC and combined it with other industrial variables provided by Statistics Korea. In addition, we considered two proxies, the frequency index and the coverage ratio, to measure the level of strategic goods control by industry. For this, previous studies have considered the total number of strategic goods at the industry level; however, this number is more likely to be higher if an industry contains greater sub-industries and, thus, seems not related to a greater level of strategic goods control. Based on previous studies on non-tariff barriers, we expect the frequency index and the coverage ratio to solve this disadvantage of considering total numbers of strategic goods control.
The rest of the paper is organized as follows. Section II summarizes previous studies and sets up the research hypothesis. Section III provides econometric specifications and data sources. Section IV reports the empirical results. Finally, Section V provides a conclusion and policy implications.
1)
2)Also see the webpage of KOSTI for other information such as a specific list of strategic goods and annual trend of strategic goods trade. (
Ⅱ. Literature Review and Research Hypothesis
1. Strategic Goods Control and International Trade
The previous studies addressed that strategic goods control can simultaneously have both positive and negative effects on international trade. Concerning the possibility of reexports to third countries, countries exporting dual-use items and strategic arms will restrict international trade if their partners have uncertain effects on national security. In response, trade partners will adopt a credible system for strategic goods control to enhance national security and restrict indiscriminate proliferation of dual-use items and strategic arms. With this legitimacy of strategic goods control, countries can reduce the possibility of war and terror attacks and avoid diplomatic friction. In addition, a system for strategic goods control can prevent exporting firms from engaging in illegal activities due to careless management of strategic goods and costs caused by economic sanctions. Hence, strategic goods control can resolve market failure by asymmetric information between trading countries, build national credibility, stabilize market environment, and, thus, facilitate international trade (Cupitt et al., 2001; Fuhrmann, 2008; Jones and Karreth, 2010; Jang and Song, 2021).
In the case of Korea, Kim (2012) found that strategic goods control had positive effects on imports from developed countries during the 1988-2011 period. Jang and Song (2021) also found that strategic goods control positively affected international trade during the 2015–2019 period in Korea. In particular, they found that the effects on imports were greater than those on exports and the positive effects were more prominent in capital-intensive industries. All these studies addressed that the positive effects come from an increase in national security and market stability due to strategic goods control.
Meanwhile, it is very clear that strategic goods control can be barriers to international trade. In a system of strategic goods control, firms should obtain government permission to export or import strategic goods via complicated administrative procedures. These procedures cause compliance costs for administration, reduce production efficiency, and, thus, hamper international trade (Kowalczyk and Riezman, 2009). In particular, these costs are more prominent if a country uses strategic goods control as an instrument to gain economic benefits over its original legitimacy, such as preventing technology transfer and protecting domestic industries (Chellaney, 1994). A survey of 202 firms in the United States space industry estimated that the compliance cost for strategic goods control averaged $50 million per year for the industry (Chao and Ben-Ari, 2008). Elwell (2000) also estimated the cost of strategic goods control to range from $500 million to $14 billion in the United States.
2. International Trade and Productivity Growth
Many studies have found that international trade induces an increase in productivity (De Hoyos and Iacovone, 2013; Jang et al., 2015). For exports, the learning-by-exporting theory emphasizes the export-led growth through tight competition and technology spillover. After entering export markets, exporters participate in tighter competition with local firms with a high level of quality and different technical standards led by foreign consumers’ needs (Salomon and Shaver, 2005; De Loecker, 2013; Fernandes and Isgut, 2005). To survive this competition, exporting firms should be more efficient, develop new technologies, and improve productivity. In this process, there will be technology spillovers between firms and, thus, an increase in industry-level productivity in aggregate (Castellani, 2002; Westphal, 2002).
Several studies empirically support the learning-by-exporting theory. Salomon and Shaver (2005) found that Spanish exporting firms had significantly positive effects on product innovation and productivity during the 1990?1997 period. De Loecker (2013) also found that, in Slovenian manufacturing firms, exports positively affected productivity growth ranging from 1.08% to 7.38%. These phenomena were also found in other countries such as Colombia, Mexico, and Morocco (Fernandes and Isgut, 2005) as well as Italy (Castellani, 2002). For the case of Korea, Hahn (2004) and Ahn (2005) found that exports increased the total factor productivity by 1.4% to 2.7% during the 1990?1998 period. Lee and Choi (2009) found that the learning-by-exporting effects lasted about 4 years during the 1993?2003 period. Seo et al. (2017) showed that exports had positive effects on sales growth after the global financial crisis during the 1980?2012 period, and the learning effects were more pronounced in technology-intensive industries.
For imports, imported intermediate goods play an important role in productivity growth, especially when they are technologically advanced and have a wide range of varieties (Hasan, 2002; Goldberg et al., 2010; Amiti and Konings, 2007; Abreha, 2019; Camino-Mogro et al., 2020). Firms importing intermediate goods can reduce production costs and improve productivity via foreign technology transfer (Kasahasa and Rodrigue, 2008; Goldberg et al., 2010; Máñez Castillejo et al., 2020).
Several studies empirically support these phenomena. Lööf and Anderson (2010) found that imports from R&D-intensive countries had positive effects on the labor productivity of Sweden’s manufacturing firms during the 1997?2004 period. Abreha (2019) estimated that, in Ethiopia, imports increased productivity by 3.5% to 4.9% during the 1996?2011 period. Camino-Mogro et al. (2020) showed that Ecuadorian manufacturing firms using foreign intermediate goods increased productivity by 7% during the 2007?2018 period. The same results were also found in other countries, such as China (Yu and Li, 2014), India (Hasan, 2002; Goldberg et al., 2010), Chile (Kasahara and Rodrigue, 2008), Hungary (Halpern et al., 2015), and Indonesia (Amiti and Konings, 2007). For the case of Korea, Kim et al. (2000) estimated that productivity in manufacturing industries increased by 0.19% when the import growth rate increased by 1% during the 1966?1999 period. Lee and Kim (2003) found the same results in 17 industries during the 1990?2001 period. Jang and Cho (2015) showed that the increase in imported intermediate goods caused by free trade agreements had positive effects on productivity during the 2002?2011 period.
3. Research Hypotheses
Based on our meticulous literature review, we speculate that strategic goods control will affect productivity indirectly through the channel of international trade. In fact, previous studies have addressed that the effects of strategic goods control on international trade are theoretically undetermined due to the trade-off relationship between an increase in credibility and compliance costs. This trade-off relationship varies depending on economic conditions by countries, periods, items, and industries. Meanwhile, for the case of Korea, previous studies have empirically found that strategic goods control generally had positive impacts on international trade during the 2010s (Kim, 2012; Jang and Song, 2021). In turn, international trade had positive impacts on productivity in Korea during the 2010s (Jang and Cho, 2015; Jang et al., 2015). In particular, given that, in Korea, strategic goods control promoted imports more prominently and imported strategic goods mostly come from developed countries with high technologies such as the United States, this increase in imports led by strategic goods control might induce greater technology transfer and spillover effects. Technology transfer and spillover effects by imports can be a major driving force of economic growth (Eaton and Kortum, 1996; Schneider, 2005). Consequently, we hypothesize that Korea might benefit from productivity growth after applying strategic goods control (Jones and Karreth, 2010).
Ⅲ. Econometric Specifications and Data
1. Econometric Specifications
Based on the literature review, we build up the following three equations to empirically examine the effect of strategic goods control on productivity considering international trade as a medium.


where
Equation (1) represents the regression model for the effects of strategic goods control on international trade. Equation (2) represents the regression model for how international trade affects the productivity. Finally, Equation (3), the main regression model, presents the regression model for the effect of strategic goods controls on productivity.
The sample period covers the 2015–2019 period. For
2. Dependent Variables
In (1) and (2),
We consider total factor productivity (TFP) and labor productivity as productivity indicators. We calculate the TFP index from a log form of the Cobb-Douglas production function as follows:

where  represent coefficient estimates from the regression analysis of ln
We proxied capital stock by the annual balance of tangible assets that consist of land, buildings, and machineries and labor force by the total number of employees. Therefore, the TFP index is calculated by the difference between the actual total outputs and the predicted one. Also, we calculated labor productivity, ln
3. Independent Variables
We built a unique sector-level dataset by obtaining the annual list of strategic goods from KOSTI. As the original data were classified using the 10-digit HS code, we converted the data to the 3-digit KSIC with the correlation tables provided by Statistics Korea. Based on it, we set up
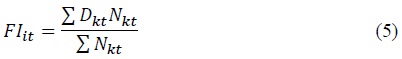
In the denominator, Σ
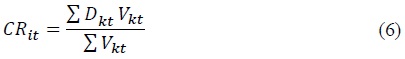
where Σ
Through three regression models in (1)-(3), we can expect the effect of strategic goods control on productivity through international trade promotion. As the previous studies have generally shown that strategic goods control positively affects proposing countries’ exports and imports. Therefore, we expect
In (1)-(3), we additionally considered other control variables that could affect international trade and productivity, based on previous studies.
However, the effects of market concentration on productivity are more complicated. The rise in market concentration induces large firms to perform more innovations with greater profits and contributes to booming productivity growth on the one hand (Klenow et al., 2019). On the other hand, Disney et al. (2000), Zitzewitz (2003), and Badinger (2007) found that intensified market competition (i.e., lower market concentration) has a positive effect on productivity because firms try to be more efficient to survive in fierce competition. Accordingly, the sign of
The same is true of
4. Econometric Methodologies and Summary Statistics
To determine an economic method in (1)-(3), we performed the Davidson-Mackinnon test of exogeneity. Not all test results rejected the null hypothesis that independent variables are exogenous. In addition, we performed the Woodridge test for autocorrelation for the regressions in (1)-(3), which showed that all test results rejected the null hypothesis that there is no first-order autocorrelation. However, we were still concerned that there would be an endogeneity problem drawn from omitted variables and reverse causality despite the results of the Davidson-Mackinnon test.
Therefore, we performed the Arellano-Bond estimator with the two-step generalized method of moments (GMM), which can solve both endogeneity and autocorrelation problems for the regressions in (1)-(3) (Arellano and Bond, 1991). The two-step GMM is a dynamic panel regression using the lagged value of differential variable as an additional instrumental variable as well as lagged dependent variables. For estimating TFP in (4), we performed the two-way fixed effects models with robust standard errors adjusted for clusters in industries after performing the Hausman test (Moulton, 1990). Table A1 in the appendix reports the regression results.7
Tables 1 and Table 2 report the summary statistics of the variables and the coefficients of correlation between independent variables, respectively. As the coefficients of correlation were less than absolute value of 0.8, we concluded that there were no symptoms of multicollinearity.
3)
4)HHI is calculated by squaring the market share of each firm competing in an industry and summing them. It ranges from 0 to 10,000, with a higher (lower) value indicating a monopoly (perfect competition).
5)
6)
7)We also performed the Davidson-Mackinnon test of exogeneity for (4) and the result did not reject the null hypothesis that independent variables are exogenous.
Ⅳ. Empirical Results
1. Mining and Manufacturing
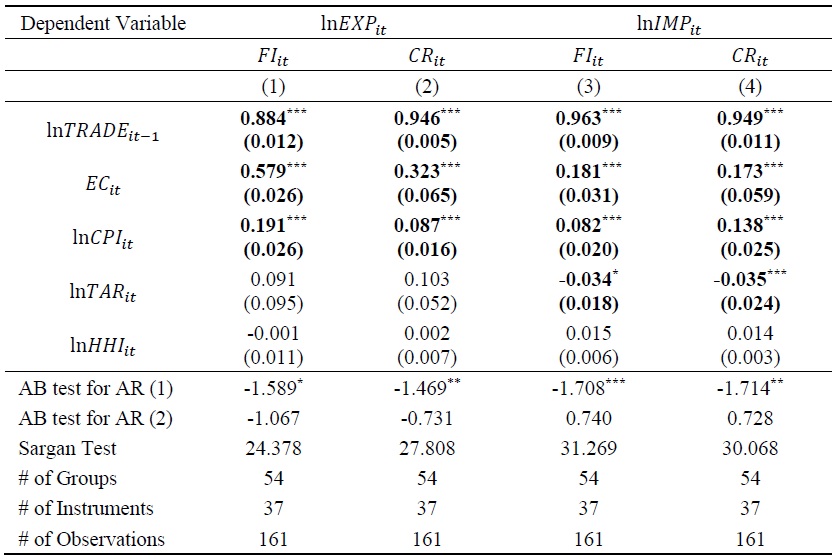
For the sample group of all mining and manufacturing sectors, Tables 3-5 shows the regression results of the Arellano-Bond estimator for (1)-(3), respectively. Table 3 reports the regression results for the effect of strategic goods control on international trade in (1). Columns (1) and (2) are the regression results for ln
The coefficient estimates of ln
All columns in Table 3 show that the coefficient estimates of
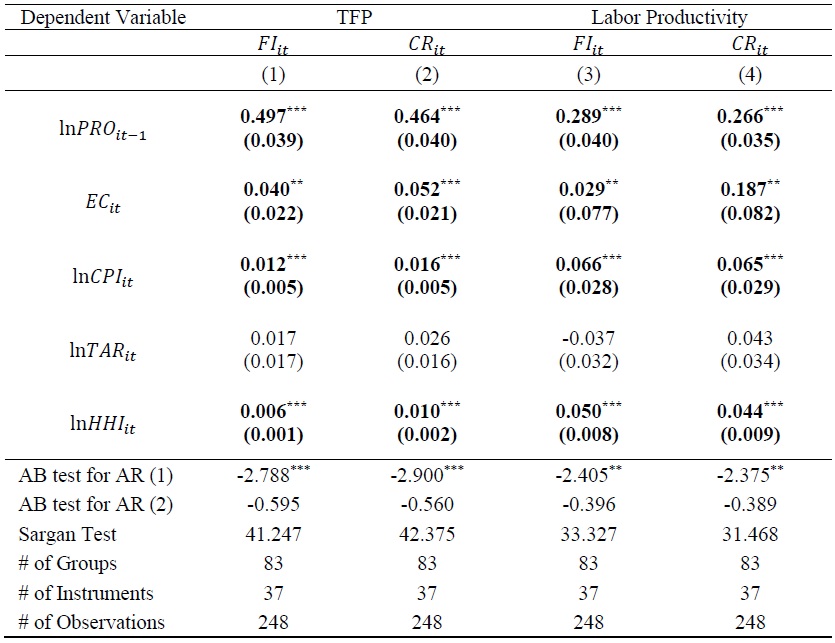
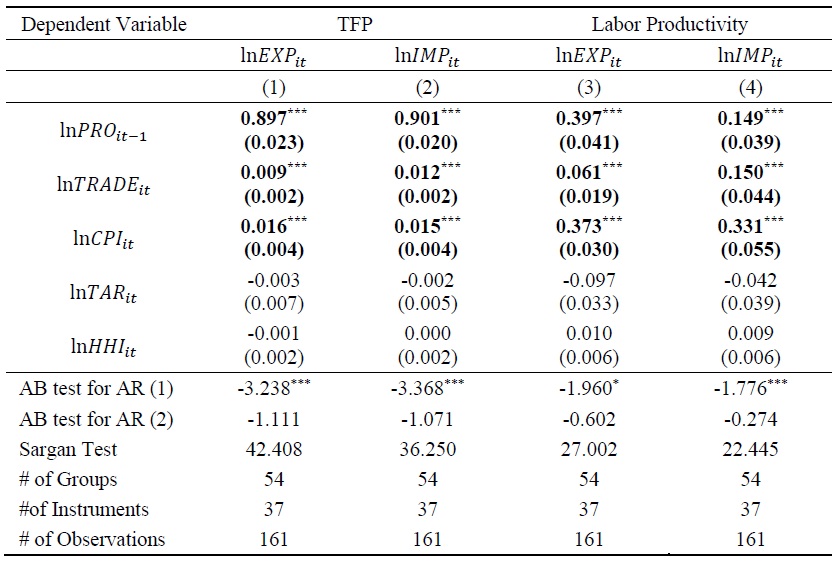
Table 4 reports the regression results for the effect of international trade on productivity in (2). Columns (1) and (2) are the regression results for TFP, while columns (3) and (4) are those for labor productivity. Columns (1) and (3) report the regression results for ln
The coefficient estimates of ln
All columns in Table 4 show that the coefficient estimates of ln
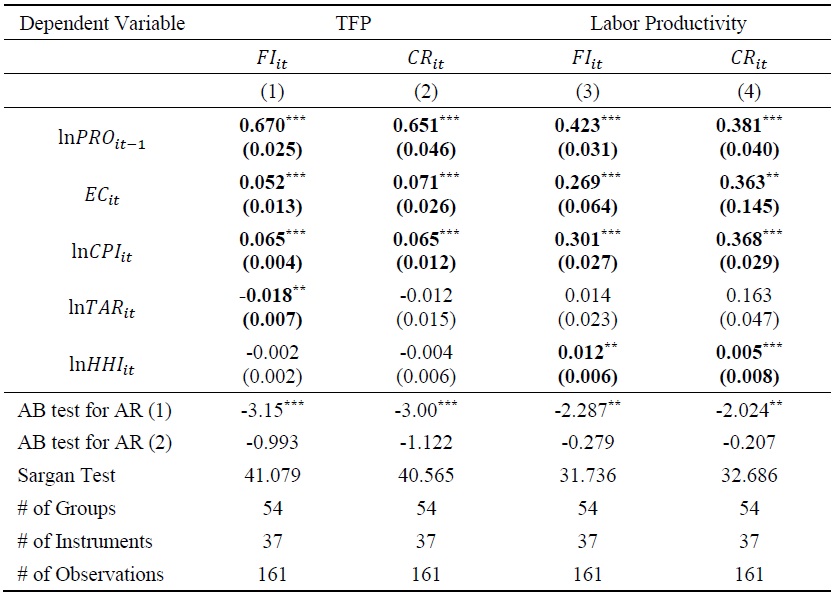
Table 5 reports the regression results for (3), which represents the effect of strategic goods control on productivity. Columns (1) and (2) are the regression results for TFP, while columns (3) and (4) are those for labor productivity. Columns (1) and (3) are the regression results for
The estimate coefficients of ln
2. Advanced Technology Products
Table A2 shows that strategic goods are centralized in specific industries with advanced technology products (ATP), such as general, electrical, and precision machineries and chemical products, rather than the entire industry. This fact may distort the empirical results of
Table 6 reports the regression for (1) for the ATP group. The estimate coefficients of ln
The estimate coefficients of
Table 7 reports the regression results of the effects of international trade on productivity for the ATP group. The coefficient estimates of total productivity and labor productivity in previous years are positive and statistically significant, showing autocorrelation. As in Table 4, the estimate coefficients of ln
Finally, Table 8 reports the regression results of the effects of strategic goods control on productivity for the ATP group. The coefficient estimates of ln
The coefficient estimates of
8)ATP is a classification method developed by the U.S. National Statistical Office in the late 1980s to aggregate high-technology trade. (
V. Conclusion
National security has become important in international trade and, in response, countries have set up systems for strategic goods control. Previous studies have focused on the effects of strategic goods control on international trade, but no research has ever empirically addressed how it in turn affects productivity. To fill this seeming lacuna in the research, this paper empirically examined how strategic goods control affects productivity, focusing on Korean industries from 2015 to 2019. We hypothesized that strategic goods control will positively affect productivity because it promotes international trade by making up for market failures, building up national credibility, and stabilizing the market environment; in turn, international trade contributes to productivity growth. The regression results are congruent with our hypothesis. The effects of strategic goods control on productivity were positive and statistically significant in general. These positive effects were more prominent in the group of industries that include strategic goods and ATP and, thus, are more likely to be technologically intensive. Considering various proxies for the level of strategic goods control, the positive effects of the coverage ratio were greater than those of the frequency index, emphasizing international trade as a medium for the effects of strategic goods control on productivity. Considering various proxies for productivity, the positive effects on labor productivity were greater than those on total factor productivity.
This paper provides several implications for government policy related to strategic goods control. Contrary to the general perception of the negative economic effects, this paper ensures that strategic goods control can contribute to economic growth by reducing diplomatic friction and stabilizing the global market. Korea, a resource-scarce open economy, should consider the more effective utilization of strategic goods control, minimizing its administrative costs with related measures such as the compliance program of strategic trade management and international standardization (Kim, 2017). In addition, considering that the effects of strategic goods control on productivity vary depending on industry characteristics, the government should pursue a tailor-made policy for national security that takes full account of industrial heterogeneity and support exporters’ own establishment of compliance program (Lee et al., 2007).
Tables & Figures
Figure 1.
Annual Trend of Strategic Goods in Korea during the 2015-2020 Period
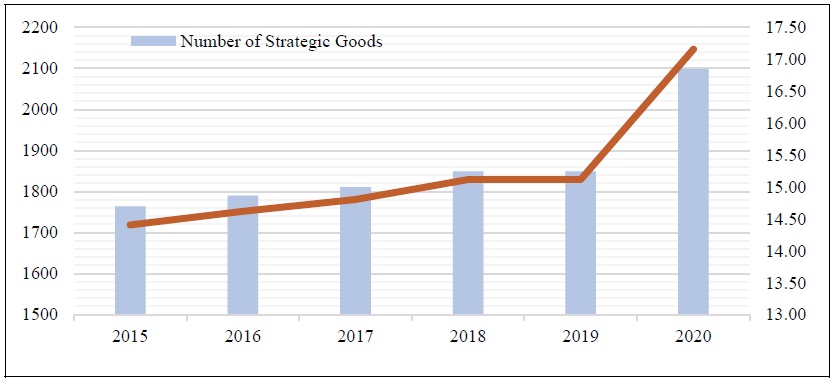
Source: Author’s calculation using the data of KOSTI
Table 1.
Descriptive Statistics
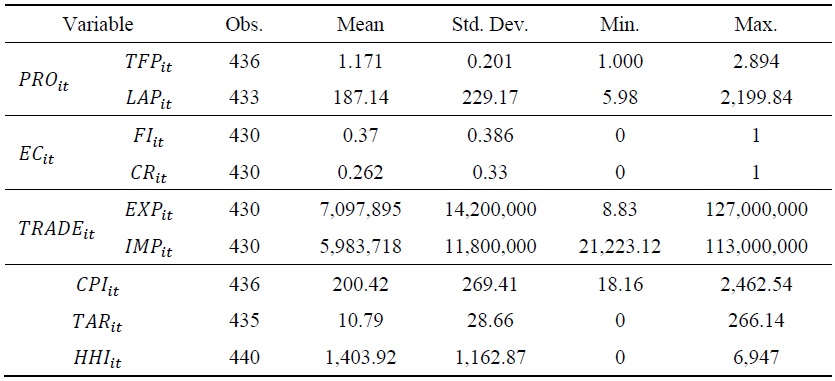
Table 2.
Coefficient of Correlation between Independent Variables
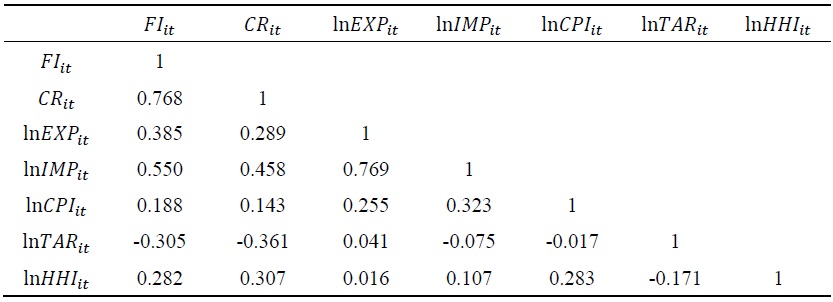
Table 3.
Regression Results for the Effect of Strategic Goods Controls on International Trade for Mining and Manufacturing Sectors
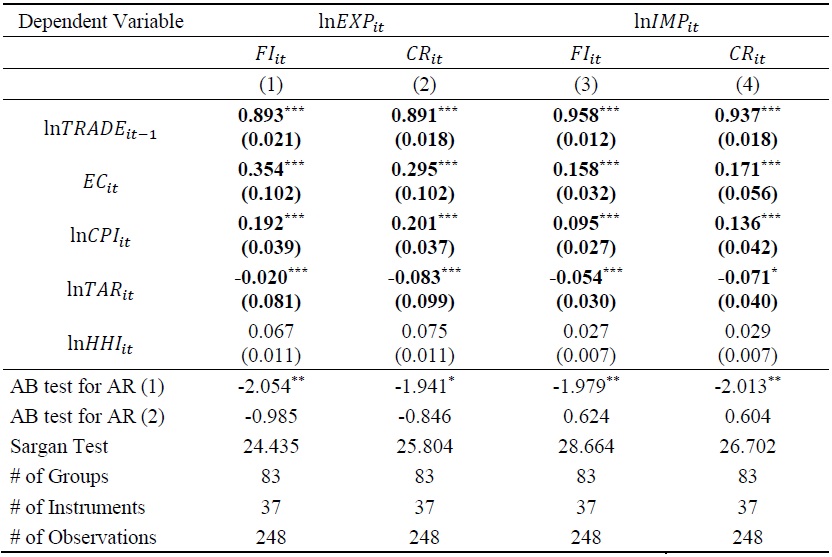
Notes: Figures in parentheses are standard errors. All regressions control for year fixed effects. *, **, and *** represent significance at the 1%, 5%, and 10% levels, respectively.
Table 4.
Regression Results for the Effect of International Trade on Productivity for Mining and Manufacturing Sectors

Notes: Figures in parentheses are standard errors. All regressions control for year fixed effects. *, **, and *** represent significance at the 1%, 5%, and 10% levels, respectively.
Table 5.
Regression Results for the Effect of Strategic Goods Control on Productivity for Mining and Manufacturing Sectors
Notes: Figures in parentheses are standard errors. All regressions control for year fixed effects. *, **, and *** represent significance at the 1%, 5%, and 10% levels, respectively.
Table 6.
Regression Results of the Effect of Strategic Goods Control on International Trade for the ATP Group
Notes: Figures in parentheses are standard errors. All regressions control for year fixed effects. *, **, and *** represent significance at the 1%, 5%, and 10% levels, respectively.
Table 7.
Regression Results of the Effect of International Trade on Productivity for the ATP Group
Notes: Figures in parentheses are standard errors. All regressions control for year fixed effects. *, **, and *** represent significance at the 1%, 5%, and 10% levels, respectively.
Table 8.
The Regression Results of the Effect of the Strategic Goods Control on Productivity for the ATP Group
Notes: Figures in parentheses are standard errors. All regressions control for year fixed effects. *, **, and *** represent significance at the 1%, 5%, and 10% levels, respectively.
Table A1.
Regression Results for Estimating TFP
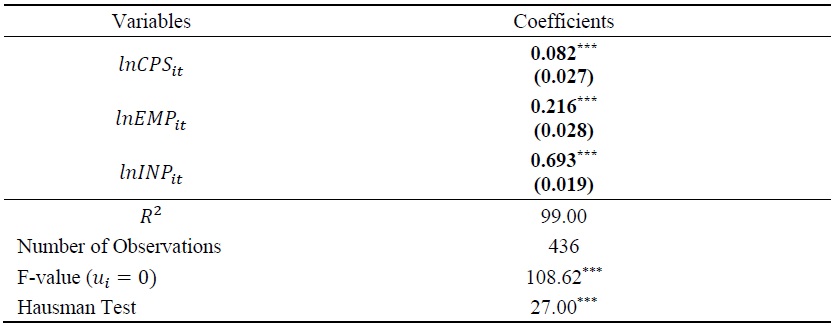
Notes: Figures in parentheses are standard errors adjusted for clusters in industries. All regressions control for year fixed effects. *, **, and *** represent significance at the 1%, 5%, and 10% levels, respectively.
Table A2.
Number of Strategic Products by Industries
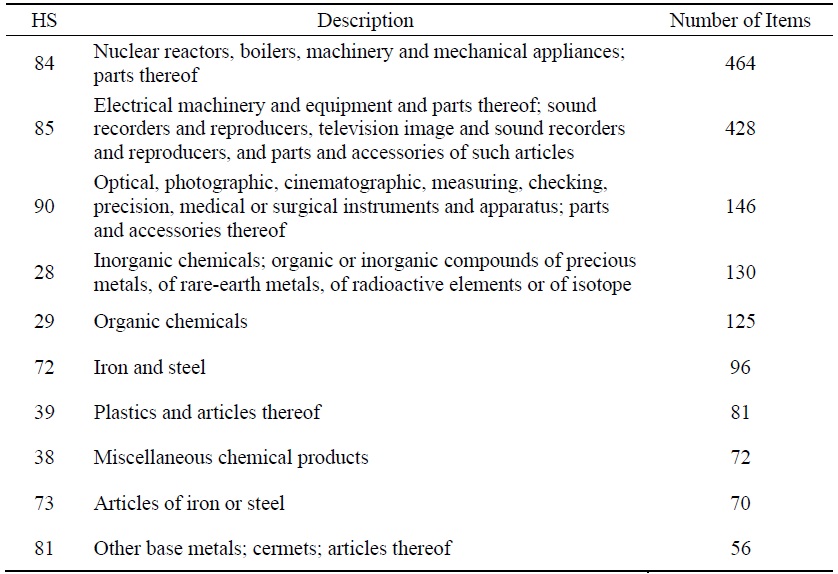
Source: Author’s calculation using the data of KOSTI.
References
-
Abreha, K. 2019. “Importing and Firm Productivity in Ethiopian Manufacturing.”
World Bank Economic Review , vol. 33, no. 3, pp. 772-792.
- Ahn, S. 2005. “Does Exporting Raise Productivity? Evidence from Korean Microdata.” Research Paper Series, no. 67, Asian Development Bank Institute.
-
Ahn, S. and K. Kim. 2005. “Market Structure and Productivity,” BOK Working Paper, no. 233. Bank of Korea.
https://www.bok.or.kr/portal/bbs/P0002454/view.do?nttId=71526&menuNo=200431&pageIndex=53 (in Korean) -
Amiti, M. and J. Konings. 2007. “Trade Liberalization, Intermediate Inputs, and Productivity: Evidence from Indonesia.”
American Economic Review , vol. 97, no. 5, pp.1611-1638.
-
Arellano, M. and S. Bond. 1991. “Some Tests of Specification for Panel Data: Monte Carlo Evidence and an Application to Employment Equations.”
Review of Economic Studies , vol. 58, no. 2, pp. 277-297
-
Badinger, H. 2007. “Market Size, Trade, Competition and Productivity: Evidence from OECD Manufacturing Industries.”
Applied Economics , vol. 39, no. 17, pp. 2143-2157.
- Bae, C., Kim, J., Keum, H. and Y. Jang, 2012. “The Impact of Free Trade Agreements on Economic Performance in Korea.” KIEP Policy Reference, no. 12-03. Korea Institute for International Economic Policy. (in Korean)
- Camino-Mogro, S., Pinzon, K. and P. Carrillo-Maldonado. 2020. “Do imports of intermediate inputs generate higher productivity? Evidence from Ecuadorian Manufacturing firms.” IDB Working Paper Series, no. 1129. Inter-American Development Bank.
-
Castellani, D. 2002. “Export Behavior and Productivity Growth: Evidence from Italian Manufacturing Firms.”
Weltwirtschaftliches Archiv , vol. 138, no. 4, pp. 605-628.
-
Chao, P. and G. Ben-Ari. 2008. “Health of the U.S. Space Industrial Base and the Impact of Export Controls.” Center for Strategic & International Studies.
https://www.csis.org/analysis/health-us-space-industrial-base-and-impact-export-controls (accessed May 10, 2022) -
Chellaney, B. 1994. “An Indian Critique of U.S. Export Controls.”
Orbis , vol. 38, no. 3, pp. 439-456.https://www.isanet.org/Conferences/Archive
-
Cupitt, R., Grillot, S. and Y. Murayama. 2001. “The Determinants of Nonproliferation Export Controls: A Membership-Fee Explanation.”
Nonproliferation Review , vol. 8, no. 2, pp. 69-80.
-
De Hoyos, R. and L. Iacovone. 2013. “Economic Performance under NAFTA: A Firm-level Analysis of the Trade-Productivity Linkages.”
World Development , vol. 44, pp.180-193.
-
De Loecker, J. 2013. “Detecting Learning by Exporting.”
American Economic Journal: Microeconomics , vol. 5, no. 3, pp. 1-21.
- Disney, R., Haskel, J. and Y. Heden. 2000. “Restructuring and Productivity Growth in UK Manufacturing.” CEPR Discussion Paper, no.2463. Centre for Economic Policy Research.
-
Eaton, J. and S. Kortum. 1996. “Trade in Ideas: Patenting and Productivity in the OECD.”
Journal of International Economics , vol. 40, issues. 3-4, pp. 251-278.
- Elwell, C. K. 2000. “Export Controls: Analysis of Economic Costs.” CRS Report for Congress, RL30430. Congressional Research Service.
- Fernandes, A. and A. Isgut. 2005. “Learning-by-Doing, Learning-by-Exporting, and Productivity: Evidence from Colombia.” Policy Research Working Papers, no. 3544. World Bank.
- Fugazza, M. 2013. “The Economics Behind Non-Tariff Measures: Theoretical Insights and Empirical Evidence.” Policy Issues in International Trade and Commodities Study Series, no. 57. United Nations Conference on Trade and Development.
-
Fuhrmann, M. 2008. “Exporting Mass Destruction? The Determinants of Dual-Use Trade.”
Journal of Peace Research , vol. 45, no. 5, pp. 633-652.
-
Goldberg, P., Khandelwal, A., Pavcnik, N. and P. Topalova. 2010. “Imported Intermediate Inputs and Domestic Product Growth: Evidence from India.”
Quarterly Journal of Economics , vol. 125, no. 4, pp.1727-1767.
- Hahn, C. H. 2004. “Exporting and Performance of Plants: Evidence from Korean Manufacturing.” NBER Working Papers, no. 10208. National Bureau of Economic Research.
-
Halpern, L., Koren, M. and A. Szeidl. 2015. “Imported Inputs and Productivity.”
American Economic Review , vol. 105, no. 12, pp. 3660-3703.
-
Hasan, R. 2002. “The impact of imported and domestic technologies on the productivity of firms: Panel data evidence from Indian manufacturing firms.”
Journal of Development Economics , vol. 69, no. 1, pp. 23-49.
- Heshmati, A. and M. Rashidghalam. 2016. “Labor Productivity in Kenyan Manufacturing and Service Industries.” IZA Discussion Papers, no. 9923. Institute of Labor Economics.
- Hwang, U., Lee, S., Kim, H. and Y. Kang. 2017. “The Employment Effect of Exports.” KIEP Policy Analysis, no. 17-18. Korea Institute for International Economic Policy. (in Korean)
-
Jang, Y. 2021. “Does Inward Foreign Direct Investment Affect Productivity across Industries in Korea?”
East Asian Economic Review , vol. 25, no. 2, pp.151-174.
-
Jang, Y. and B. Song. 2021. “The Economic Effects of Changing in Strategic Goods Control.” Research Paper, no. 21-N2801. Korean Security Agency of Trade and Industry.
https://www.kosti.or.kr/web/contents/researchReport.do?schFld=0&schM=view&page=1&viewCount=8&id=3833&schBdcode=_researchReport04&schGroupCode=#undefined (in Korean) -
Jang, Y. and M. Cho. 2015. “Trade Liberalization of the Intermediate Goods and Domestic Product Growth: Evidence from Korea.”
Journal of Korea Trade , vol. 20, No. 3, pp. 1-31. -
Jang, Y., Cho, M. and H. Kim. 2015. “Trade Liberalization and Firm Productivity: Evidence from Korea.”
Journal of Korea Trade , vol. 19, no. 4, pp. 21-41. - Jones, S. and J. Karreth. 2010. “Assessing the Economic Impact of Adopting Strategic Trade Controls.” U.S. Department of State Bureau of International Security and Nonproliferation Office of Export Cooperation.
-
Kasahara, H. and J. Rodrigue. 2008. “Does the use of imported intermediates increase productivity? Plant-level evidence.”
Journal of Development Economics , vol. 87, no. 1, pp. 106-118.
-
Kim, S.-J. and Y.-H. Lee. 2012. “Impact of Enterprise R&D Investment on International Trade in Korea under the new Normal Era.”
Journal of the Korea Contents Association , vol. 12, no. 9, pp. 357-368. (in Korean)
- Kim, S.-Y. 2012. “The Economic Effects of Export Control on Strategic Trade.” Master’s dissertation. Seoul National University. (in Korean)
-
Kim, H.-J. 2017, “An Empirical Study on the Impact of Compliance Program on Trade.”
International Commerce and Law Review , vol. 74, pp. 105-124. (in Korean) -
Kim, W.-K., Shin, H. S., Kim, J. H., Hwang, Y. and W. Rhee. 2000. “Analysis on the Productivity of the Korea Industry.” KIET Research Reports, no. 439. Korea Institute for Industrial Economics and Trade.
https://www.kiet.re.kr/en/pub/reportView?no=437&menu_cd=002003001&skey=A&sval=analysis%20on%20the%20productivity&pg=1&pp=10 (in Korean) - Klenow, P., Li, H. and T. Naff. 2019. “Is Rising Concentration Hampering Productivity Growth?” FRBSF Economic Letter, no. 2019-28, Federal Reserve Bank of San Francisco.
-
Kogut, B. and S. J. Chang. 1991. “Technological Capabilities and Japanese Foreign Direct Investment in the United States.”
Review of Economics and Statistics , vol. 73, no. 3, pp. 401-413.
-
Kowalczyk, C. and R. Riezman. 2009. “Free Trade: What are the Terms-of-Trade Effects?”
Economic Theory , vol. 41, no. 1, pp. 147-161.
-
Lee, S. and Y.-S. Choi. 2009. “The Effects of Plants’ Export Activity on Total Factor Productivity in Korea.”
Journal of Korean Economic Analysis , vol. 15, no. 1, pp. 77-125. (in Korean) -
Lee, W. and B. Kim. 2003. “The Effects of Economic Openness on Productivity.” Monthly Bulletin, no. 2003-5. Bank of Korea.
http://www.bok.or.kr/eng/bbs/E0000828/view.do?nttId=33420&menuNo=400214&searchWrd=economic+Openness&searchCnd=1&sdate=&edate=&pageIndex=1 -
Lee, H., Kang, H., Kim, G. and T. Yeo. 2007. “A Study on Korea’s Strategic Items Export Control System on the Perspective of Korean Export Firms.”
Korean Trade Review , vol. 32, no. 1, pp. 89-117. -
Lööf, H. and M. Andersson. 2010. “Imports, Productivity and Origin Markets: The Role of Knowledge-intensive Economies.”
World Economy , vol. 33, no. 3, pp. 458-481.
-
Máñez Castillejo, J., Mínguez Bosque, C., Rochina Barrachina, M. and J. Sanchis Llopis. 2020. “Trading activities, productivity and markups: Evidence for Spanish manufacturing.”
World Economy , vol. 43, no. 3, pp. 644-680.
-
Moulton, B. 1990. “An Illustration of a Pitfall in Estimating the Effects of Aggregate Variables on Micro Units.”
Review of Economics and Statistics , vol. 72, no. 2, pp. 334-338.
-
Salomon, R. and J. Shaver. 2005. “Learning by Exporting: New Insights from Examining Firm Innovation.”
Journal of Economics & Management Strategy , vol. 14, no. 2, pp. 431-460. -
Schneider, P. 2005. “International Trade, Economic Growth and Intellectual Property Rights: A Panel Data Study of Developed and Developing Countries.”
Journal of Development Economics , vol. 78, no. 2, pp. 529-547.
-
Seo, B., Kim, H. and B. Ha. 2017. “Dynamic Panel Analysis on the Learning Effect of Trade: Case for Manufacturing Firms in Korea.”
Journal of the Korean Official Statistics , vol. 22, no. 3, pp. 100-120. (in Korean) -
Westphal, L. 2002. “Technology Strategies for Economic Development in A Fast Changing Global Economy.”
Economics of Innovation and New Technology , vol. 11, no. 4-5, pp. 275-320.
-
Yu, M. and J. Li. 2014. “Imported Intermediate Inputs, Firm Productivity and Product Complexity.”
Japanese Economic Review , vol. 65, no. 2, pp. 178-192.
-
Zitzewitz, E. W. 2003. “Competition and Long-Run Productivity Growth in the UK and US Tobacco Industries, 1879-1939.”
Journal of Industrial Economics , vol. 51, no. 1, pp. 1-33.