

- EAER>
- Journal Archive>
- Contents>
- articleView
Contents
Citation
| No | Title |
|---|---|
| 1 | Utilizing nighttime light datasets to uncover the spatial patterns of county-level relative poverty-returning risk in China and its alleviating factors / 2024 / Journal of Cleaner Production / vol.448, pp.141682 / |
Article View
East Asian Economic Review Vol. 27, No. 3, 2023. pp. 243-269.
DOI https://dx.doi.org/10.11644/KIEP.EAER.2023.27.3.424
Number of citation : 1View
40
Download
35
Impact of Education on Multidimensional Poverty Reduction at the Post-Poverty Alleviation Era in Xinjiang
|
|
The Second Affiliated Hospital of Hainan Medical University |
|---|---|
|
|
China Institute for Reform and Development |
|
|
Xinjiang University |

Abstract
The multidimensional poverty index is an indicator system established for defining and evaluating poverty, to understand poverty in dimensions beyond just monetary scarcity. Based on income, education, health, living standards, and social dimensions, this article measures and analyzes the level of multidimensional poverty in Xinjiang using the Alkire-Foster method, with cross-sectional data obtained from a 2022 survey. Probit model is constructed for regression analysis, further considering the impact of education on enhancing feasible capabilities and alleviating multidimensional poverty at the post-poverty alleviation era. The data shows that many people still face significant challenges from the perspective of multidimensional poverty; the decomposition results of each dimension show that education contributes more to the multidimensional poverty; the regression analysis results show that the higher the education level, the lower the multidimensional poverty; heterogeneity analysis revealed that the inhibitory effect of education on multidimensional poverty is greater for females than males, and the poverty reduction effect of education mainly concentrates on middle-aged and older individuals. This article is meaningful for exploring strategies to alleviate multidimensional poverty in ethnic minority regions in frontier areas in the new era, accelerating regional economic development, and achieving shared prosperity.
JEL Classification: I24, I32, O15
Keywords
Multidimensional Poverty, Education, Alkire-Foster Method, Poverty Alleviation
I. Introduction
The issue of poverty has always been a widespread social phenomenon in the development process of human society. Reducing poverty is a basic requirement for a country’s progress, and eliminating poverty is a key goal for human society to achieve long-term development. In recent years, China has achieved great poverty reduction in its development history. It proclaimed to have comprehensively eradicated absolute poverty in 2020, based on the current China’s standards, which set the poverty line at 2,300 Chinese yuan per person per year (at 2010 constant prices) equivalent to approximately $2.2 per day when calculated using purchasing power parity (Chong et al., 2022). This marks the beginning of a new stage in poverty alleviation work, namely the post-poverty alleviation era. However, the development disparities among different regions in China suggest that relatively disadvantaged issues will still exist. For example, in 2020, the ratio of per capita disposable income between the eastern and western regions of China was 1.62, and the ratio of per capita disposable income between urban and rural residents was 2.56 (Zheng et al., 2021). Xinjiang Uygur Autonomous Region (hereinafter referred to as Xinjiang) is located in the inland region of northwest China. In the past, it not only had the characteristics of deep poverty and high poverty incidence rate, but also had its unique poverty features, such as the generally lower education level of rural residents and the lower proficiency in Mandarin of some ethnic minorities. The comprehensive popularization and development of education is an important pathway to improve income levels and alleviating absolute poverty (Lavell et al., 2023). In the postpoverty alleviation era, the role of education in alleviating multidimensional poverty will continue to be demonstrated.
The Multidimensional Poverty Index (MPI) is utilized in this study as an indicator system to define and evaluate poverty precisely. This article expands on the three dimensions (income, education, and infrastructure) set by the global MPI. Building upon the dimensions of income, education, health, living standards, and social factors, it further selects ten specific indicators to construct a multidimensional poverty index system. Using the Alkire-Foster (A-F) method (Alkire and Foster, 2011), the article measures the extent of multidimensional poverty in the Xinjiang region and conducts a research analysis on its multidimensional poverty situation. Based on the results of the multidimensional poverty measurement, Probit model is constructed for regression analysis. This study validates that education is a significant determinant of multidimensional poverty and further confirms its role in enhancing capabilities and alleviating multidimensional poverty at the individual level. The findings have implications for policymakers in Xinjiang and other regions facing similar challenges, emphasizing the need to prioritize education as a key strategy for poverty reduction.
II. Literature Review
1. Multidimensional Poverty Theory
In the late 20th century, Sen (1976) creatively proposed the concept of capability, which is described as the ability to do what one wants to do and to live in an environment that corresponds to one’s ideals. The capability theory is the key factor that prompts a fundamental reflection on poverty concepts, particularly in the broad field of economics (Jenkins and Micklewright, 2007). The capability concept eventually saw human progress as progress in human freedom and capability to live the kind of lives that people have reason to value (Drèze and Sen, 2013).
Sen (2001) extended a multidimensional poverty theory based on the capability theory, which indicated that individuals’ welfare rights should receive more attention, rather than just focusing on their survival capabilities. Since then, a measure of poverty that considers individual welfare, capabilities, and social inclusiveness was developed (Tiwari, 2007), and multidimensional poverty analysis has become an increasing important component of poverty research worldwide.
Afterward, researchers from the Oxford Poverty and Human Development Initiative and the United Nations Development Programme (UNDP) established a systematic indicator for measuring multidimensional poverty that included education, health, and standard of living, based on Amartya Sen’s capability theory, which is the global MPI (Alkire and Foster, 2011). The Global MPI uses three dimensions of health, education, and living standards, and assigns equal weights to them, which has been adopted by many studies.
2. Education and Poverty
According to Bhorat (1999), relying solely on the income index cannot provide strong evidence to analyze the overall poverty situation. Only through multidimensional research and analysis, such as education and health, can the poverty situation of a regional population be fully reflected. Education is not only a dimension of multidimensional poverty, but also an important resource for integrating humans into the labor market and society’s main sectors (Sen and Anand, 1997).
Ram (2021) suggested that when investigating the poverty situation in rural China, the higher the education level of a family’s labor force, the more likely the poor family is to escape poverty. Faggio et al. (2010) studied the correlation between povertystricken areas and education believe that improvement in educational attainment is one of the fundamental channels for reducing poverty in impoverished regions. Therefore, education and poverty alleviation should also have intricate connections.
3. Poverty in Xinjiang
The four southern prefectures of Xinjiang have characteristics such as being remote and inland, multiculturalism, and underdevelopment. As a result, scholars studying multidimensional poverty in Xinjiang’s local field tend to focus on the four southern prefectures when measuring multidimensional poverty and studying its spatiotemporal evolution and influencing factors (Chen et al., 2022; Yao and Wang, 2021), investigating the degree and characteristics of multidimensional poverty among the main ethnic groups in contiguous extremely poor areas in Xinjiang. For example, Chen et al. (2022) studied the spatial distribution and regional differences of poverty in Southern Xinjiang based on a multidimensional poverty identification index system. In addition, scholars have respectively argued that information asymmetry (Yao and Wang, 2021), health conditions (Zhang and Zhao, 2021), natural disasters (Ullah et al., 2020), or water scarcity (Wang et al., 2023) are significant issues contributing to poverty in Xinjiang. Yao and Wang (2021) suggest that anti-poverty work needs to fully consider the multidimensionality and diversity of poverty among various ethnic groups in Xinjiang to enhance the endogenous development capabilities of impoverished populations. Some studies have separately explored the relationship between inclusive finance (Li et al., 2022), tourism development (Yang et al., 2021), improved public health (An and Zhang, 2022; Uskoković, 2023) increased agricultural efficiency (Mi et al., 2020), or ecological environment construction (Jiang et al., 2021), and household income, and further examine the potential effects of these factors in reducing poverty in Xinjiang.
In summary, previous studies mainly focused on limited dimensions or limited areas in Xinjiang, while this study is the result of multidimensional poverty research in Xinjiang. In addition, based on the three dimensions of the global MPI and the actual poverty situation in Xinjiang, this study selected corresponding multidimensional poverty indicators to calculate the MPI. Through the decomposition and empirical analysis of MPI, the mechanism of multidimensional poverty formation is explored, emphasizing the importance of education in improving individual quality of life and reducing poverty. This provides a reference for achieving targeted poverty alleviation and consolidating poverty alleviation work.
III. Multidimensional Poverty Analysis
1. Multidimensional Poverty Measurement Methods
(1) Alkire-Foster method
The A-F method is a flexible approach that can adapt to various situations by selecting different dimensions (such as education), poverty indicators within each dimension (such as a person’s educational attainment), and poverty cutoffs (such as considering education levels below compulsory education as deprivation). This method has been widely applied to empirical research on multidimensional poverty at the micro level, which is a systematic multidimensional poverty measurement method. Therefore, this study uses the A-F method to measure the multidimensional poverty status of residents in Xinjiang, and analyzes the multidimensional poverty situation in the region using the MPI. This method consists of three stages: poverty identification, poverty aggregation, and poverty decomposition.
A-F method applies two critical values to identify poverty. One critical value is used to measure each indicator for each sample to assess whether the indicator of the sample belongs to poverty. If the overall dimension surpasses the threshold value, then poverty is increased by a dimension. For example, for a single income dimension, if the average annual income is less than 2,300 yuan (unless otherwise specified, all amounts are in Chinese yuan), it is identified as one-dimensional poverty. The other critical value is used as the threshold for the number of dimensions that define multidimensional poverty. For example, when the threshold is set to 3, if the total of deprivation scores exceeds 3, it will be considered as a situation of multidimensional poverty. After determining the critical values, the established multidimensional poverty indicator system is used to measure and comprehensively identify poverty. Finally, the MPI is calculated through three-level aggregation to determine individuals’ multidimensional poverty status.
The uniqueness of the A-F method lies in its ability to differentiate, for example, a group of poor individuals who on average experience two episodes of deprivation from a group of poor individuals who on average experience five episodes of deprivation, by measuring intensity. The A-F method can be used to create national, regional, or international measures of poverty or well-being by incorporating dimensions and indicators that are suitable for specific circumstances. While the A-F method provides a single poverty headline measure, it can also be decomposed and analyzed in a powerful way to provide information for policy-making.
(2) Identification of multidimensional poverty
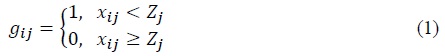
When identifying multidimensional poverty, first assume that
The first step is to determine whether sample
The second step is to determine whether an individual is in a state of multidimensional poverty. Assuming that individual 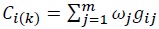 in all dimensions, where the weight vector
  otherwise,
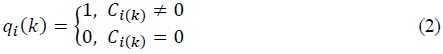
After introducing the critical value
(3) Aggregation of multidimensional poverty
The most common method of measuring poverty is by calculating the percentage of the population living in poverty, known as the headcount ratio (
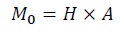
Multidimensional poverty incidence (
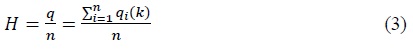
Multidimensional poverty incidence can reflect poverty coverage at the macro level, but cannot reflect the share of deprivation of the poor.
Average deprivation gap (
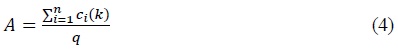
In Equation (4),
MPI (
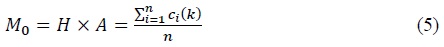
The size of
It should be noted that MPI aims to capture multiple dimensions of poverty simultaneously, providing a comprehensive understanding of poverty beyond incomebased measurements. Cutoff criteria (for
2. Data Source and Indicator Setting
(1) Source of data
The data used in this study was obtained through a questionnaire survey. Firstly, considering that answering poverty-related questions may involve personal dignity, using real-name questionnaires may lead to biased data collection, while using anonymous systems can protect the privacy of respondents and make it easier to obtain their true personal information. Secondly, as some poor areas or poor families may have difficulties in using networks or smart devices, conducting surveys only through the internet may result in selection bias. We also distributed a large number of (bilingual) questionnaires when promoting research in impoverished areas. Finally, due to the impact of the COVID-19 pandemic in recent years, on-site investigations have become more difficult, and survey costs are limited. Therefore, this study collected data through a combination of on-site surveys, online surveys, and commissioned surveys, each accounting for approximately one-third of the total data.
In addition, taking into account the overall situation of population in Xinjiang in terms of ethnicity, age, gender, marital status, and region, efforts were made to distribute the questionnaires using a stratified sampling method to enhance the representativeness of the samples and reduce biases as much as possible. The survey period was conducted in January 2022, with a total of 1200 questionnaires distributed, covering all 14 prefectures in Xinjiang. After screening the collected questionnaires, a total of 976 valid questionnaires were obtained. Among them, the gender ratio of the sample is approximately 1:1, and the proportion of ethnic minorities to Han Chinese is approximately 2:1. As Xinjiang has always been an autonomous region of ethnic minorities, the proportion of ethnic minorities to Han Chinese in the total population is also close to 2:1.
The basic statistical information of the sample is shown in Table 1:
According to the results of Table 1, it is known that the majority of the survey subjects in this study are Uyghurs, accounting for 42.11%, while the proportions of Han and other ethnic minorities are 29.3% and 25.59%, respectively. The high proportion of Uyghurs is related to the surveyed region, and the diversity of ethnicities among the survey subjects is beneficial to ensuring the reliability of the empirical estimation results. From the age distribution, the survey subjects of all age groups are included in this study, which can also ensure the universality of the empirical estimation results. In terms of gender, the proportion of female survey subjects is close to that of male, indicating that there is no obvious gender bias in the empirical sample of this study. In terms of marital status, most of the respondents are married. In addition, t-tests indicate that there are no significant differences between the sample and the population in terms of ethnic, age, gender, and marital status distributions, which strengthens the argument for the representativeness of the sample.
(2) Description of indicators
In the process of designing indicators, not only the poverty characteristics of the targeted population need to be considered, but also the core needs of poverty alleviation in China. Based on the global MPI and the actual situation in Xinjiang, this article selects five dimensions: income, education, health, living standards, and social factors.
(3) Weight of each dimension and determination of critical value
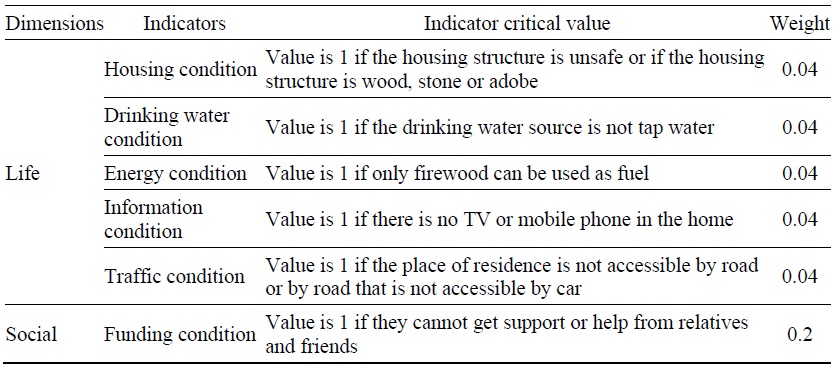
Equal weighting is a method that assigns equal weights to each dimension included in a multidimensional poverty system, and further assigns equal weights to each indicator within the same dimension based on the weights of each dimension. This article uses an equal weighting method to measure poverty, which is the same as the method used by most scholars when conducting related research. The main reasons are: 1) Multidimensional poverty indices are relatively stable. Authoritative research has conducted a correlation analysis of MPI under different weights and found that there is a high correlation between multidimensional poverty indicators, and even with different weights, the impact will not be significant. This research result shows that MPI is robust under different weights. 2) Equal weighting method is currently the most commonly used method in multidimensional poverty research. Therefore, it is reasonable to assume that the impact of each dimension on multidimensional poverty is equally important. Some dimensions contain sub-indicators, which are also given the same weight. Based on this, the MPI constructed in this article is shown in Table 2 below:
(4) Reliability and validity
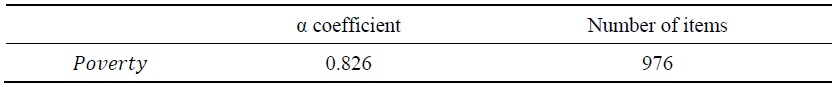
As the questionnaire data is used in this article, in order to improve the reliability of the survey questionnaire data, this article further analyzed the reliability and validity of the relevant questionnaires to determine the reliability of the empirical analysis results.
The reliability analysis is mainly used to test the stability and reliability of data. Usually, Cronbach’s Alpha coefficient can be used to determine it. The larger the value of this coefficient, the stronger the stability and consistency between the data. Scholars have established a clear threshold for the coefficient. Only when the α coefficient is greater than 0.7, the sample is stable and consistent. In this article, Stata is used for reliability analysis, and the corresponding results are shown in Table 3. It can be found that the α coefficient is greater than 0.7, indicating that the sample data estimated in this article is stable and consistent.
In addition, this article conducted a validity analysis. Generally speaking, the validity analysis of questionnaires can reflect the accuracy of data characteristics. The effectiveness of a measurement tool is better when it has a higher validity, otherwise it indicates that the validity of the measurement tool needs improvement. In this article, the common practice of existing literature and structural validity are selected to analyze the measuring tool used in this article, and the corresponding validity test results are shown in Table 4. It can be found that the KMO value is greater than 0.6, so the validity test results are also reasonable.
3. Multidimensional Poverty Result Analysis
(1) Measures of multidimensional poverty
The breadth, intensity, and degree of multidimensional poverty are expressed by
The measurement results in Table 5 show that as the value of k increases, the poverty deprivation share continues to increase, while the poverty incidence and MPI decrease. When
(2) Decomposition of MPI
In order to explore the main poverty factors of multidimensional poverty, analyze the poverty depth, this article decomposes each dimension indicator established in the article one by one. The formula for decomposing the MPI by indicator is as follows:
As in the previous section,
The results of multidimensional poverty contribution rates of each dimension are shown in Table 6.
Table 6 shows that when
IV. Empirical Analysis of Education on Poverty Reduction
1. Model Construction
To examine the impact of education on multidimensional poverty, this paper conducts an analysis by building an econometric model. Considering that the dependent variable is a dummy variable, a Probit model is constructed for estimation. In the robustness section, the econometric model is replaced to ensure the reliability of the estimation results. The corresponding econometric model is as follows:

Where
2. Variable Selection
(1) Explained variable
The dependent variable focused on in this paper is multidimensional poverty (
(2) Explanatory variable
The education level (
(3) Control variables
This article mainly studies the impact of education on multidimensional poverty in Xinjiang. Considering that there are many factors that affect multidimensional poverty, in order to avoid the interference of other factors on the regression estimation results, this article further controls for relevant individual characteristic variables in the regression model, including ethnicity, gender, family size, marital status and age. The specific variable definitions are shown in Table 7.
Table 8 shows the descriptive statistics of the variables. It can be found that the mean value of multidimensional poverty is 0.753, indicating that a large proportion of individuals in the sample are in a state of multidimensional poverty.
3. Analysis of empirical results
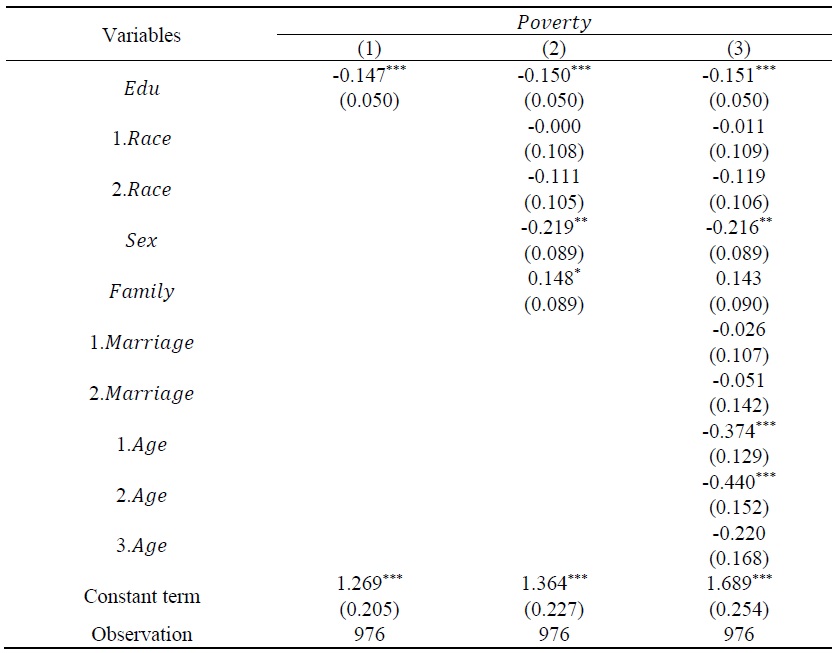
(1) Regression analysis
To analyze the influence of education on individuals’ multidimensional poverty, a Probit model is used for estimation, and the corresponding regression estimates are shown in Table 9. The first column shows the estimation results with only the core explanatory variable included, and the regression coefficient of education is -0.147, which is significant at the 1% level. This indicates that there is a negative correlation between education level and the probability of multidimensional poverty at the individual level, consistent with the theoretical analysis in the previous section. The second and third columns add corresponding control variables, and it can be found that the regression coefficient of education is still significantly negative after adding control variables, indicating that the addition of control variables does not directly affect the estimation direction of this article. The higher the level of education, the higher an individual’s potential income capacity (Glyn and Salverda, 2000). Therefore, selecting to encourage education is a way to help the most disadvantaged families and promote long-term economic growth.
Observing the control variables, it can be found that: Firstly, the relationship between ethnicity and poverty is not significant, indicating that poverty alleviation in Xinjiang is well-managed, and the concept of ethnic unity and integration in China has been well-reflected in poverty alleviation work. Secondly, the probability of male poverty is smaller than that of females. From domestic to global, females have more unpaid household and caregiving work, earn lower wages when working outside, may lack the right to participate in land allocation and inheritance in some rural areas, and have lower average levels of education and labor skills compared with males. These features are closely related to female poverty. Then, the impact of family size and marital status on poverty is not significant. This shows that individuals can achieve relatively autonomous development in work and life, and whether they are in poverty mainly depends on their personal efforts. Finally, there is a U-shaped relationship between age and poverty incidence. A universal income guarantee and welfare system should be established, with a focus on protecting adolescents and the elderly.
(2) Robustness analysis
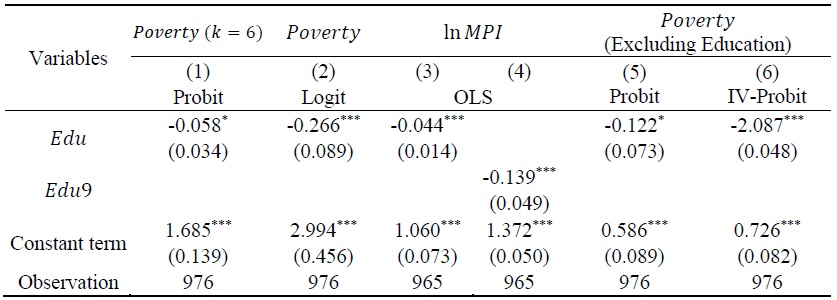
Although the Probit regression shows a negative correlation between the increasing education level and the probability of multidimensional poverty for individuals, and a series of control variables have been added to the model for analysis, the estimation results of this article may still be biased. In order to improve the reliability of the estimation results, empirical analysis is conducted through replacement of econometric models, changing the dependent variable measurement method, adding independent variables, and instrumental variable (IV) tests. The results are shown in Table 10. Firstly, to examine whether different deprivation cutoff values may lead to different results, a robustness test is conducted by setting
In addition, Probit is used again with
By examining Table 10, it can be seen that even after a series of robustness and endogeneity tests, the regression coefficient of education level remains significantly negative. This indicates that the empirical regression results are reliable, meaning that education has an inhibitory effect on multidimensional poverty.
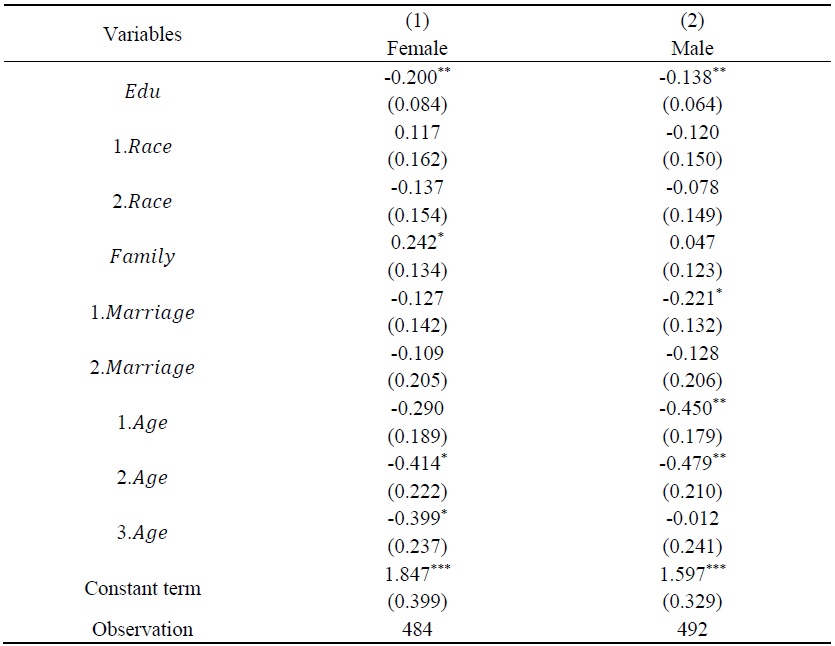
(3) Heterogeneity analysis
It is worth discussing whether there are differences in the impact effects for individuals with different characteristics. This article will conduct empirical analysis from two aspects: gender and age. Firstly, grouping regression by gender, the corresponding regression estimation results are shown in Table 11. It can be found that the regression coefficient of female education level in the sample is -0.2, which is significant at the 5% level, while the regression coefficient of education level in male samples is -0.138, also significant at the 5% level. This indicates that the inhibitory effect of education on multidimensional poverty is higher for women than for men. Women are more likely to be poor than men mainly because they lack education and resources to help them get out of poverty. As China attaches great importance to the development of education, women in ethnic areas have increasingly more opportunities to receive high school and higher education. Education increases women’s employment opportunities and income, which has been demonstrated significantly in China’s ethnic areas.
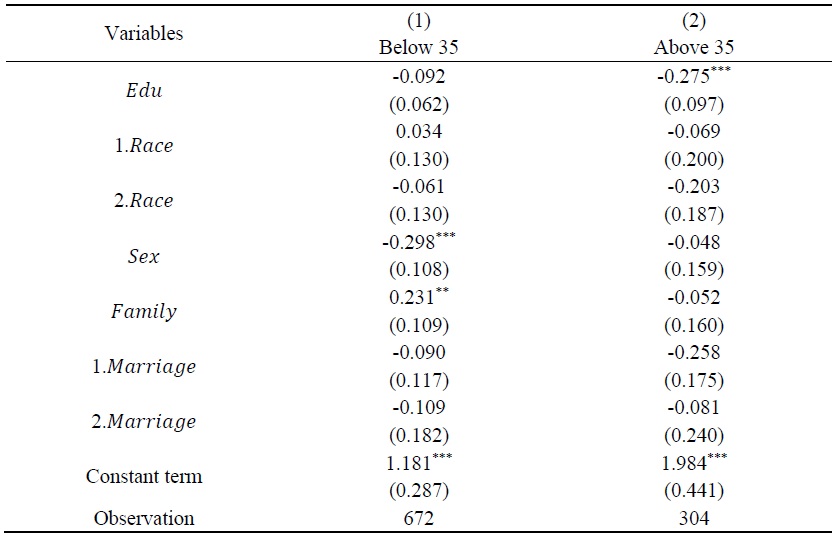
Furthermore, considering the differences in work ability at different age groups, this article further divided the sample into two groups based on age: under 35 and over 35. The corresponding regression estimation results are shown in Table 12. It can be found that the regression coefficient of education level is negative but not significant in the sample under 35, while it is significantly negative in the sample over 35, indicating that the poverty reduction effect of education mainly focuses on the sample over 35. One possible reason is that the widespread implementation of compulsory education and the expansion of higher education opportunities in China after the reform and opening-up period have reduced educational disparities among young people, allowing other socio-economic factors to play a more significant role in their poverty status. For those under 35, interventions should focus on early education for disadvantaged youth, while ensuring access to quality education resources and skills training to improve their employment prospects. For those over 35, emphasis should be placed on lifelong learning opportunities, career transitions, and retraining to prevent poverty due to obsolete skills.
V. Conclusions
Based on research on relevant theories and existing literature, this article uses the A-F method to measure and analyze the multidimensional poverty status of residents in Xinjiang, providing a more comprehensive and realistic reflection of the multidimensional poverty situation of residents in the region. On this basis, a Probit model is established to further analyze the degree of education’s impact on multidimensional poverty, thus deeply exploring the continued poverty alleviation role of education in the post-poverty era from a multidimensional poverty perspective. The specific research results of this article are as follows: 1) The phenomenon of multidimensional poverty is prominent. When the critical deprivation threshold
The research findings indicate that education is an important factor influencing the multidimensional poverty index, and also recognize the significance of education in poverty reduction. These findings are generally consistent with studies conducted in various countries. By emphasizing the significance of education in enhancing feasible capabilities and addressing multidimensional poverty, this research provides valuable insights for exploring strategies to alleviate poverty in ethnic minority regions, particularly in frontier areas like Xinjiang. The findings further underscore the potential of education in accelerating regional economic development and achieving shared prosperity in the new era. This article proposes the following suggestions: Firstly, strengthen skills training to enhance the intrinsic development motivation of the multidimensional poor population; Secondly, continue to do well in ensuring compulsory education, and improve the dropout prevention and dynamic monitoring mechanisms; Thirdly, continue to increase public investment in education to ensure high-quality development of the entire region’s educational undertakings; Fourthly, fully leverage the advantages of poverty alleviation teams as the main body to activate the endogenous motivation of multidimensional poor populations through educational assistance. Fifthly, based on the characteristics of different age groups, targeted policy recommendations should be proposed to more effectively utilize education resources, promote poverty reduction, and achieve the goals of eliminating poverty and ensuring social stability.
In conclusion, it is important to acknowledge a limitation in our study regarding the chosen tipping points for measuring deprivation in different dimensions. The selection of these thresholds may have an impact on the conclusions drawn about the relationship between education and poverty alleviation. Different thresholds could potentially yield different results, thus influencing the overall understanding of the role of education in addressing poverty. Furthermore, the research relied on available data sources and methodologies, which may have inherent limitations and potential inaccuracies. Despite efforts to ensure data validity and reliability, there may exist gaps or inconsistencies that could impact the robustness of the findings. Future research should aim to address these limitations and explore additional perspectives to further enhance our understanding of this complex issue.
Tables & Figures
Table 1.
Frequency Analysis of Basic Information of Samples
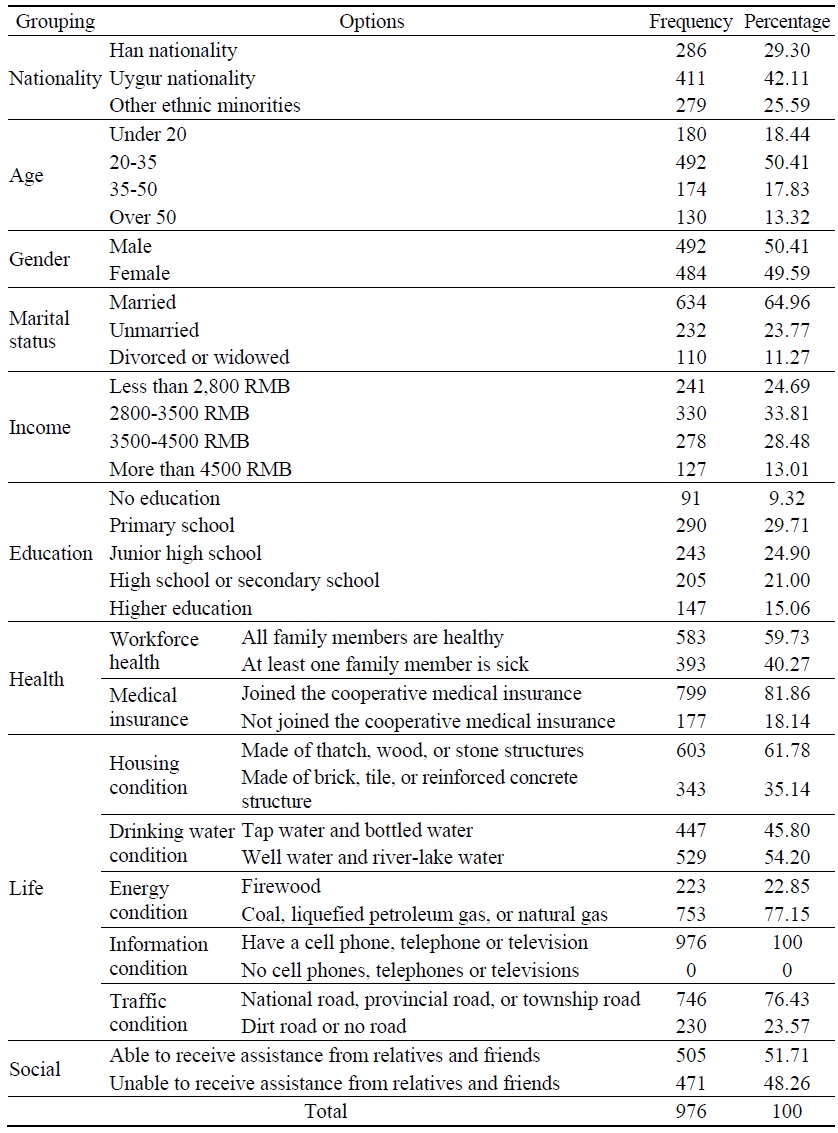
Table 2.
Multidimensional Poverty Indicator System
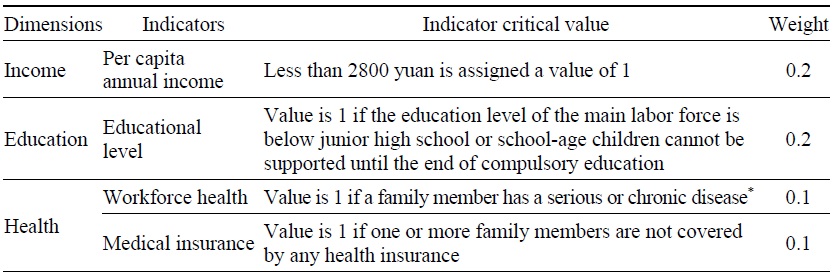
Table 2.
Continued
Notes: *The Chinese government has a set of criteria for the classification of serious diseases and chronic diseases. For example, serious diseases include 28 types such as malignant tumors, while chronic diseases encompass 35 types including hypertension and diabetes.
Table 3.
Reliability Test Results
Note:
Table 4.
Validity Test Results

Table 5.
Multidimensional Poverty Measurement Results
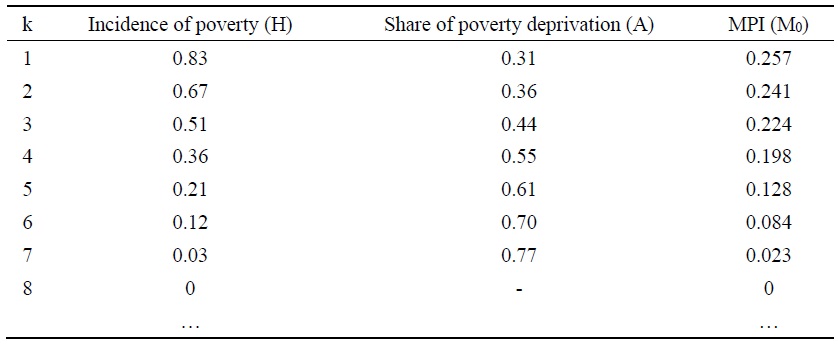
Table 6.
Contribution Rate of Each Dimension under Different k Values
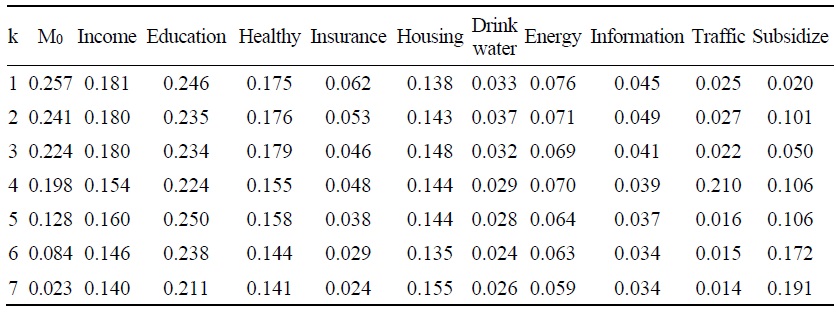
Table 7.
Variables Meaning
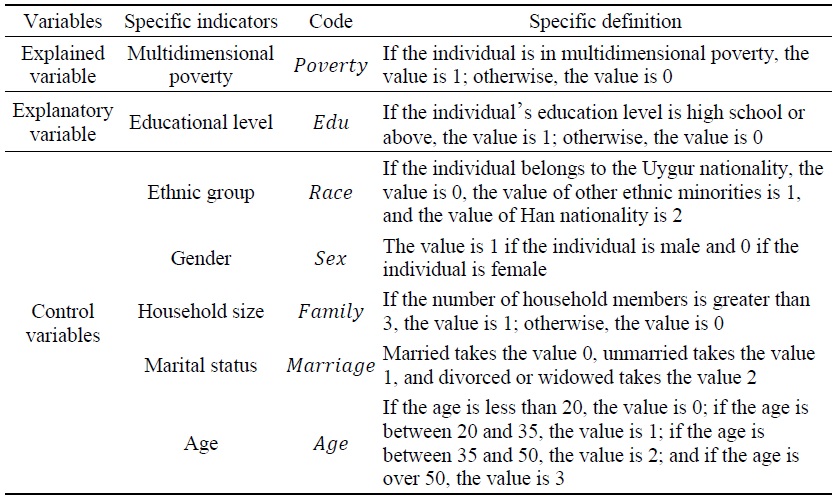
Table 8.
Descriptive Statistics
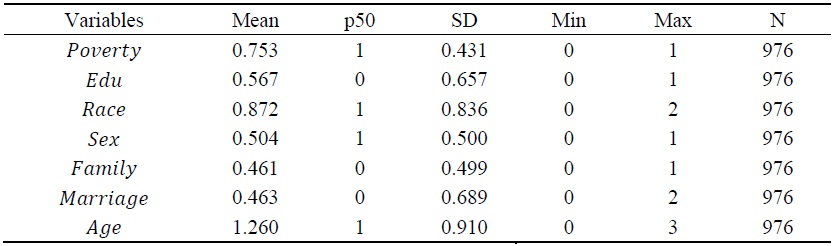
Table 9.
Benchmark Regression Results
Notes: *, ** and *** indicate significance at the levels of 10%, 5% and 1%, respectively. Standard errors are in parentheses.
Table 10.
Robustness Test Results
Notes: *, ** and *** indicate significance at the levels of 10%, 5% and 1%, respectively. Standard errors are in parentheses. Regression results for the control variables are omitted and available upon request.
Table 11.
Gender Heterogeneity
Notes: *, ** and *** indicate significance at the levels of 10%, 5% and 1%, respectively. Standard errors are in parentheses.
Table 12.
Age Heterogeneity
Notes: *, ** and *** indicate significance at the levels of 10%, 5% and 1%, respectively. Standard errors are in parentheses.
References
-
Alkire, S. and J. Foster. 2011. “Counting and multidimensional poverty measurement.”
Journal of Public Economics , vol. 95, no. 7-8, pp. 476-487.https://doi.org/10.1016/j.jpubeco.2010.11.006 
-
An, Q. and L. Zhang. 2022. “Public Health Service and Migration Destinations among the Labor of Xinjiang Uygur Autonomous Region of China.”
Sustainability , vol. 14, no. 8.https://doi.org/10.3390/su14084718
-
Bhorat, H. 1999. “Distinguishing between individual‐and household‐level poverty.”
Development Southern Africa , vol. 16, no. 1, pp. 157-162.https://doi.org/10.1080/03768359908440067
-
Chen, R., Zhang, F., Chan, N. W. and Y. Wang. 2022. “Multidimensional poverty measurement and spatial–temporal pattern analysis at county level in the arid area of Xinjiang, China.”
Environment, Development and Sustainability .https://doi.org/10.1007/s10668-022-02629-4
-
Chong, C., Cai, M. and X. Yue. 2022. “Focus shift needed: From development-oriented to social security-based poverty alleviation in rural China.”
Economic and Political Studies , vol. 10, no. 1, pp. 62-84.https://doi.org/10.1080/20954816.2022.2031514
-
Drèze, J. and A. Sen. 2013.
An Uncertain Glory . Princeton University Press. -
Faggio, G., Salvanes, K. G. and J. Van Reenen. 2010. “The evolution of inequality in productivity and wages: panel data evidence.”
Industrial and Corporate Change , vol. 19, no. 6, pp. 1919-1951.https://doi.org/10.1093/icc/dtq058
-
Glyn, A. and W. Salverda. 2000. “Chapter 2: Employment Inequalities.” In Gregory, M., Salverda, W. and S. Bazen. (eds.)
Labour Market Inequalities: Problems and Policies of low-wage employment in international perspective . Oxford University Press.http://dx.doi.org/10.2139/ssrn.207988 -
Jenkins, S. P. and J. Micklewright. 2007.
Inequality and poverty re-examined . Oxford University Press. -
Jiang, L., Wang, Y., He, L., Sun, Z., Liu, Y. and J. Bu. 2021. “Ecological benefit analysis of restoration of degraded environment by Artificial Tamarix-Cistanche.”
Environmental Technology & Innovation , vol. 23.https://doi.org/https://doi.org/10.1016/j.eti.2021.101792
-
Lavell, A., McFarlane, C., Moore, H. L., Woodcraft, S. and C. Yap. 2023. “Pathways to Urban Equality through the Sustainable Development Goals: Modes of Extreme Poverty, Resilience, and Prosperity.”
International Journal of Urban Sustainable Development , vol. 15, no. 1, pp. 215-229.https://doi.org/10.1080/19463138.2023.2226099
-
Li, Z., Tuerxun, M., Cao, J., Fan, M. and C. Yang. 2022. “Does inclusive finance improve income: A study in rural areas.”
AIMS Mathematics , vol. 7, no. 12, pp. 20909-20929.https://doi.org/10.3934/math.20221146
-
Mi, Q., Li, X. and J. Gao. 2020. “How to improve the welfare of smallholders through agricultural production outsourcing: Evidence from cotton farmers in Xinjiang, Northwest China.”
Journal of Cleaner Production , vol. 256.https://doi.org/10.1016/j.jclepro.2020.120636
-
Ram, R. 2021. “Attainment of multidimensional poverty target of sustainable development goals: a preliminary study.”
Applied Economics Letters , vol. 28, no. 8, pp. 696-700.https://doi.org/10.1080/13504851.2020.1771265
-
Sen, A. 1976. “Poverty: an ordinal approach to measurement.”
Econometrica , vol. 44, no. 2, pp. 219-231.
-
Sen, A. 2001.
Development as freedom . Oxford University Press. -
Sen, A. and S. Anand. 1997. “Concepts of Human Development and Poverty: A Multidimensional Perspective.” In
Human Development Papers, 1997: poverty and human development . United Nation Development Programme. -
Tiwari, M. 2007. “Chronic poverty and entitlement theory.”
Third World Quarterly , vol. 28, no. 1, pp. 171-191.https://doi.org/10.1080/01436590601081971
-
Ullah, I., Zhao, Y., Ali, S. and G. Rahman. 2020. “Rainfall and drought variability in spatial and temporal context in Lop Nor region, South Xinjiang, China, during 1981–2018.”
Arabian Journal of Geosciences , vol. 13.https://doi.org/10.1007/s12517-020-05431-6
-
Uskoković, V. 2023. “Conceptual Bases of a Quantitative Method for Assessing the Transferability of Medical Technologies Across the Rich-Poor Divide.”
Journal of the Knowledge Economy .https://doi.org/10.1007/s13132-023-01235-7
-
Wang, J., Li, Z. and Y. Chen. 2023. “The spatiotemporal evolution of socioeconomic drought in the Arid Area of Northwest China based on the Water Poverty Index.”
Journal of Cleaner Production , vol. 401.https://doi.org/https://doi.org/10.1016/j.jclepro.2023.136719
-
Yang, J., Wu, Y., Wang, J., Wan, C. and Q. Wu. 2021. “A Study on the Efficiency of Tourism Poverty Alleviation in Ethnic Regions Based on the Staged DEA Model.”
Frontiers in Psychology , vol. 12.https://doi.org/10.3389/fpsyg.2021.642966
-
Yao, S. and J. Wang. 2021. “Aspiration and poverty in an asymmetric information game: a case study of Southern Xinjiang.”
China Agricultural Economic Review , vol. 13, no. 1, pp. 193-210.https://doi.org/10.1108/CAER-06-2020-0115
-
Zhang, L. and Y. Zhao. 2021. “Breaking the Vicious Cycle between Illness and Poverty: Empirical Actions on Land Use in an Oasis Agricultural Area.”
Land , vol. 10, no. 4.https://doi.org/10.3390/land10040335
-
Zheng, L., Shepherd, D. and M. E. Batuo. 2021. “Variations in the determinants of regional development disparities in rural China.”
Journal of Rural Studies , vol. 82, pp. 29-36.https://doi.org/10.1016/j.jrurstud.2020.08.011