

- EAER>
- Journal Archive>
- Contents>
- articleView
Contents
Citation
| No | Title |
|---|
Article View
East Asian Economic Review Vol. 27, No. 4, 2023. pp. 273-301.
DOI https://dx.doi.org/10.11644/KIEP.EAER.2023.27.4.425
Number of citation : 0View
186
Download
140
The Impacts of Climate Variability on Household Consumption: Evidence Based on Village Weather Data in Indonesia
|
|
Kyung Hee University |
|---|---|
|
|
Kyung Hee University |

Abstract
This study investigates the impacts of long-term climate variability on household consumption in Indonesia, a country highly vulnerable to climate change. The analysis combines household survey data from nearly 5,998 families with satellite-derived weather data from NASA POWER spanning 30 years. We use the long-term variability in temperature and precipitation as a proxy for climate change. This study examines the impact of climate change which proceeds over the long term, unlike previous studies concerning one-off or short-term climate events. In addition, using satellite data enhances the accuracy of households’ exposure to climate variability. The analysis finds that households in a village with higher temperature and precipitation variability significantly consume less food. This implies that households more exposed to climate change are at higher risk of malnutrition in developing countries. This study has a limitation that it cannot rule out the potential endogeneity of choosing a climatevulnerable residential location due to economic poorness.
JEL Classification: Q54, D60, O10
Keywords
Climate Change, Climate Variability, Consumption, Satellite Data, Indonesia
I. Introduction
Climate change has emerged as one of the most significant contemporary challenges. According to the Intergovernmental Panel on Climate Change (IPCC), there is a consensus on global warming and other climate system changes. These changes encompass a global average surface temperature increase of approximately 0.6℃ since 1861 (IPCC, 2014). However, the principal impacts of climate change are expected to manifest not primarily as increased temperatures but rather as alterations in the hydrological cycle, affecting processes like evaporation, transpiration, condensation, and precipitation. This could lead to more rain in the tropics and less in the sub-tropics, causing more extreme floods and droughts. As shown in Figure 1, the global average surface temperature has risen at an average rate of 0.17℃ per decade since 1901. At the same time, as average temperatures at the earth’s surface rise, more evaporation occurs, which, in turn, increases overall precipitation. Therefore, a warming climate is expected to increase precipitation in many areas. On average, the global precipitation has increase 0.04 inches per decade (United States Environmental Protection Agency, 2022).
Indonesia, a developing country, is located in tropical areas with two main seasons, namely rainy or wet season (November through March) and hot or dry season (April through October). The country experiences an average annual rainfall of 2700 millimeters (World Bank, 2023) with high variability based on its elevation. Meanwhile, the temperature is slightly change from season to season with average monthly temperature is ranging between 25℃ ~ 26℃. Due to its climate variability, Indonesia is highly vulnerable to climate change shocks. Flooding frequently occurs in certain area during rainy season where there are heavy rainfall events (Wu et al., 2013). On the other hand, droughts are often experienced, especially during the dry season of El Nino years. Also, there is a significant and spatially coherent trends of warming in the temperature indices over Indonesia, where the frequency of cool days and cool nights decrease, while the warm days and warm nights are observed more frequently (Supari et al., 2016). According to the Global Climate Risk Index 2021 report, Indonesia ranks 14th in terms of climate risk and third in terms of fatalities. It also faces vulnerabilities to extreme events such as floods, droughts, and long-term changes including sea-level rise, shifts in rainfall patterns, and rising temperatures (ADB, 2021).
This study addresses two research questions regarding climate change and welfare in Indonesia, a developing country ranking among the top third of nations in terms of climate risk. First, to what degree does the climate variability affect the household consumption? Second, through which pathways does the climate variability affect the household consumptions? We use nationally representative survey data from the Household Social Economy Survey 2011, Baseline (World Bank, 2013), which is then merged with long-term historical weather data from NASA POWER. We apply the civil registry data from the survey to identify the village associated with each household and determine the corresponding geographic coordinates (longitude and latitude). Subsequently, this information is used to access the historical weather data for the period 1981-2010.
The results of study find that climate variability has a strong and consistent negative effect on household consumption. Specifically, among climate change indicators, temperature variability reduces household consumption the most consistently and significantly. This study also finds that food consumption is more affected than non-food consumption by climate factors. Importantly, these findings hold strong even when alternative climate indicators are considered, such as the deviation of temperature and precipitation, as well as total number of hot days. Our further analysis also reveals that two underlying pathways are highlighted as potential mechanisms leading to a decline in household consumption: one is linked to the deterioration of working conditions, and the other is associated with lowered agricultural productivity.
The rest of the paper is organized as follows: Section II provides a review of the literature and a conceptual framework; Section III describes the data and methodology; Section IV presents estimation results on the consumption impacts of climate variability; Section V analyses the pathways of climate variability leading to consumption impacts; Section VI concludes the study.
II. Literature Review and Research Hypothesis
1. Climate Change and Household Welfare in Developing Countries
The literature on the relationship between climate and welfare in developing countries has evolved significantly in recent decades. Previous studies have identified two main directions within this literature: the first focuses on the impact of climate change at the macro-level (national or regional), while the other its impact at the microlevel (household).
In the first strand, Dell et al. (2009) reveal that higher temperatures have a substantial negative impact on economic growth in poor countries, while having little effect on rich countries. The impact in poor countries extends beyond lowering growth rates; it also affects various aspects, including agricultural output, industrial output, aggregate investment, and even political stability. Subsequent studies examine the effects of climate change on economic growth using extensive panel datasets (Lanzafame, 2014; Berlemann and Wenzel, 2018; Henseler and Schumacher, 2019; Donadelli et al., 2022; Paglialunga et al., 2022, etc.). Those studies consistently confirm the negative growth effect of climate change.
While previous studies focused on the impact of climate change at macro-level, some scholars insist that this approach is insufficient to identify how climate change affects household poverty (Hallegate and Rozenberg, 2017). In a similar vein, Skoufias et al. (2011) review the literature estimating the impact of climate change on poverty and find that most estimates ignore the effect of aggregate economic growth on poverty and household welfare.
In response, several recent studies examine the impact of climate change on household welfare, yielding different results. For instance, Diallo (2023) estimates the effect of rainfall shocks on income in Niger by merging climate shock data at the communal level with household survey data. Azzarri and Signorelli (2020) find that more rainfall is associated with a decrease in total and food consumption and an increase in extreme poverty. Nguyen et al. (2020) use a panel dataset of approximately 4,000 households in Northeast Thailand and Central Vietnam collected over three different years. The results show that weather shocks have significant effects on household income, consumption, and poverty. Wineman et al. (2017) estimate the effect of weather extremes on different types of household welfare indicators in rural Kenya, namely income and calorie intake. Bayudan-Dacuycuy and Baje (2018) investigate the poverty effect of rainfall shocks in the Philippines by employing household survey data. The results show that rainfall shocks negatively affect agricultural and non-agricultural wages.
Some studies focus on food consumption impacts of weather shocks. Lazzaroni and Bedi (2014) examine the impact of climate variations on food consumption in Uganda using a panel data for 5 years. The findings report that higher temperatures significantly reduce food consumption, while rainfall variations do not substantially. Etwire (2023) uses a large dataset in Ghana to observe that temperature has a negative impact on income and food consumption because of the lower productivity in a hot condition.
Since most of these studies were conducted within a single country, variations in regional characteristics could account for different outcomes. This study contributes to the literature by investigating the relationship between climate variability and household consumption in Indonesia. Indonesia, a large archipelagic country with more than 17,000 islands over 81,000 km of coastline, enable to consider the regional differences in climate conditions within a country. Moreover, this study employs micro-level data, which allows for a more detailed analysis of the impact of climate change on household welfare compared to previous macro-level studies. To be more specific, this study leverages the accessibility of administrative data from surveys to capture a household’s long-term weather conditions from a satellite-derived data of NASA POWER. This source provides sufficient accuracy and coverage in a region where surface measurements are sparse or non-existent. Indonesia has a limited number of ground weather stations, approximately 180 stations covering 37 provinces, and to be worse, they are unevenly distributed across the country. NASA POWER is a useful source to overcome such data gaps or unavailability.
2. Conceptual Framework
Climate change is described as the change in the average condition in a region over a long period of time, usually 30 years or more. Scientists found that climate change since the industrial revolution intensified the variability or deviation from long-term average of weather indicators such as temperature, rainfall, snow, humidity, and wind. Following previous studies, this paper uses the variability of temperature and precipitation as proxy of climate change.
There are many studies to investigate the climate change and household consumption nexus (Auffhammer and Aroonruengsawat, 2011; Lazzaroni and Bedi, 2014; Bandyopadhyay and Skoufias, 2015; Amare et al., 2018; Aggarwal, 2020; Azzarri and Signorelli, 2020; Nguyen et al., 2020; Barua and Banerjee, 2020, etc.). In light of the existing literature, climate change has the potential to influence household consumption through various avenues (Hallegate et al., 2014, etc.). One avenue is the price mechanism. When prices fluctuate, it can have adverse effects on consumption, primarily driven by shifts in agricultural productivity. Rising temperatures, for instance, can disrupt the habitats of agricultural pests, resulting in diminished crop yields and subsequent price hikes for agricultural goods (FAO, 2008). Additionally, extreme events like droughts can alter irrigation needs due to dwindling water availability, primarily stemming from low precipitation. Conversely, floods can also lead to decreased food accessibility and distribution due to infrastructure damage, such as road networks connecting different regions (Baez et al., 2016). The high intensity of shock such as droughts and floods, can result in significant crop losses and render extensive areas of arable land unsuitable for cultivation. It, therefore, can impact the land’s health and its suitability for growing crops.
Another pathway involves a decrease in agricultural and non-agricultural income (Carpena, 2019). For example, extreme temperatures can result in reduced labor productivity due to heat-related stress, lowering earnings (Lee et al., 2018). For household who relies on agricultural income, weather anomalies can diminish the agricultural production, reduce the quantity for selling in the market, and ultimately leading to the reduction of their earnings. Additionally, climate change may also lead to various types of adaptation costs, such as increased energy consumption, higher health expenditures, and greater infrastructure investments. At the household level, this could lead to reduced food consumption due to limited budgets and assets. Figure 2 presents the conceptual framework on the link between climate change and consumption.
III. Data and Estimation Model
1. Survey Data and Weather Data
This study utilizes an exclusive dataset that integrates socioeconomic details at the household level with climate-related factors. It draws on data from the Microdata Library of the World Bank titled “
For weather, NASA POWER Data provides long-term climatologically averaged estimates of meteorological variables with a resolution of 0.5°(latitude) x 0.625° (longitude) grid. Using annual temperature and precipitation data from 1980 to 2010, we compute their variabilities and other climate indicators. Figure 4 depicts the temperature and precipitation anomalies, deviations from 30-year averages, in three selected villages in the study are. The figures indicate that, in addition to a rising tendency in temperature, villages experienced severe droughts or extreme floods.
2. Estimation Strategy
This study uses cross-sectional approach at household level in estimating the welfare impact of climate variability. The household surveys utilized in this paper are conducted at a single point in time, rendering panel analysis unfeasible. The authors acknowledge that this cross-sectional analysis cannot fully address endogeneity, wherein households may choose to reside in climate-vulnerable areas due to economic constraints. Therefore, caution is required in interpreting the results of this study. The regression outcomes show the consumption characteristics of households living in climate-vulnerable areas, rather than causal effects of climate variability on consumption. However, it is notable that the household cross-section analysis has an advantage in flexibility to allow for observing the overall outcomes and understanding the relationship between climate and the economy without a priori assumption specific mechanisms. Also, it yields estimates of the long relationship between climate and aggregate output taking into account historical adaptation (Skoufias et al., 2011).
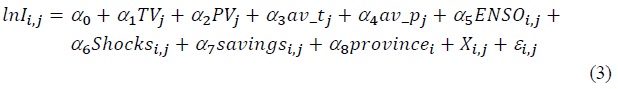
The estimation model is as follows:
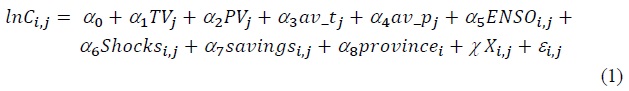
where
3. Variable Definitions and Measurement
This study uses current consumption expenditure as the dependent variable. This consumption consists of food consumption, non-food consumption, and total consumption. Food consumption comprises a household’s expenditure on food items. Initially, the consumption over the past seven days prior to the interview is recorded and then extrapolated to represent a month. Non-food consumption includes expenses for electricity, telephone bills, toiletries, clothing, education, transportation, taxes, and feasts. In the regression, all consumptions are the natural logarithm of the monthly consumption expenditure per person in a household.
To estimate the climate variability, we use coefficient of variation of temperature and precipitation as the ratio of its standard deviation and mean, following previous studies (Alem and Colmer, 2013, 2022; Bandyopadhy and Skoufias, 2015). The formula is as follows:
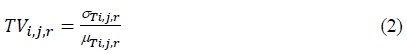
where,
This study controls for other shocks that a household experienced. These include the death of household head or primary income earner, the occurrence of a severe illness for the household head or primary breadwinners, and job loss or business failure in the preceding 12 months. Table 1 lists the description of all variables used in this study.
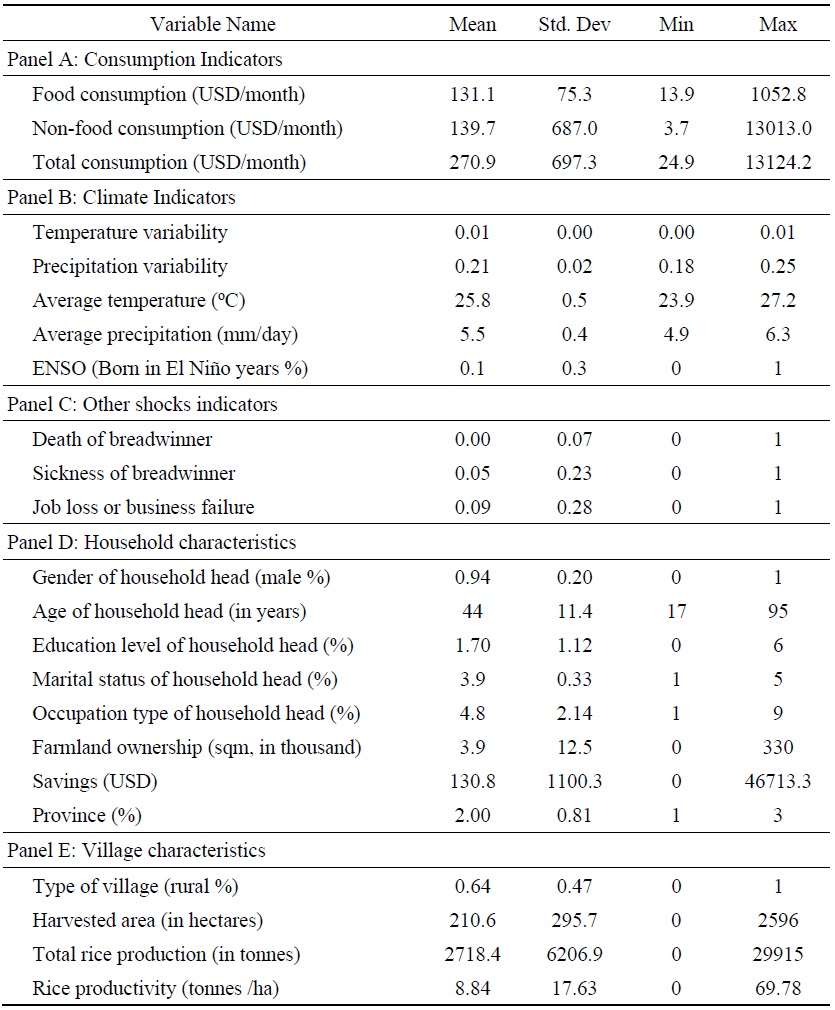
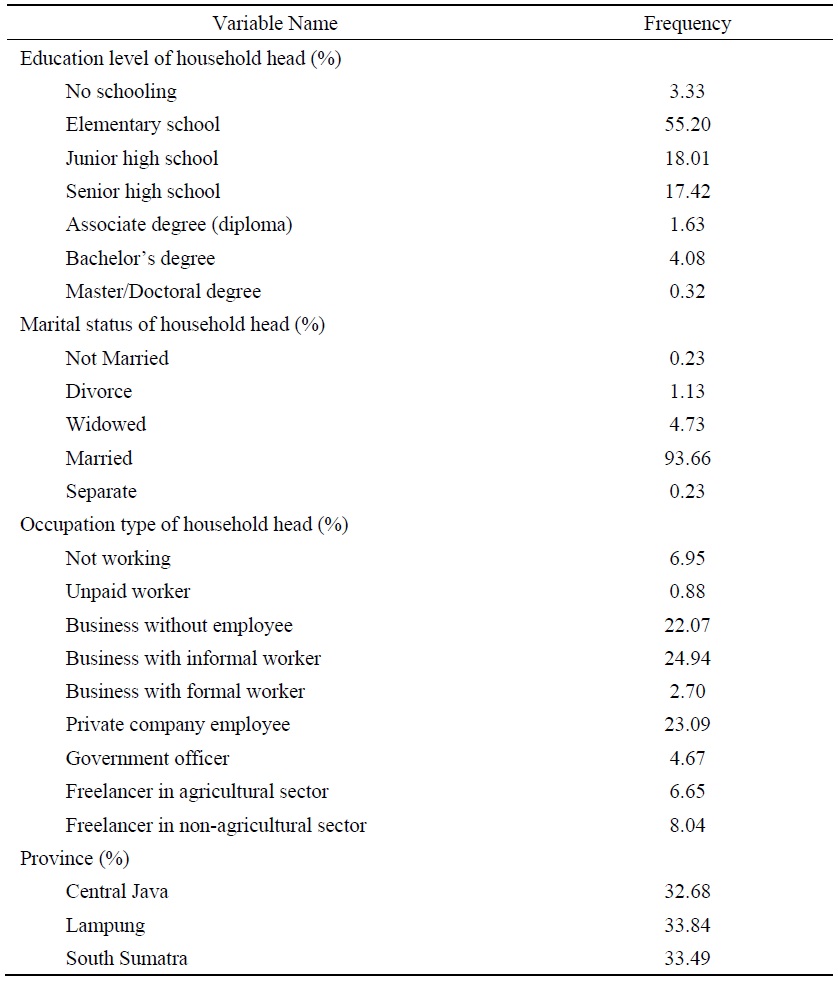
Table 2 presents descriptive statistics for the variables. The average food consumption was $131.13 USD per month, while the average non-food consumption was $139.78 USD with larger variations among households. Panel B of Table 2 provides insights into climate indicators for 30 years. The long-term historical means of average temperature and precipitation were 25.8℃ and 5.5 mm/day, and precipitation had greater variability than temperature. Approximately 10% of household heads were born in the year of El Niño. It is notable that 55% of household heads completed only elementary school, the sampled households were evenly distributed among provinces, and 64% of the village were categorized as rural area. The frequency of the categorical variables is in the Table A1 of the Appendix.
1)The enumerated villages were predetermined and then the SLS or small enumeration areas were selected based on population size. Then, the survey continued with selecting 10 households randomly for interview. The selected households must meet several criteria such as having children aged 0-6 years, children aged under 15 years in school, or having a pregnant woman.
2)In Indonesia, the years characterized by low-level El Niño events occurred in 1951, 1963, 1968, 1969, 1976, 1977, 2004, and 2006, while moderate-level events were recorded in 1986, 1987, 1994, and 2002. High-level El Niño events were observed in 1965, 1972, 1982, 1991, 1997, and 2009.
IV. Climate Variability and Household Consumption
1. Basic Results
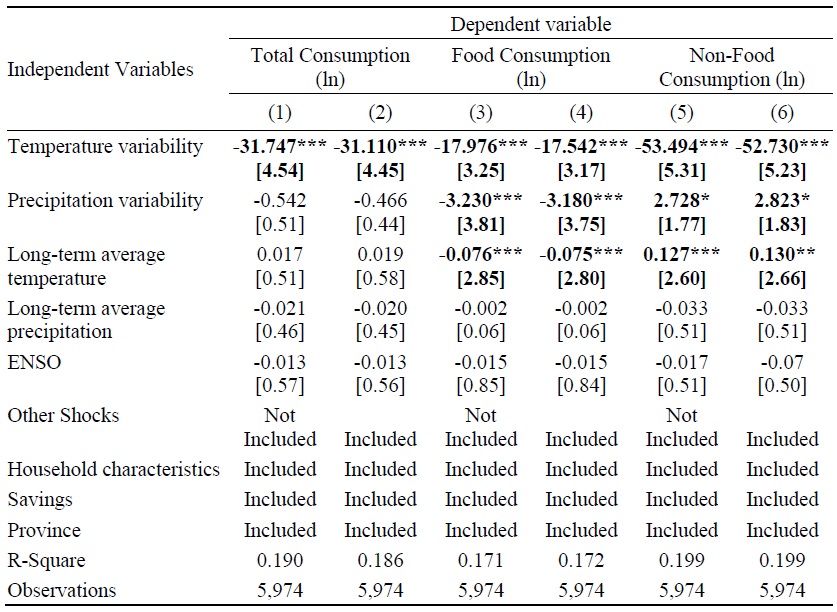
The main results for household total, food, and non-food consumptions are presented in Table 3. The findings reveal that temperature variability negatively associated with household total consumption. Specifically, a one unit increase in temperature variability is associated with a decrease in total consumption by 31.7 %. These results remain robust when other shocks variables are included in the model, confirming that temperature variability is likely to disrupt the regular pattern of household total consumption. These results are also consistent with previous studies (Baez et al., 2016; Amare et al., 2018; Azzarri and Signorelli, 2020; Nguyen et al., 2020; Boansi et al., 2021; Khalili et al., 2021). However, the result shows that there is no significant relationship between long-term average temperature and precipitation on total consumption. In similar vein, the birth in El Nino years does not correlate with total household consumption.
The results suggest that both temperature and precipitation variability have a negative and significant effect on household consumption for food items. A one unit increase in temperature variability is linked to a decrease in food consumption by 17.9%, and a one unit increase in precipitation variability is associated to a reduction by 3.2%. Still, the results are consistent when including other shock variables. While these results confirm the findings from some previous literature (Carpena, 2019; Aggarwal, 2020). Furthermore, long-term average temperature is significantly link to the reduction of food consumption. A 1℃ increase of average temperature is associated to a 0.07 percent reduction of household consumption in food items. However, there is no evidence regarding the significant impact of long-term average precipitation on food consumption. El Niño has no significant impact on food expenditure.
Meanwhile, temperature variability is observed to have a negative effect on non-food expenditure as well. A one unit increase in temperature variability is associated to a 53 percent reduction in non-food consumption. However, it is remarkable that precipitation variability has positive relationship with non-food consumption, indicating that its one unit increase leads to approximately 2.8 percent rise in non-food expenditure. There is no evidence of correlation between average precipitation and non-food consumption, whereas average temperature is positively correlated with non-food consumption.
Previous studies suggest some possible explanations about the consumption effects of climate variability. The negative impact on total consumption is commonly explained by the deterioration of working conditions and the consequent income loss. The negative impact on food consumption is often attributed to the reduction of agricultural output, leading to food shortages and rising food prices. Meanwhile, the increasing effect of precipitation variability on non-food consumption can be explained by the adjustment cost. This cost encompasses more energy consumption for cooling, potential increases in health expenditure due to the proliferation of diseases, or the recovery cost after extreme events such as flooding.3 The pathways from climate change to consumption is further discussed and tested in Section V.
2. Robustness Test
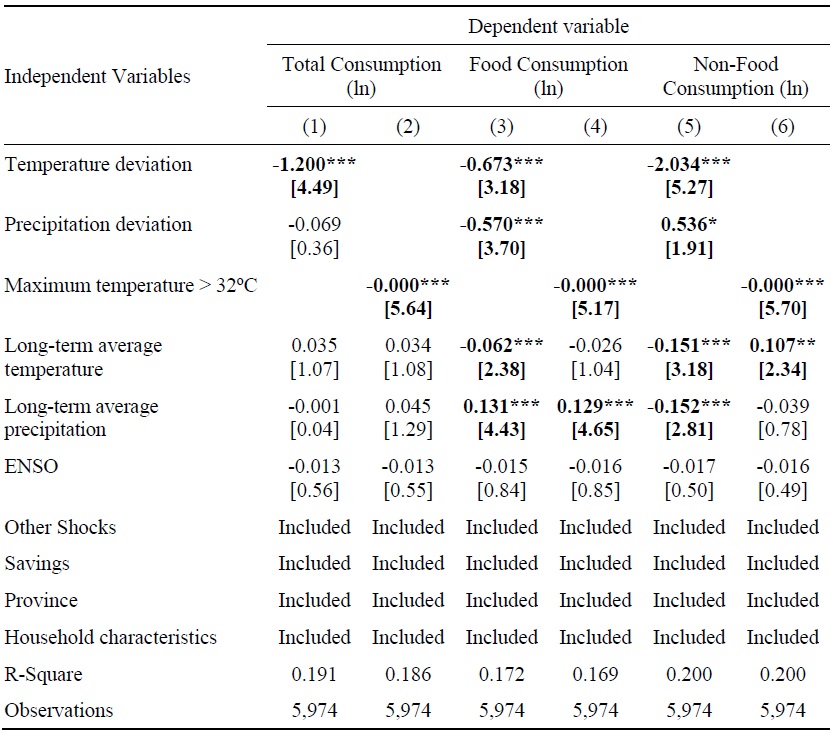
In this section, we provide the robustness check of our empirical results by employing alternative climate indicators and shortening the time span of climate variability. In Table 4, we use deviation of temperature and precipitation or the total number of days with maximum temperature exceeding 32℃ for 30 years, instead of the coefficients of variation.4 The results confirm our findings in Table 3 that there is a significant negative relationship between temperature deviation and household consumption. The results are still robust when we employ the number of hot days. In addition, the results find that while precipitation deviation significantly reduce household food consumption, it has a positive impact on non-food consumption. Again, it indicates that food consumption is more affected to climate change than non-food consumption.
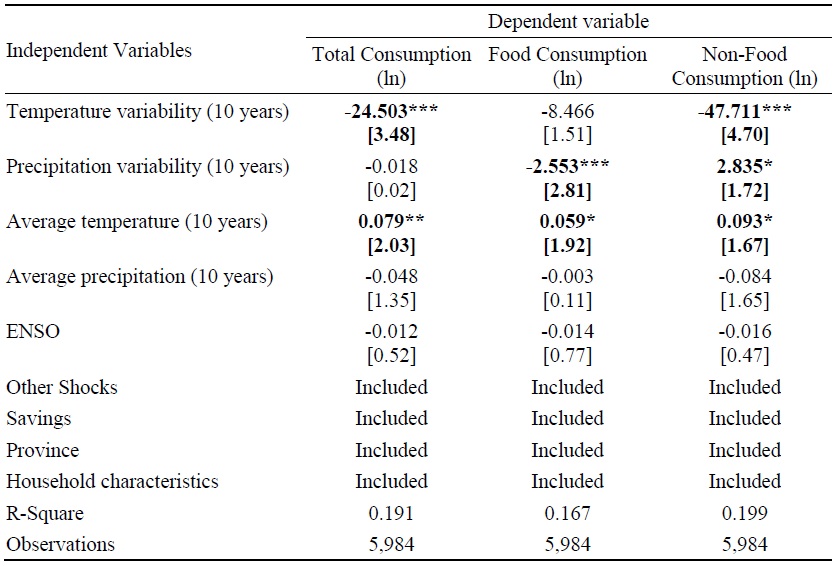
For further robustness check, we employ 10-year climate variability, instead of 30-year one, acknowledging that current consumptions may be associated with a more recent climate dynamic. Table 5 reports the results using recent 10-year climate data, which are similar to the basic results. There is significant and negative relationship between climate variability and household consumption. Temperature variability reaffirms the strongest impact on non-food consumption. The coefficient for precipitation shocks has negative and significant effect on food consumption but has positive and significant effect on non-food consumption. The main difference appears in the results for food consumption which does not attain statistical significance when using temperature variability in 10 years.
3)The adaptation cost hypothesis is supported by empirical studies
4)Previous studies also utilized these climate indicators
V. Pathways of Climate Variability
As mentioned above, the literature suggests several possible pathways through which climate variability affects household consumption. In this section, we test two of those pathways using data available in the Indonesia’s household survey: the working condition pathway and the agricultural productivity pathway.
1. Working Condition Pathway
Higher variability of temperature may lead to more frequent extreme temperature such as hot days and nights. Extreme heat can substantially worsen the workplace environment, which affects workers’ concentration and their ability to sustain work and, thus, diminish the quality and quantity of their work output. Moreover, rising temperatures can lead to worker illness, resulting in shortened working hours and frequent absenteeism. Climate change can also affect the risk of unemployment. These explanations are supported by previous empirical studies (Yildirim et al., 2009; Zivin and Neidell, 2014; Carpena, 2019; Garg et al., 2020; Boansi et al., 2021; Liu and Lin, 2023).
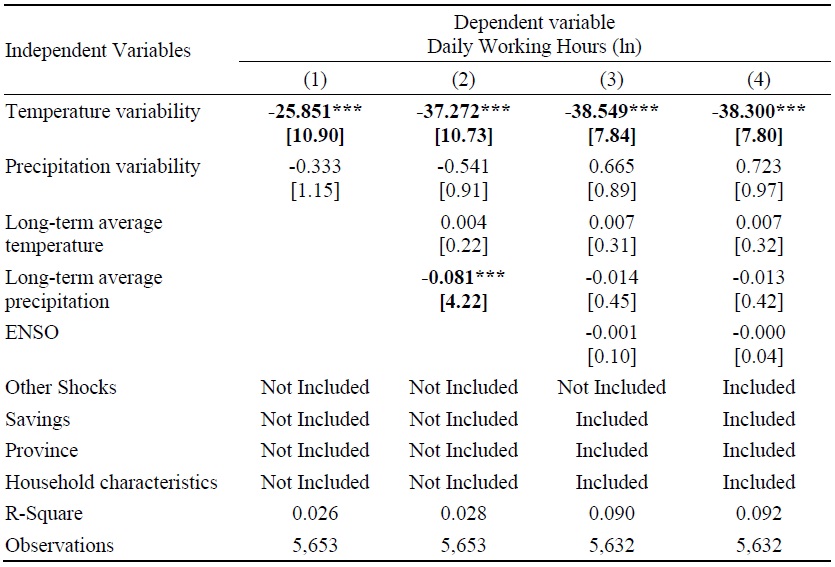
This section tests the working condition pathway for the Indonesian household sample. We use daily working hours as the proxy for working conditions. The estimation model is as follows,
where,
Table 6 shows the results for daily working hours. We find that temperature variability significantly shortens working hours, while precipitation variability has no significant impact on it. Furthermore, the results also reveal long-term average temperature and long-term average precipitation do not significantly contribute to the reduction of daily working hours. These findings are consistent with the results on total consumption, implying that deteriorated working conditions and resulting income loss is a channel through which long-term temperature variability are associated with reduced total consumption.5
2. Agricultural Productivity Pathway
A rise in climate variability can exert a negative influence on agricultural productivity in various ways. Disrupted harvest timing or extreme heat encourage pests and hinder crop growth, causing a decline in overall agricultural production. Insufficient rainfall or prolonged droughts can limit water availability, necessitating changes in agricultural irrigation practices and affecting crop yields. Many studies support this agricultural productivity channel (Lambert, 2014; Bannayan et al., 2011; Amare et al., 2018; Verón et al., 2015; Manuel et al., 2021).
Lower agricultural productivity renders households faced with food shortages and rising food prices, which consequently lead to reduction in food consumption.6 To test this pathway, we estimate the impact of climate variability on agricultural productivity at village level. Agricultural productivity in a village is measured as rice productivity, that is, the total rice production (tonnes) per hectare from the survey data. The estimation equation is as follows,

where
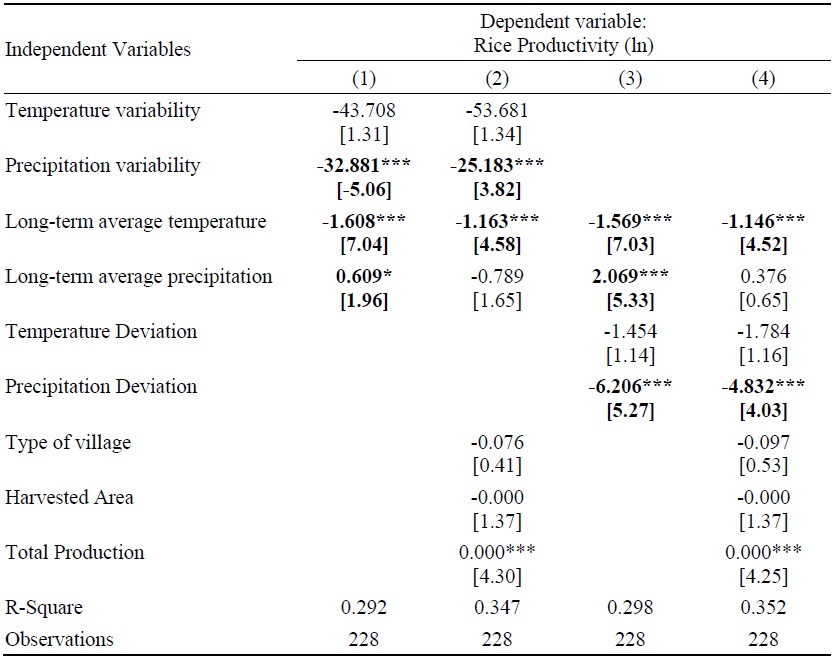
As shown in Table 7, precipitation variability statistically has a negative and significant impact on rice productivity. These results remain robust as we introduce control variables into the specification model or use precipitation deviation instead of its variability in the column (3) and (4) of Table 7. It is, however, notable that temperature variability has no significant impact on rice productivity. The negative impact of precipitation variability can be attributed to the critical role of precipitation in irrigation system. The irrigation system consistently provides a natural and adequate water to rice fields, ensuring that the soil remains suitably moist for optimal growth of rice plant. However, higher variability of precipitation could lead to a greater irregularity of rainfall and shortage of the water source for rice fields (Shortridge, 2019). In contrast, temperature conditions are less critical to rice growth and have lower variability than precipitation in Indonesia. Just, too high temperature reduces rice production as the result indicates.7 These results imply that rice productivity can be one of pathways through which precipitation variability negatively affects food consumption in Indonesian rural households, but it cannot explain the negative impact of temperature variability on food consumption.
5)Recently,
6)Another channel to less food consumption is the disruption of food distribution due to climate shocks. For example, fluvial flooding can contribute to food price increases because the damage of infrastructure such as roads may hinder food distribution
7)Similarly, previous studies report that an increase in high temperature may reduce rice productivity
Ⅵ. Conclusion
This paper investigates how in Indonesia a region’s climate variability, likely intensified by climate change over long time, affects the food and non-consumption of households in the region. For the analysis, we combined a large household dataset with satellite-derived weather data of 30 years.
The study finds that temperature variability significantly reduces all categories of consumption, total, food, and non-food. In contrast, precipitation variability has a negative and significant impact only on food consumption, but a positive impact on non-food consumption. Most of these results hold robust even after controlling for other factors and substituting indicators of climate variation. When we rely on the voluminous literature, deteriorated working conditions and income loss due to heat or heavy rain can explain a part of the negative effect on total consumption. As well, the reduction in food consumption caused by temperature and precipitation variability can be explained by agricultural productivity mechanism and be aggravated by the adaptation cost to precipitation shocks. Therefore, this study concludes that, among total household consumption, food consumption is particularly vulnerable to climate variability in developing countries.
Furthermore, this study tests two possible pathways, that is, working condition and agricultural productivity, finds that temperature variability affects via the working condition channel, while precipitation variability does via agricultural productivity channel could be potential pathways through which climate change affects household consumption. These findings are mostly consistent with our basic results and previous empirical studies for different developing economies.
Finally, we need to note that this study has a limitation. While this study attempts to capture the long-term impact of climate change on current household consumption, it is constrained by a cross-section specification, instead of panel analysis, due to data availability. Therefore, we cannot rule out possible endogeneity, for example, due to the effect of economic constraint in choosing a residential location and possible missing of regional characteristics. Therefore, the caution is required in the interpretation of this study’s results. Nevertheless, this paper contributes to the literature by observing that households residing at a place with great climate vulnerability are at a higher risk of less food consumption or malnutrition in Indonesia.
Tables & Figures
Figure 1.
Temperature and Precipitation Worldwide, 1901-2021
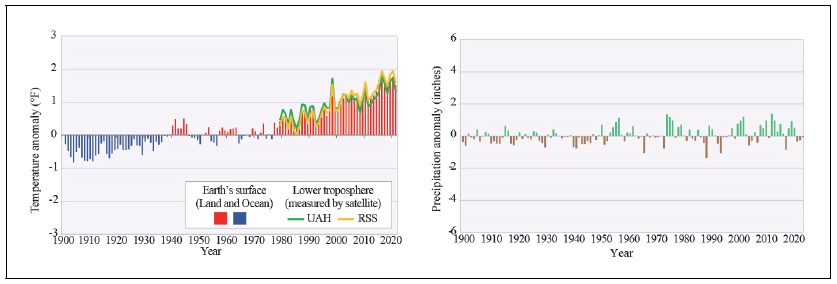
Source:
Figure 2.
Conceptual Framework
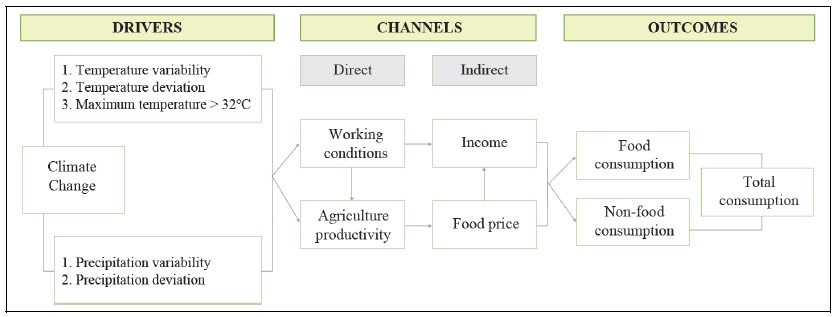
Source: Authors’ construction based on the literature.
Figure 3.
Study Area
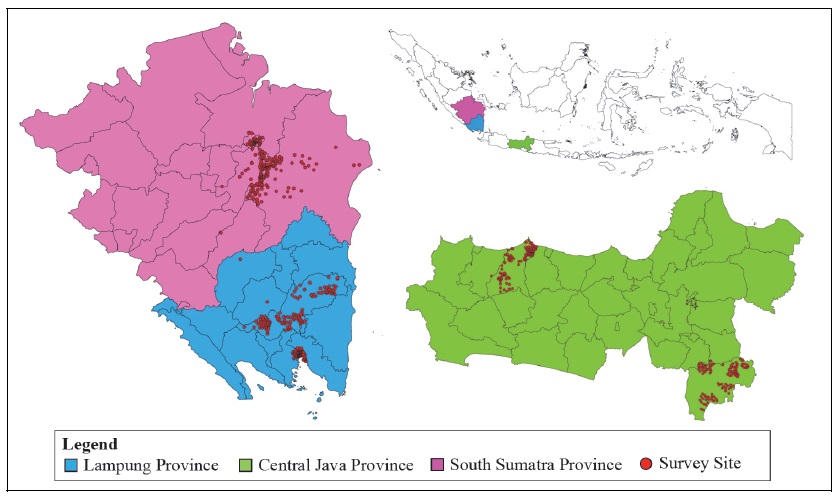
Source: Authors’ Modification.
Figure 4.
Temperature and Precipitation Anomalies in Three Selected Villages
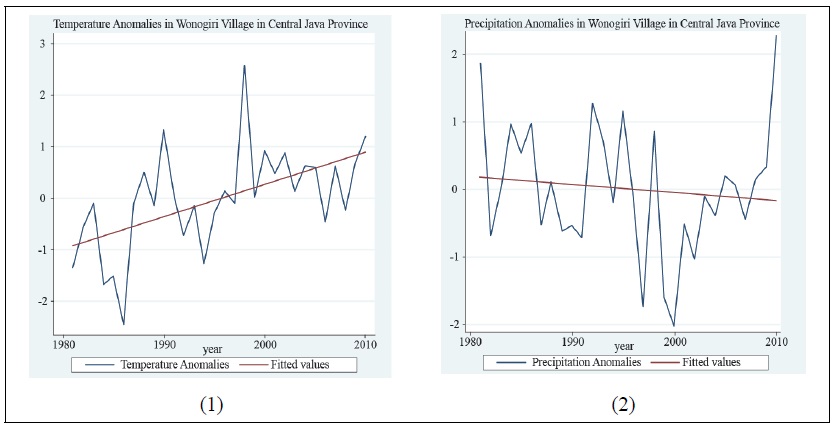
Figure 4.
Continued
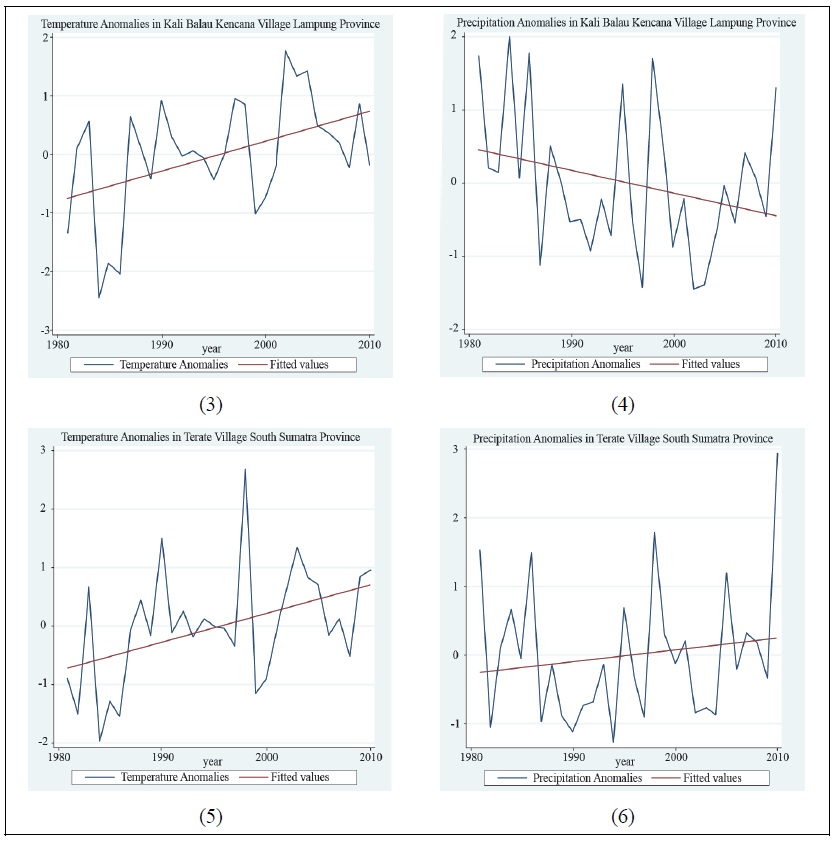
Notes: The anomalies of temperature and precipitation in Wonogiri Village, Central Java Province: (1) & (2), Kali Balau Kencana Village, Lampung Province: (3) & (4), and Terate Village, South Sumatra Province: (5) & (6).
Source: Authors’ calculation.
Table 1.
Description of Variables
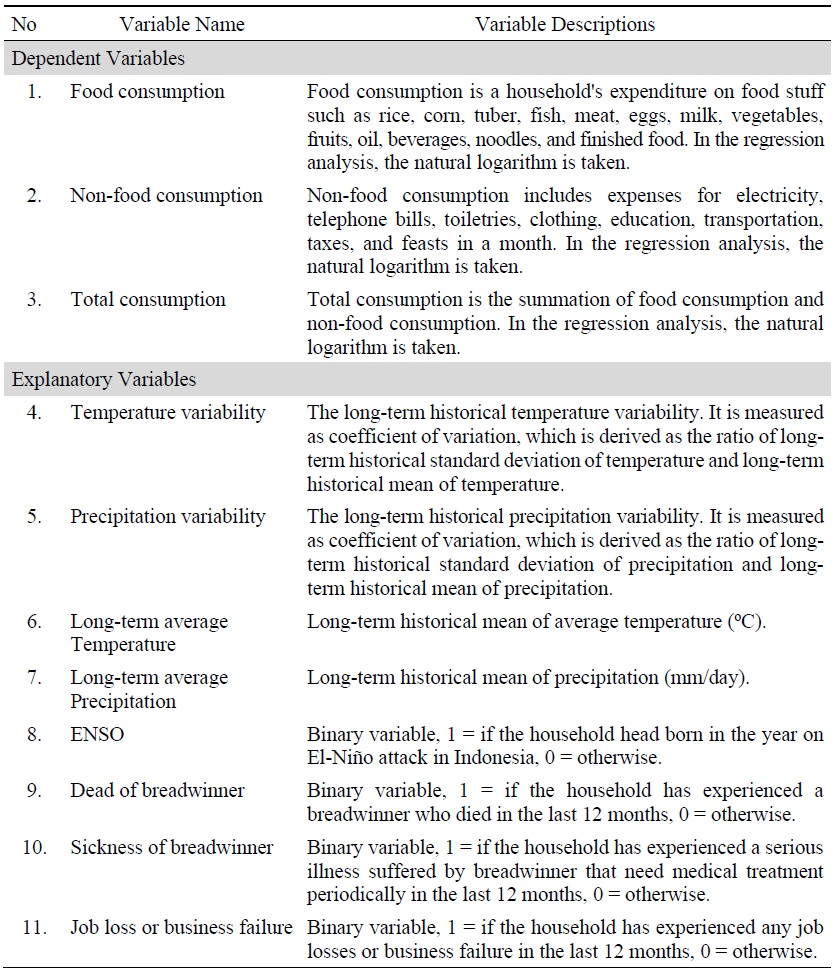
Table 1.
Continued
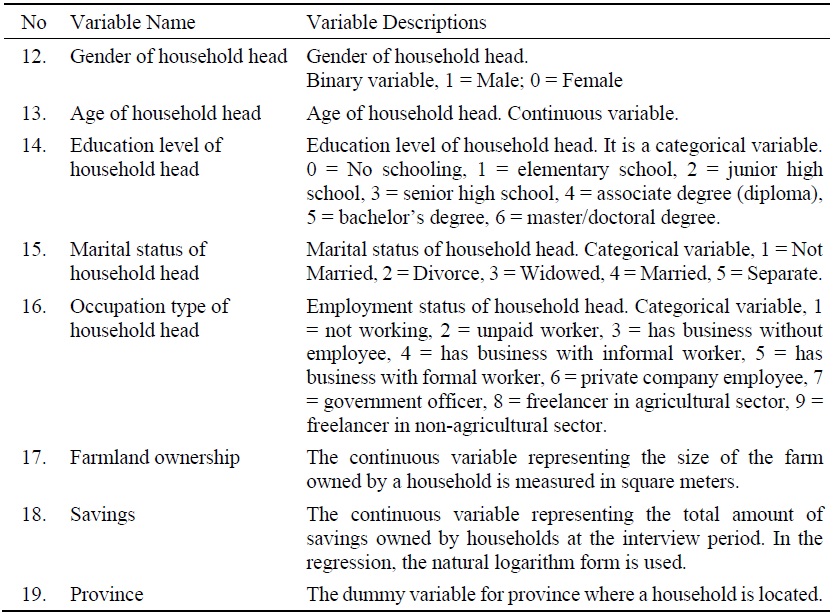
Table 2.
Summary Statistics for All Variables Used in the Statistical Models
Source: Authors’ calculation.
Table 3.
Long-term Impacts on Household Consumption
Note: t-statistics are in parentheses. Significance level is shown as ***
Source: Authors’ calculation.
Table 4.
Robustness Check with Alternative Climate Indicators
Note: t-statistics are in parentheses. Significance level is shown as ***
Table 5.
Robustness Check with 10-year Climate Data
Note: t-statistics are in parentheses. Significance level is shown as ***
Table 6.
Long-term Impacts on Daily Working Hours
Note: t-statistics are in parentheses. Significance level is shown as ***
Table 7.
Long-term Impacts on Agricultural Productivity
Note: t-statistics are in parentheses. Significance level is shown as ***
Table A1.
The Frequency of Education Level, Marital Status, Occupation Type, and Province
References
-
Abbas, S. and Z. A. Mayo. 2021. “Impact of Temperature and Rainfall on Rice Production in Punjab, Pakistan.”
Environment, Development and Sustainability , vol. 23, no. 2, pp. 1706-1728.https://doi.org/10.1007/s10668-020-00647-8 
-
Aggarwal, R. 2020. “Impacts of Climate Shocks on Household Consumption and Inequality in India.”
Environment and Development Economics , vol. 26, no. 5-6, pp. 488-511.https://doi.org/10.1017/S1355770X20000388
- Alem, Y. and J. Colmer. 2013. “Optimal Expectations and the Welfare Cost of Climate Variability: A Subjective Well-Being Approach.” Centre for Climate Change Economics and Policy Working Paper, no. 138. Centre for Climate Change Economics and Policy and Grantham Research Institute on Climate Change and the Environment.
-
Alem, Y. and J. Colmer. 2022. “Blame it on the rain: Rainfall Variability, Consumption Smoothing, and Subjective Well-being in Rural Ethiopia.”
American Journal of Agricultural Economics , vol. 104, no. 3, pp. 905-920.https://doi.org/10.1111/ajae.12253
-
Amare, M., Jensen, N. D., Shiferaw, B. and J. D. Cissé. 2018. “Rainfall shocks and agricultural productivity: Implication for rural household consumption.”
Agricultural Systems , vol. 166, pp. 79-89.https://doi.org/10.1016/j.agsy.2018.07.014
-
Asian Development Bank (ADB). 2021.
Climate Risk Profile: Indonesia . World Bank Group and Asian Development Bank. -
Auffhammer, M. and A. Aroonruengsawat. 2011. “Simulating the Impacts of Climate Change, Prices and Population on California’s Residential Electricity Consumption.”
Climatic Change , vol. 109 (Suppl 1), pp. S191-S210.https://doi.org/10.1007/s10584-011-0299-y
-
Azzarri, C. and S. Signorelli. 2020. “Climate and Poverty in Africa South of the Sahara.”
World Development , vol. 125.https://doi.org/10.1016/j.worlddev.2019.104691
-
Baez, J. E., Lucchetti, L., Genoni, M. E. and M. Salazar. 2016. “Gone with the Storm: Rainfall Shocks and Household Wellbeing in Guatemala.”
Journal of Development Studies , vol. 53, no. 8, pp. 1253-1271.https://doi.org/10.1080/00220388.2016.1224853
-
Bandyopadhyay, S. and E. Skoufias. 2015. “Rainfall Variability, Occupational Choice, and Welfare in Rural Bangladesh.”
Review of Economics of the Household , vol. 13, pp. 589-634.https://doi.org/10.1007/s11150-013-9203-z
-
Bannayan, M., Lotfabadi, S. S., Sanjani, S., Mohamadian, A. and M. Aghaalikhani. 2011. “Effects of Precipitation and Temperature on Crop Production Variability in Northeast Iran.”
International Journal of Biometeorology , vol. 55, pp. 387-401.https://doi.org/10.1007/s00484-010-0348-7
-
Barua, S. and A. Banerjee. 2020. “Impact of Climatic Shocks on Household Well-being: Evidence from Rural Bangladesh.”
Asia-Pacific Journal of Rural Development , vol. 30, no. 1-2, pp. 89-112.https://doi.org/10.1177/1018529120977246
- Bayudan-Dacuycuy, C. and L. K. Baje. 2018. “When It Rains, It Pours? Analyzing the Rainfall Shocks-Poverty Nexus in the Philippines.” PIDS Discussion Paper Series, no. 2018-32. Philippine Institute for Development Studies.
-
Berlemann, M. and D. Wenzel. 2018. “Hurricanes, Economic Growth and Transmission Channels: Empirical Evidence for Countries on Differing Levels of Development.”
World Development , vol. 105, pp. 231-247.https://doi.org/10.1016/j.worlddev.2017.12.020
-
Boansi, D., Owusu, V., Tambo, J. A., Donkor, E. and B. O. Asante. 2021. “Rainfall Shocks and Household Welfare: Evidence from Northern Ghana.”
Agricultural Systems , vol. 194.https://doi.org/10.1016/j.agsy.2021.103267
-
Carpena, F. 2019. “How Do Droughts Impact Household Food Consumption and Nutritional Intake? A Study of Rural India.”
World Development , vol. 122, pp. 349-369.https://doi.org/10.1016/j.worlddev.2019.06.005
-
Dell, M., Jones, B. F. and B. A. Olken. 2009. “Temperature and Income: Reconciling New Cross-Sectional and Panel Estimates.”
American Economic Review , vol. 99, no. 2, pp. 198-204.https://doi.org/10.1257/aer.99.2.198
- Diallo, Y. 2023. “The Effects of Climate and Conflict Shocks on Household Welfare: Niger.” IMF Selected Issues Papers, no. SIP/2023/008. International Monetary Fund.
-
Donadelli, M., Jüppner, M. and S. Vergalli. 2022. “Temperature Variability and the Macroeconomy: A World Tour.”
Environmental and Resource Economics , vol. 83, pp. 221-259.https://doi.org/10.1007/s10640-021-00579-5
-
Egbendewe-Mondzozo, A., Musumba, M., McCarl, B. A. and X. Wu. 2011. “Climate Change and Vector-Borne Diseases: An Economic Impact Analysis of Malaria in Africa.”
International Journal of Environmental Research and Public Health , vol. 8, no. 3, pp. 913-930.https://doi.org/10.3390/ijerph8030913
-
Etwire, P. M. 2023. “
The Impact of Warming on Food Consumption .” Climate and Development.https://doi.org/10.1080/17565529.2023.2206383 -
Fitz, D. and R. League. 2020. “The Impact of Early-Life Shocks on Adult Welfare in Brazil : Questions of Measurement and Timing.”
Economics & Human Biology , vol. 37.https://doi.org/10.1016/j.ehb.2019.100843
-
Food and Agriculture Organization (FAO). 2008.
Climate Change and Food Security: A Framework . United Nation. -
Garg, T., Gibson, M. and F. Sun. 2020. “Extreme Temperatures and Time Use in China.”
Journal of Economic Behavior & Organization , vol. 180, pp. 309-324.http://doi.org/10.1016/j.jebo.2020.10.016
-
Hallegatte, S. and J. Rozenberg. 2017. “Climate Change Through a Poverty Lens.”
Nature Climate Change , vol. 7, pp. 250-256.https://doi.org/10.1038/nclimate3253
- Hallegatte, S., Bangalore, M., Bonzanigo, L., Fay, M., Narloch, U., Rozenberg, J. and A. Vogt-Schilb. 2014. “Climate Change and Poverty: An Analytical Framework.” Policy Research Working Papers, no. 7126. World Bank Group.
-
Henseler, M. and I. Schumacher. 2019. “The Impact of Weather on Economic Growth and Its Production Factors.”
Climatic Change , vol. 154, no. 3-4, pp. 417-433.https://doi.org/10.1007/s10584-019-02441-6
-
Hu, Z. and T. Li. 2019. “Too Hot to Handle : The Effects of High Temperatures during Pregnancy on Adult Welfare Outcomes.”
Journal of Environmental Economics and Management , vol. 94, pp. 236-253.https://doi.org/10.1016/j.jeem.2019.01.006
- Intergovernmental Panel on Climate Change (IPCC). 2014. “Climate Change 2014: Impacts, Adaptation, and Vulnerability. Part A: Global and Sectoral Aspects.” Contribution of Working group II to the Fifth Assessment Report of the Intergovernmental Panel on Climate. WMO. UNEP. Cambridge University Press.
-
Khalili, N., Arshad, M., Kächele, H., Farajzadeh, Z. and K. Muller. 2021. “Drought Shocks and Farm Household Consumption Behavior: Insights from Fars Province of Iran.”
International Journal of Disaster Risk Reduction , vol. 66.https://doi.org/10.1016/j.ijdrr.2021.102625
-
Krishnan, P., Ramakrishnan, B., Reddy, K. R. and V. R. Reddy. 2011. “High-Temperature Effects on Rice Growth , Yield , and Grain Quality.”
Advances in Agronomy , vol. 111. pp. 87-206.https://doi.org/10.1016/B978-0-12-387689-8.00004-7 -
Lambert, D. K. 2014. “Historical Impacts of Precipitation and Temperature on Farm Production in Kansas.”
Journal of Agricultural and Applied Economics , vol. 46, no. 4, pp. 439-456.https://doi.org/10.1017/S1074070800029047
-
Lanzafame, M. 2014. “Temperature, Rainfall and Economic Growth in Africa.”
Empirical Economics , vol. 46, pp. 1-18.https://doi.org/10.1007/s00181-012-0664-3
-
Larsen, P. H., Goldsmith, S., Smith. O, Wilson, M. L., Strzepek, K. Chinowsky, P. and B. Saylor. 2009. “Estimating Future Costs for Alaska Public Infrastructure at Risk from Climate Change.”
Global Environmental Change , vol. 18, no. 3, pp. 442-457.
-
Lazzaroni, S. and A. S. Bedi. 2014. “Weather Variability and Food Consumption: Evidence from Rural Uganda.” ISS Working Paper Series, no. 585. International Institute of Social Studies.
https://repub.eur.nl/pub/51272 -
Lee, S.-W., Lee, K. and B. Lim. 2018. “Effects of Climate Change-Related Heat Stress on Labor Productivity in South Korea.”
International Journal of Biometeorology , vol. 62, pp. 2119-2129.https://doi.org/10.1007/s00484-018-1611-6
-
Liu, T.-Y. and Y. Lin. 2023. “Does Global Warming Affect Unemployment? International Evidence.”
Economic Analysis and Policy , vol. 80, pp. 991-1005.
-
Manuel, L., Chiziane, O., Mandhlate, G., Hartley, F. and E. Tostão. 2021. “Impact of Climate Change on The Agriculture Sector and Household Welfare in Mozambique: An Analysis Based on a Dynamic Computable General Equilibrium Model.”
Climate Change , vol. 167.https://doi.org/10.1007/s10584-021-03139-4
-
Morrissey, M. C., Casa, D. J., Brewer, G. J., Adams, W. M., Hosokawa, Y., Benjamin, C. L., Grundstein, A. J., Hostler, D., McDermott. B. P., McQuerry, M. L. et al. 2021. “Heat Safety in the Workplace: Modified Delphi Consensus to Establish Strategies and Resources to Protect the US Workers.”
GeoHealth , vol. 5, no. 8, pp. 1-32.https://doi.org/10.1029/2021GH000443
-
NASA. 2016. “El Niño Brought Drought and Fire to Indonesia [Infographic].” NASA Earth Observatory.
https://www.nasa.gov/feature/goddard/2016/el-nino-brought-drought-andfire-to-indonesia (Accessed September 10, 2023) -
Nguyen, T. T., Nguyen, T.- T., Le, V.-H., Managi, S. and U. Grote. 2020. “Reported Weather Shocks and Rural Household Welfare: Evidence from Panel Data in Northeast Thailand and Central Vietnam.”
Weather and Climate Extremes , vol. 30.https://doi.org/10.1016/j.wace.2020.100286
-
Paglialunga, E., Coveri, A. and A. Zanfei. 2022. “Climate Change and within-Country Inequality: New Evidence from A Global Perspective.”
World Development , vol. 159.https://doi.org/10.1016/j.worlddev.2022.106030
-
Pailler, S. and M. Tsaneva. 2018. “The Effects of Climate Variability on Psychological Well-Being in India.”
World Development , vol. 106, pp. 15-26.https://doi.org/10.1016/j.worlddev.2018.01.002
-
Shortridge, J. 2019. “Observed Trends in Daily Rainfall Variability Result in More Severe Climate Change Impacts to Agriculture.”
Climatic Change , vol. 157, pp. 429-444.https://doi.org/10.1007/s10584-019-02555-x
- Skoufias, E., Rabassa, M. and S. Olivieri. 2011. “The Poverty Impacts of Climate Change: A Review of the Evidence.” Policy Research Working Papers, no. 5622. World Bank Group.
-
Supari, F. T., Juneng, L. and E. Aldrian. 2016. “Observed Changes in Extreme Temperature and Precipitation over Indonesia.”
International Journal of Climatology , vol. 37, no. 4, pp. 1979-1997.https://doi.org/10.1002/joc.4829
-
U.S. Environmental Protection Agency (EPA). 2022. “Climate Change Indicators: U.S. and Global Precipitation.” United States Environmental Protection Agency.
https://www.epa.gov/climate-indicators/climate-change-indicators-us-and-global-precipitation (Accessed November 29, 2023) -
Verón, S. R., de Abelleyra, D. and D. B. Lobell. 2015. “Impacts of Precipitation and Temperature on Crop Yields in The Pampas.”
Climatic Change , vol. 130, pp. 235-245.https://doi.org/10.1007/s10584-015-1350-1
-
Wineman, A., Mason, N. M., Ochieng, J. and L. Kirimi. 2017. “Weather Extremes and Household Welfare in Rural Kenya.”
Food Security , vol. 9, no. 2, pp. 281-300.https://doi.org/10.1007/s12571-016-0645-z
-
World Bank. 2013. “Survei Sosial Ekonomi Rumah Tangga 2011, Baseline Indonesia, 2010-2011 [Dataset].” World Bank Microdata Libarary.
https://microdata.worldbank.org/index. php/catalog/1835 (Accessed June 24, 2023) -
World Bank. n.d. “Indonesia-Current Climate, Climatology [Infographic].” World Bank, Climate Change Knowledge Portal for Development Practitioner and Policy Makers.
https://climateknowledgeportal.worldbank.org/country/indonesia/climate-data-historical (Accessed August 2, 2023) -
Wu, P., Arbain, A. A., Mori, S., Hamada, J., Hattori, M., Syamsudin, F. and M. D. Yamanaka. 2013. “The Effects of an Active Phase of The Madden-Julian Oscillation on the Extreme Precipitation Event Over Western Java Island in January 2013.”
SOLA , vol. 9, pp. 79-83.https://doi.org/10.2151/sola.2013-018
-
Xu, Y., Chu, C. and S. Yao. 2021. “The Impact of High-Temperature Stress on Rice: Challenges and Solutions.”
Crop Journal , vol. 9, no. 5, pp. 963-976.https://doi.org/10.1016/j.cj.2021.02.011
-
Yildirim, K., Koyuncu, C. and J. Koyuncu. 2009. “Does Temperature Affect Labor Productivity: Cross Country Evidence.”
Applied Econometrics and International Development , vol. 9, no. 1. -
Zivin, J. G. and M. Neidell. 2014. “Temperature and the Allocation of Time: Implications for Climate Change.”
Journal of Labor Economics , vol. 32, no. 1.https://doi.org/10.1086/671766