

- EAER>
- Journal Archive>
- Contents>
- articleView
Contents
Citation
| No | Title |
|---|
Article View
East Asian Economic Review Vol. 27, No. 4, 2023. pp. 303-325.
DOI https://dx.doi.org/10.11644/KIEP.EAER.2023.27.4.426
Number of citation : 0View
49
Download
42
The Ebb and Flow of Regional Integration Vision in Asia-Pacific : From a Lens of Leaders’ Declarations over 30 Years
|
|
Soongsil University |
|---|

Abstract
This paper examines how APEC has transformed itself into an international forum for the vision of regional integration. It aims to quantify the documentation produced by the international organization and provide quantifiable evidence that aligns with prior knowledge rather than relying solely on intuition. For this purpose, I use various text mining techniques to extract multi-dimensional features from the text of APEC Leaders’ Declarations from 1993 to 2023. In terms of interest and expectations for APEC as a forum, it is found that members have experienced two major peaks and troughs over the last three decades. It is found that the change point coincides with the Asian financial crisis of 1997 and the tensions between the United States and China since 2017. To explore more various aspects of economic integration in the Asia-Pacific region, this study also considers how consistently APEC has been an international forum for addressing issues, which members are active, and how members have clustered based on their views of APEC.
JEL Classification: F13, F14
Keywords
APEC, Asia-Pacific Region, Bogor Goals, Regional Integration, Text-as-data, Text-mining Analysis
I. Introduction
APEC is an international forum that was established after a four-year preparation period starting in 1989 with the vision of a community of Asia-Pacific economies to find cooperative solutions to rapidly changing regional and global challenges after the Cold War. As stated in the Leader’s Declaration made at its first Summit in 1993, APEC members recognize their economic interdependence and promote a shared vision for stability, security, and prosperity for their people, including free trade in the Asia-Pacific. As a long-term goal to achieve that vision, the Bogor Goals was set in 1994 to achieve liberalization of trade and investment by developed members by 2010 and developing ones by 2020.
In the 30 years since then, has APEC developed into a forum to achieve its original vision and what changes has it undergone if any? To answer these questions, this study examines how the APEC Leaders’ Declarations have changed from the first in 1993 to the most recent in 2023. To gauge the level and direction of members’ expectation for the vision of APEC, the Declaration documents can be a natural stating point to analyze in that it is the outcome of the highest-level meeting of APEC, which condenses the views of every member economy. Each Declaration is a consensus document prepared by all member states, which means that even if the themes covered in each document vary by year, the authorship consistency is kept in that they are written by the same co-authors over time. Therefore, their basic features reflect member economies’ relationship to the forum to some extent. Nevertheless, the amount of information from the documents may be limited to draw a complete picture. To overcome this, I use various text mining techniques to extract their core features from multiple angles.
The main findings are as follows. First, in terms of members’ level of interests or expectations about APEC, the forum has had two major waves over the past 30 years, and there are signs of a third wave coming. The first wave was in a relatively positive atmosphere, while the second wave lasted relatively longer but showed patterns of rising and falling member interest in a somewhat negative atmosphere. Second, through an analysis of document similarity changes conducted to examine how consistent APEC is as a forum on certain themes, it was found that although consistency decreased during several times such as during the periods the Asian financial crisis or the failure of WTO DDA negotiations, it generally maintained a high level of consistency. However, this consistency appears to be seriously weakening since 2017. Lastly, regarding the mention of the vision for regional integration, although the initial enthusiasm cooled down quickly, it was found that interest continued through ups and downs along with the schedule of Bogor's goals. However, interest in this vision has also been declining since 2017.
Research on APEC have largely focused on APEC members as a sample rather than on APEC itself. They typically investigate the impact of a certain event on the economies of APEC members. For example, the effect of financial development on economic growth (Tang, 2006), economic and population growth on CO2 emissions (Lee and Oh, 2006), the effects of a certain clause in regional trade agreements (Park and Park, 2016). Research on APEC itself can be divided into two categories: research on the relationship between APEC and other fora such as WTO, TPP, RCEP, etc. (e.g., Park et al., 2021) and research on the characteristics of APEC. This study falls into the latter. Among a literature that focuses on the characteristics of APEC itself, Choi and Heo (2022) calculate the regulatory distance between APEC members to analyze the impact of regulatory heterogeneity on trade among members. Suh (2017) investigates the impact of APEC’s feature as a soft-law international forum on trade liberalization negotiations on environmental goods.
What distinguishes this study from previous studies that focus on these characteristics of APEC itself is that I derive the characteristics of APEC through a direct analysis of the documents produced by the forum itself. This study utilizes text mining techniques to derive the changes and characteristics of APEC by analyzing the Leaders’ Declaration documents, which is the outcome of the APEC Summit, the highest body of APEC. Suh (2020) conducted an analysis of APEC’s characteristics using text mining techniques applied to FTA agreements signed by APEC members but the documents he analyzed are not produced by the APEC forum itself. The closest related study to this paper is Lagria and Quismorio (2022). They also use documents produced by APEC and analyzed with text mining techniques. Besides Leaders’ Declarations, they also cover documents from annual ministerial meetings, senior officials’ meetings, and project proposals. Their research focuses on categorizing the topics covered by APEC using a topic model and who proposed projects on which topics. In contrast, this study focuses on a specific and fundamental question from multiple dimensions. I investigate how APEC members’ interests and expectations regarding regional integration vision, the most fundamental goal of APEC, are changing over time.
This paper is structured as follows. Section II provides a general background on the APEC Leaders’ Meeting and the characteristics of the Summit Declaration, which is the main object of analysis in this study. Section III examines the evolution of APEC members' overall engagement with APEC, while Section IV delves into the shift in attitudes towards APEC at an individual member level. And section V concludes.
II. Background of APEC Summit
This section provides some general background on the APEC Summit and its outcome document, the Leaders’ Declaration, as well as some caveats for interpreting the results.
The idea for APEC was first publicly announced in a speech by former Australian Prime Minister Bob Hawke in Seoul, South Korea on January 31, 1989. Then, on November 6, 1989, the APEC meeting was firstly held in Canberra, Australia, as a ministerial-level meeting, with the 12 founding members being Australia, Brunei, Canada, Indonesia, Japan, Korea, Malaysia, New Zealand, Philippines, Singapore, Thailand, and the United States. After a preparatory period from 1989 to 1992, a summit-level meeting, the annual APEC Economic Leaders’ Meeting, was created in 1993 at the initiative of the United States and has been held ever since. Between 1993 and 2023, a total of 31 summits were theoretically possible, but in 2019, when Chile was the host member, the summit was canceled due to its domestic situation, resulting in a total of 30 summits. Of these, 2020 and 2021 were held online due to the COVID-19 pandemic, resulting in a total of 28 face-to-face summit meetings. For the analysis, I do not separately consider whether a meeting was face-to-face or not but utilize the text of the APEC Leaders’ Declarations resulting from all 31 summits.
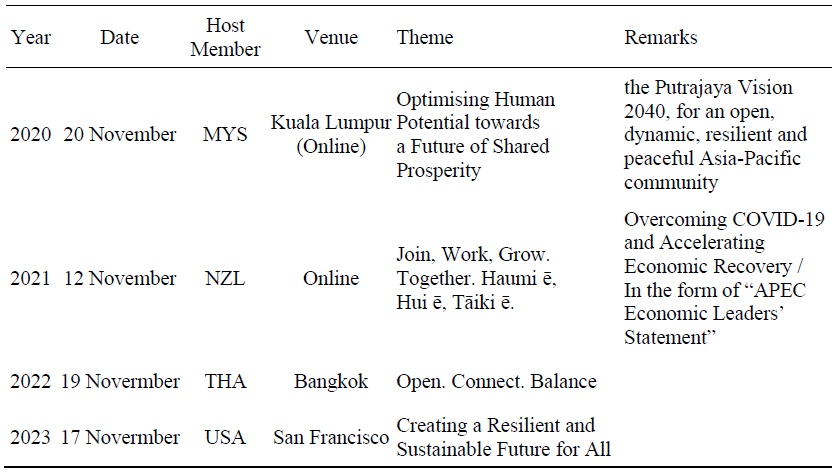
There are three points to note about the Declaration texts. First, the 2018 meeting was held at a time when the conflict between the United States and China was in full swing, so there was no consensus on the text and the meeting ended in the form of a Chairman's Statement. Second, the 2019 Summit was canceled due to the host member's domestic situation and the Leaders’ Declaration was replaced by a statement from the host economic leader. Third, in 2021, when the COVID-19 pandemic was at its peak, besides Leaders’ Declaration, the summit also produced a statement on “Overcoming COVID-19 and Accelerating Economic Recovery” in June before the regular Summit meeting in November. While these features are considered when interpreting the results, by default, I analyze one outcome for each of the 31 summits uploaded to the APEC website under the title
Another significant aspect to consider when discussing the APEC Summit is the timing of the formation of its membership. APEC initially comprised 12 members in 1989 and expanded to an international forum of 18 members after the addition of China, Hong Kong, and Chinese Taipei in 1991, followed by Mexico and Papua New Guinea in 1993. Since the inception of summit-level meetings, Chile joined in 1994. Later, Peru, Russia, and Vietnam joined in 1998, bringing the total number of members in the Asia-Pacific community to 21.
There are a few other things to keep in mind when interpreting the results. First, APEC’s vision of regional integration was embodied in the “Bogor Goals” set at the 1994 Bogor Summit, with “free and open trade and investment in the Asia-Pacific by 2010 for industrialized economies and 2020 for developing economies”. The ideal of trade and investment liberalization in regional integration was made concrete with the term FTAAP (the Free Trade Area of the Asia-Pacific) at the Santiago Summit in 2004 and has been followed ever since. Meanwhile, the Bogor Goals have been superseded by the Putrajaya Vision 2040, which was adopted at the Kuala Lumpur Summit in 2020.
The 2020 Summit was scheduled to take place in Kuala Lumpur, but due to the COVID-19 pandemic, it was instead held virtually. The November 2021 Summit, hosted by New Zealand, was also held virtually due to the pandemic but the venue city was not specified. However, when the summits announced their “Leaders' Statement on Overcoming COVID-19 and Accelerating Economic Recovery” in July of the same year, Wellington was listed as the venue instead. More details about the venues, topics, and key features of each Summit meeting are summarized in Table A1.2
1)
2)For more information on the specifics of each meeting, please refer to
III. Trends in Member-wide Expectation for APEC
To explore the evolution of interest or expectation for APEC across members, this section focuses on the following features of the Declaration texts: (1) length of document, (2) sentiment in document, and (3) average similarity across documents. Furthermore, I examine how regional integration appeared in the Declaration to see how members’ interest in APEC as a regional integration forum has changed.
1. How Have Member Expectations and Sentiments for APEC Evolved?
It’s hard to expect heads of state to get together and have lengthy conclusions as a result of unnecessarily long discussions in a forum when they have low expectations for the forum. In this respect, it is likely that, other things being equal, the length of the Leaders’ Declaration was higher in years when members’ expectations or interest in APEC were relatively higher than in other years. This approach is in line with research on the life cycle of international organizations (e.g., Eilstrup-Sangiovanni, 2021; Debre and Dijkstra, 2023), which deals with how international organizations are established, grow, and then perish.
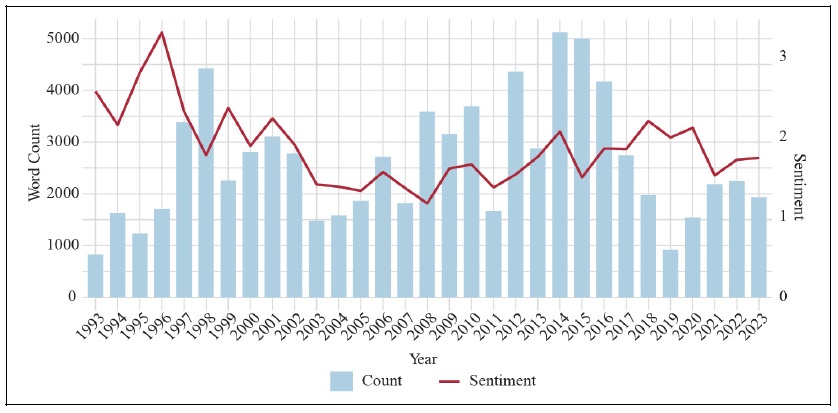
The bar graph in Figure 1 below shows how the length of each Declaration has changed over the years. The length of the document was measured by the number of words it contained. As shown on the left axis, the shortest was the 1993 Leaders’ Declaration on Blake Island, United States, the year the Summit began, at 819 words, and the longest was the 2014 Declaration on Beijing, China, more than six times as long, at 4,997 words. Roughly three waves in term of members’ expectation for APEC are observed. The first wave peaks in 1997 and begins to decline in 2002. The second wave peaks in 2003, rises through 2014, and declines through 2017. Finally, the third wave is on the rise, starting with a low in 2019.
The first wave was the period when APEC was established in 1994, when the “Bogor Goals” were set to achieve trade and investment liberalization and the motivation for the 1996 theme, “From Vision to Action,” was growing. Following the 1997 Asian Financial Crisis, a sense of crisis in the region led to themes such as “Strengthening the Foundations for Growth” in 1998 and “The Auckland Challenge” in 1999. The second wave began in 2003, when the Doha Development Agenda (DDA) negotiations were in full swing at the WTO, and ended in 2007, when the negotiations were finally suspended due to difficulties in the negotiations and the global commitment to economic integration through the multilateral system took a downturn. There was a major drop at the 2011 Honolulu Summit hosted by the United States, just after the deadline for the Bogor Goals, but overall, this period can be seen as a time when various opinions were reflected in the declaration as active free trade agreements were carried out among regional economies under the vision of the Bogor Goals and FTAAP, a free trade agreement covering all APEC member economies. The second wave experienced a sharp decline from 2017, reaching a low point in 2019, which coincided with the rise of the Trump administration in the US and the intensification of the US-China conflict, making it uncomfortable for members to cooperate through APEC. In particular, in 2018, for the first time, members were unable to agree on a declaration, resulting in a “Chair’s Statement” as the summit’s outcome. The second-shortest outcome in history, in 2019, although it should be noted that the summit was canceled due to the domestic situation of the host economy, Chile, and replaced with a “Host Economy Leader's Statement,” which basically reflects the lowered expectations for APEC. It is positive to note that despite the two virtual summits in 2020 and 2021 due to the COVID-19 pandemic, there has been a gradual return to increasing expectation, a precursor of the beginning of the third wave. But it still not enough to reach the average level of the most active second wave.
To examine the trend from another dimension of the document, I also look at the change in sentiment of the document, represented by the solid line in Figure 1. To quantify the sentiment level of the declaration, among the sentiment analysis techniques in text mining, I use the
Negative or positive language in a declaration is not only a reflection of how members feel about APEC itself, but can also be reflection of the economic situation at the time or specific events. Therefore, the length of the document and the level of sentiment should be interpreted in conjunction with each other to gauge the level of interest and expectations that members had for APEC in the context of their attitudes toward APEC’s internal and external circumstances at the time.
2. How Consistent Has APEC Been as a Forum for Addressing Certain Issues?
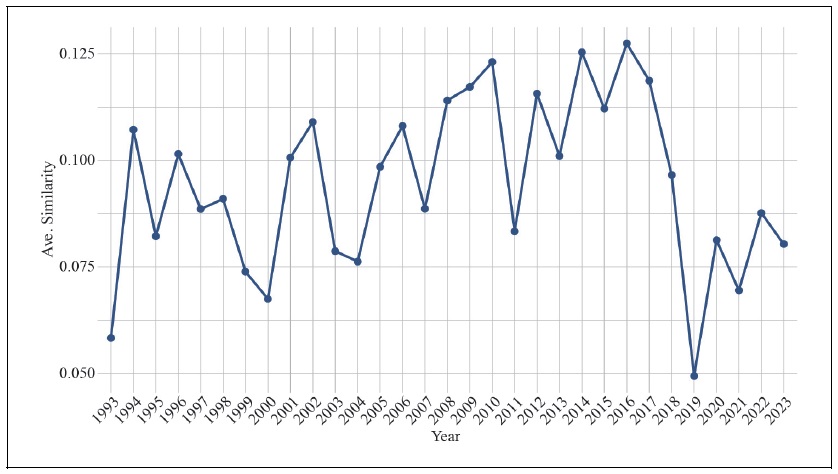
To investigate how consistent APEC has served as a forum for certain issues, I look at the degree of similarity in the content of the declarations. The more consistent the issues covered, the more similar each document is expected to be to other documents. To calculate the text similarity, I use the concept of
To do this, the words in each document are tokenized and represented as a vector using the frequency of occurrence of the words. That is, the document is converted into a vector of the frequency of occurrence of the words. Then, the similarity is measured by calculating the cosine angle between two vectors, the product of the vectors divided by their magnitude. And the similarity is the value of the vectors normalized by the size of each vector, where the closer it is to 1, the more similar it is. Cosine similarity has the advantage that it is not affected by the length of the documents because it is a measure of the angle between them.
Figure 2 shows the average similarity of Declarations across years by calculating the pairwise similarity of one declaration to another and then averaging them.
With the exception of 2019, which took the form of a Chairman’s Statement rather than a Summit Declaration, the lowest average similarity was for the 1995 Osaka Declaration and the highest for the 2017 Da Nang Declaration. Since 1995, the average similarity level has generally remained constantly high although there have been ups and downs in response to the Asian financial crisis and skepticism about multilateralism invoked by the stalled WTO DDA negotiations. That is, the level of similarity declined between 1997 and 1999, following the Asian financial crisis, and then recovered to its previous level; it declined significantly again at the Fifth WTO Cancun Ministerial in 2003, when the WTO DDA negotiations were under mid-term review; and it rose again, only to decline again in 2007, when the DDA negotiations officially stalled. Since then, with the exception of one significant drop at the 2011 Honolulu Summit, APEC has been a consistent forum for addressing certain issues. However, since 2017, there has been a pattern of significantly lower similarity, partly due to the impact of the coronavirus pandemic, but also due to the blurring of its identity as an international forum for regional integration due to the US-China hegemonic rivalry. Recently, similarity has rebounded to a certain level, but it is still far below the average level of the past.
In interpreting the changes in the average similarity of the declarations, it is notable that the decrease in similarity can also be interpreted as addition of innovative elements into the forum, which may reflect the need to change the focus and role of the forum according to the different global economic conditions. For example, the drop in similarity in 2003 can be attributed to the introduction of “Health Security Initiative” to help the region prevent and respond to health threats,
3. How Has APEC’s Attention to Regional Integration Changed?
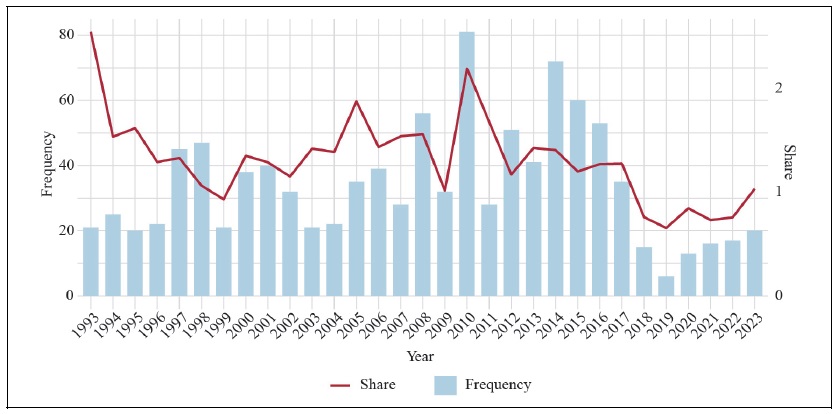
APEC is an international forum that was founded with the vision of regional economic integration in the Asia-Pacific region. One way to gauge the extent to which a forum has remained focused on its original vision is to look at the frequency of terms related to the vision in its highest-level body. Figure 3 shows how often keywords related to regional integration were mentioned in the APEC Leaders’ Declarations by year.
To calculate the frequency of keywords related to regional integration, I use stemmed words and include the terms “region” and “integrat,” which are directly related to regional integration, while adding “communit,” “pacific,” “common,” and “goal” to reflect the terms related to identity of the Asia-Pacific community as a group with common goals.
The gray bar graph shows the absolute frequency of the keywords. To account for the fact that longer documents may increase the probability of a word occurring, I simultaneously consider the proportion of the total document length in which the keywords occurred. The blue solid line shows the percentage of frequency of the term in those documents.
With the exception of the early years of the APEC Summit, the patterns of absolute frequency and relative share are largely consistent. The pattern is that the highest share of regional integration was recorded in 1993, the year of the first summit, when APEC’s founding objectives were clear, followed by a decline, then an overall increase to a peak in 2010, followed by a decline. The two peaks in the middle, in 2005 and 2010, occurred at the Busan Summit in 2005, when the mid-term stock-take of progress toward the Bogor Goals were announced, and at the Yokohama Summit in 2010, when the progress towards the Bogor Goals assessment was completed. Notably, there was a slight but not significant rebound at the Kuala Lumpur Summit in 2020, when Putrajaya Vision 2040 was adopted, and a more recent rebound at the San Francisco Summit in 2023, which will be interesting to follow.
To scrutinize mentions on regional integration vision in Declarations more closely, I look at how often and in where more specific expressions of regional integration, the Bogor Goals and FTAAP, are mentioned in each document. This is visualized in the lexical dispersion plots in Figures 4-1 and 4-2 below.
As expected, the term “bogor” was firstly mentioned in the 1994 Bogor Declaration, where the Bogor Goals were first set. And it usually appears at the beginning of the document as a reference to a common goal the forum shares. Afterwards, it appeared repeatedly throughout the documents at the 2001 Shanghai Summit, but was not mentioned once in the 2007 Sydney Summit Declaration.
It reappeared repeatedly in the 2010 Yokohama Summit which completed the assessment of progress towards the Bogor Goals, and later in the 2014 Beijing Summit, where it was refined to the point of being used many times in one specific section, but gradually became less frequent, until it finally disappeared from the APEC Declaration at the 2020 when was the Bogor Goal due and replaced with the Putrajaya Vision 2040.
Another key term related to APEC regional integration is the Free Trade Area of the Asia-Pacific (FTAAP). It is a concept that first emerged at the Santiago Summit in 2004 at the suggestion of ABAC (APEC Business Advisory Council) and refers to a vision of a free trade area involving all APEC member economies to achieve the Bogor Goals.
Since FTAAP is also represented by either the acronym “ftaap” or the full name “Free Trade Area of the Asia-Pacific,” it requires to use tokens for consecutive terms as well as single terms. In text mining, such tokens are referred to as
3)For more details for LSD, see
IV. Trends in Individual Member Expectations for APEC
In this section, I consider three different aspects to investigate how and how much individual member economies have developed their interests in and expectations of APEC. Those three are (1) host frequency of meetings, (2) declaration clusters by host member, and (3) keyness analysis.
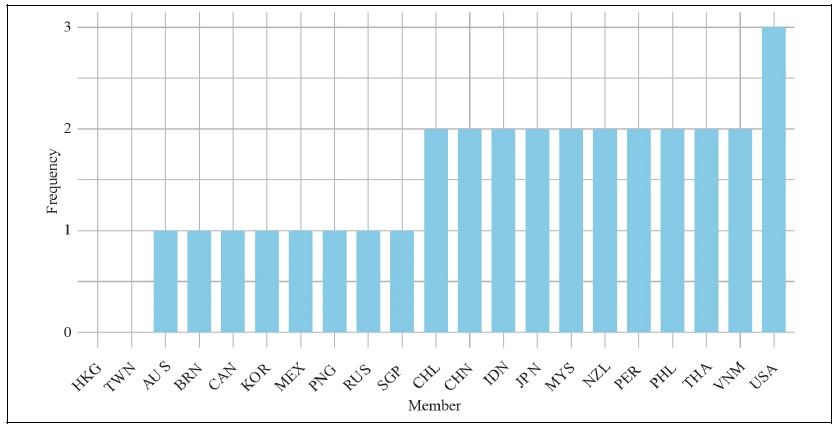
First, consider how often a member state hosts the summit meeting. One of the ways to gauge how interested a member is in a forum is to see who has hosted it and how often. It is unlikely that a member who has low interest or expectations in a forum will host it. Moreover, it is hard to expect that a member who has hosted meetings more often than other members has less interest in the forum. Figure 5 below shows the distribution of summit hosting frequency by APEC member economies.
Over the past 31 hosting opportunities, the United States has hosted most often (three times), while Hong Kong and Chinese Taipei have never hosted. Other than these, all members have hosted at least once or twice almost equally, meaning that APEC is a very evenly participated forum in terms of hosting.
Most of the members who have hosted meetings twice are developing members in Southeast Asia. Among OECD countries, Japan, New Zealand, and Chile hosted twice, while South Korea, Australia, Canada, and Mexico hosted only once. Given that the Santiago Summit was cancelled in 2019, it is reasonable to conclude that Japan and New Zealand have been relatively active among the developed members, at least in terms of hosting. On the other hand, Peru and Vietnam are arguably the two members with the most active interest in APEC, along with the United States, in that they joined the APEC in 1998, after its inception, and have hosted two summits despite having more than 20 percent fewer opportunities to do so than other members. However, it is also notable that host frequency is not only a reflection of members’ interest in APEC, but also of various factors such as host capacity, geopolitical considerations, etc.
Next, consider differences in the clustering of Declarations depending on the location of the summit. A Declaration is a collaborative work written by all members in agreement, but it is also a document that has a lead author rather than every coauthors making equal contributions. As demonstrated by the results of the 2018 Port Moresby Summit and the 2019 Santiago Summit, Leaders’ Declarations are primarily influenced by the host member state. In this regard, the Declaration serves as a means to assess the stance of individual members, particularly that of the host member state, towards APEC.
Figure 6 is a dendrogram showing the distance between Declarations and the clustering relationship between them using the similarity between pairs of texts. The clustering method used in the figure took the following steps. First, construct the distance matrix by calculating the similarity between Declarations, and then generate the initial clusters by considering each data point as a separate cluster. Then find the most similar clusters and measure the distance between them. Combine the two clusters into one. Updating the distance matrix to calculate the distance between new and existing clusters is repeated until all data points are combined into a single cluster. For calculating the distance between two clusters, I used complete linkage, which uses the longest distance among all pairs of distances within the two clusters. The scale of height on the left side of the figure shows the similarity between clusters at the time each cluster is merged.
Among others, the Beijing Declaration of 2014 presents the greatest distance from the other declarations. It is contrast that the Shanghai Declaration of 2001 that China hosted displays a minor disparity from the US Summit Declaration of 1993. The 2023 San Francisco Summit’s declaration, recently led by the United States, presents an even greater separation from the Declarations of the summits that China hosted. While the 1993 U.S.-led declaration was similar to those of summits hosted by Chile and Thailand, among others, and the 2011 declaration was similar to those of Chile and Malaysia, the 2023 San Francisco Declaration moved closer to those hosted by New Zealand and South Korea. While these changes may be due to changes in topics over time, such change in clustering among these declarations also provides some indication of how similarities in interest in APEC are changing across member economies over time. Another observation from the clustering analysis is that repeatedly, the Declarations led by Peru are relatively distant from others while statements led by Malaysia or Vietnam are not distant over time. This is a noteworthy observation, as Peru and Vietnam have been the most active summit hosts, as mentioned earlier.
Lastly, I conduct
The declarations led by the United States predominantly feature terms related to economic and technological advancements, including “digital,” “technology,” “transition,” “privacy,” and “MSMEs” (Micro-, Small and Medium-sized Enterprises). In contrast, the declarations led by China primarily include terms more directly related to development or regional integration, such as “development,” “Asia-Pacific,” and “connectivity.” This is consistent with prevalent views and supports the presumption that the host member holds a prominent position despite the fact that the declaration is a consensus document among all member states. On the other hand, these opposing expectations for APEC from two of the region’s most influential members may provide a hint as to what to watch for in terms of how APEC might be reconciled in the future.5
4)For more discussions for the keyness analysis, see
5)Given that this study looks at economic integration in APEC through the lens of a common vision of FTAAP, I only focus on the conflict between the United States and China to consider the dynamics between members in the region. However, expanding the scope of the study to other topics within APEC, one need to consider more various inter- and intra- regional dynamics. The recent Russia-Ukraine crisis can be an example. I hope that future research will consider a wider range of such dynamics.
V. Concluding Remarks
So far, I examined how APEC’s vision of regional integration has changed from different angles based on the Leaders’ Declarations, which are the outcomes agreed upon by member economies. As we have seen, there have been two major waves of regional integration visions in APEC, with the second wave quickly ebbing away after 2017. While the first wave began with relatively hopeful sentiment and passed through the Asian financial crisis, the second wave was more subdued and saw a consistent buildup of member interest over a longer period of time, before fading rapidly in 2017. While both the level and consistency of member interest reached new lows just prior to the COVID-19 pandemic, these trends have recently rebounded during the pandemic recovery, adding to the potential for the next new wave. This study analyzes the Leaders’ Declaration document to investigate APEC members’ attitudes towards the original purpose of the forum. While it provides some new insights, it has limitations in terms of rigor. For example, more careful interpretation and solid evidence will be required to argue which members support the FTAAP vision more, based on the observation of the weak emphasis on FTAAP in the U.S.-led declaration. Similarly, whether a specific event such as SARS was an actual cause on APEC cooperation will require more in-depth analysis.
Nonetheless, this article adds to the analysis of APEC itself and its policy implications for the future by quantifying the organization’s produced documents and providing quantifiable evidence to conform the prior knowledge rather than relying solely on intuition.
Bergsten (2009), in his article “Pacific Asia and the Asia Pacific: The Choices for APEC,” looked back at the 20 years from 1989 to 2009 and divided the history of APEC into three periods. Formative years (1989-1922), dynamic leadership (1993-1997), marginalization (1998-2008). He emphasized that the challenge for APEC in the third decade was to avoid drawing a line down the middle of the Pacific, and discussed how it could complement other alternative forums, such as the G20 and TPP, to reach its original vision of Asia-Pacific Free Trade Area. This study also provides a retrospective and outlook on the 30 years of APEC since 1993, when APEC summits began, excluding the preparatory period of Bergsten (2009). In the 30th year of APEC, unlike the 20th year of APEC, the question for APEC is not whether the Asia-Pacific will become Pacific-Asia, but how to integrate the Asia-Pacific region under the framework of Indo-Pacific. Whether this is the beginning of a new tide or merely the final surge of a second wave will depend on members’ renewed vision on emerging issues.
Tables & Figures
Figure 1.
Trends in Declaration Length and Sentiment
Source: Author’s calculation.
Figure 2.
Trends in the Average Similarity of Declarations
Source: Author’s calculation.
Figure 3.
Trends in the Frequency of
Source: Author’s calculation.
Figure 4-1.
Changes in Attention to
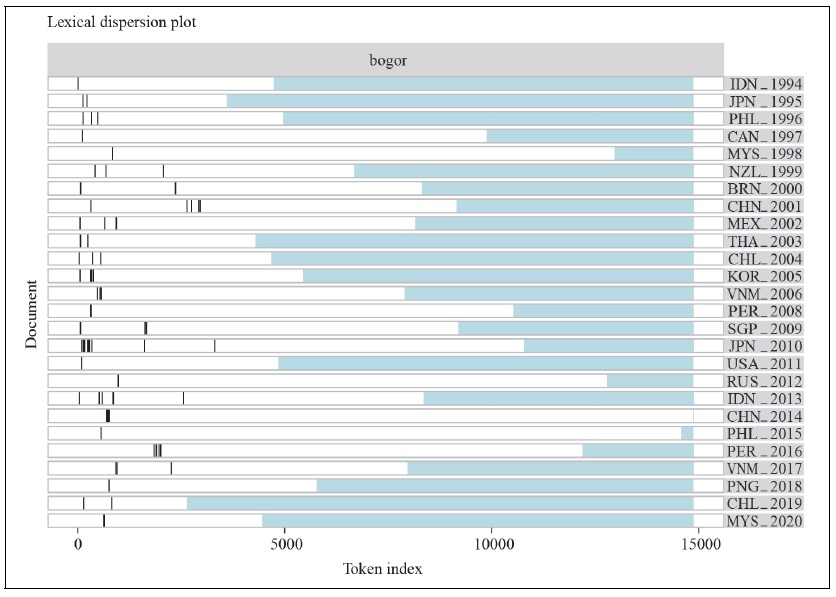
Figure 4-2.
Changes in Attention to
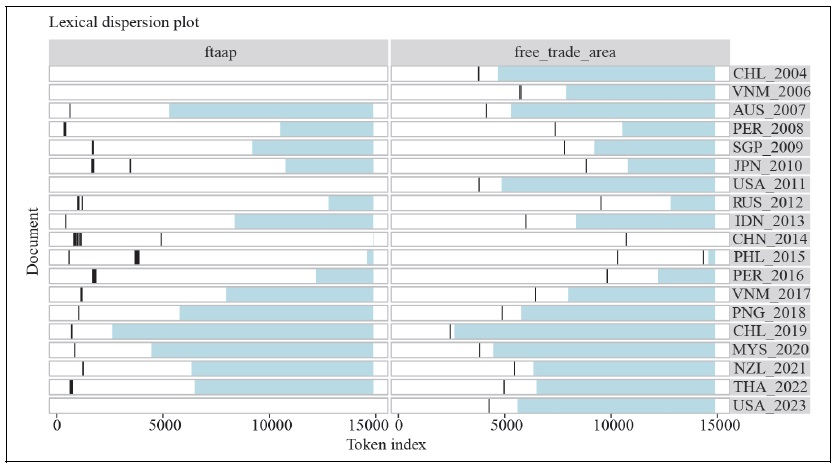
Figure 5.
Host Frequency Distribution by Member State
Source: Author’s calculation.
Figure 6.
Similarity Distance Relationship between Declarations
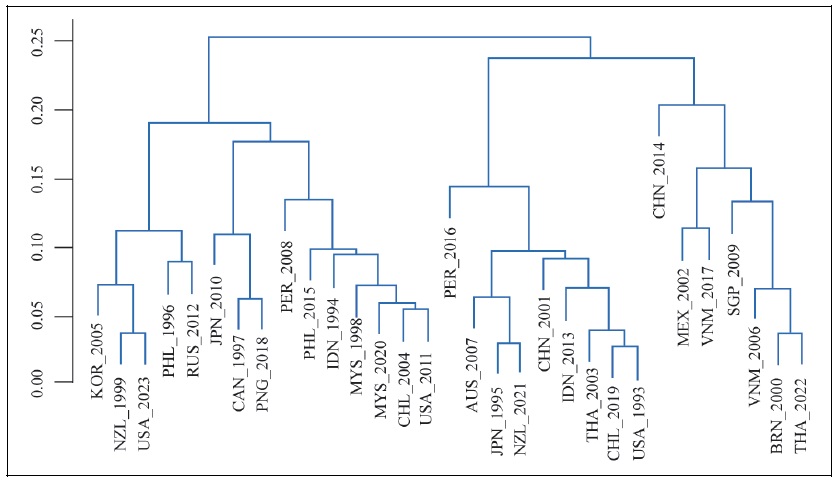
Figure 7.
Defining Terms between Declarations by the United States and China
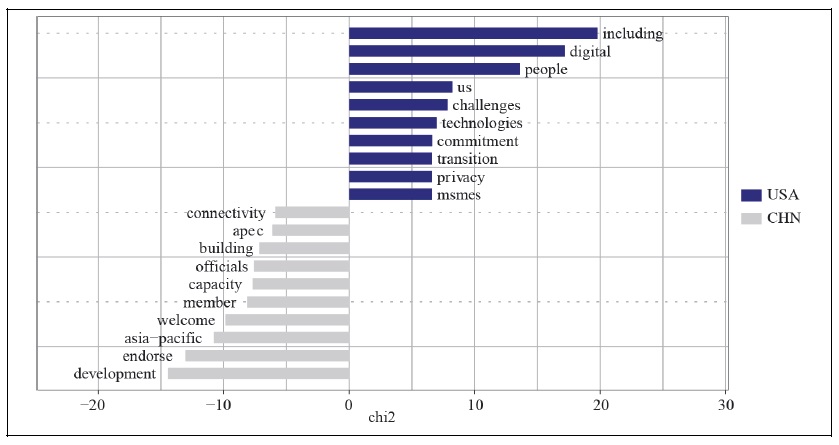
Table A1.
Key Features of APEC Summit Meeting
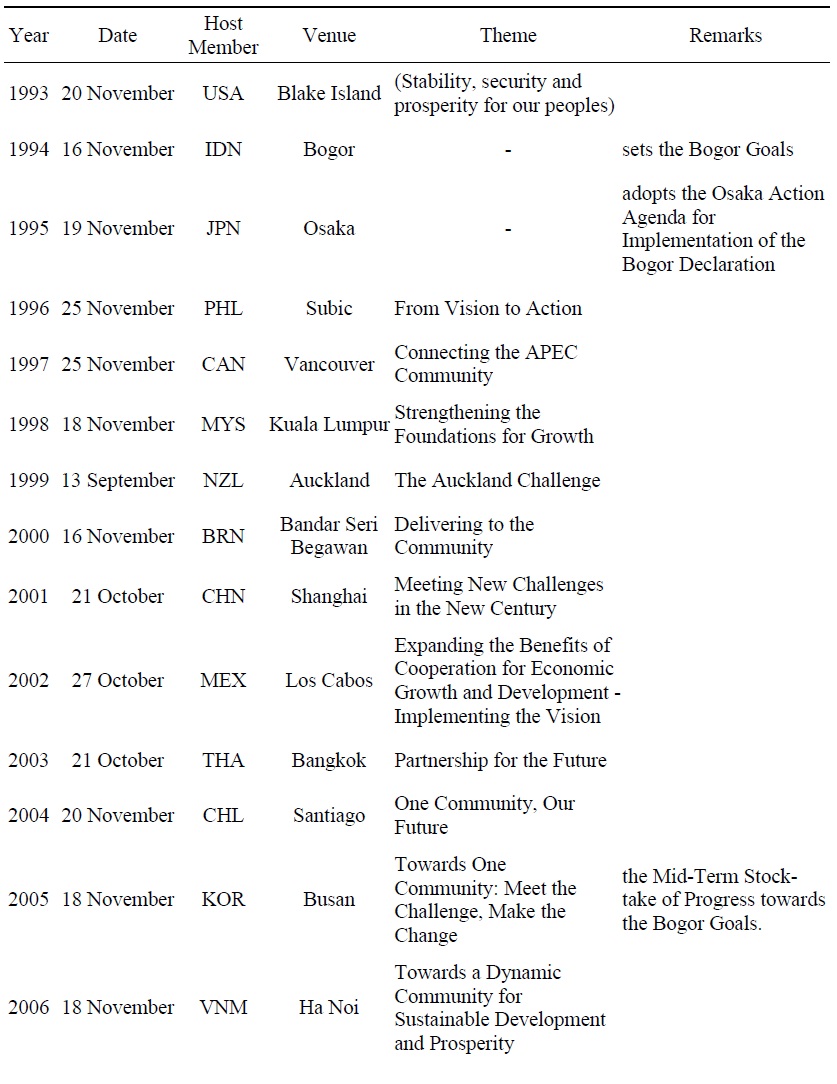
Table A1.
Continued
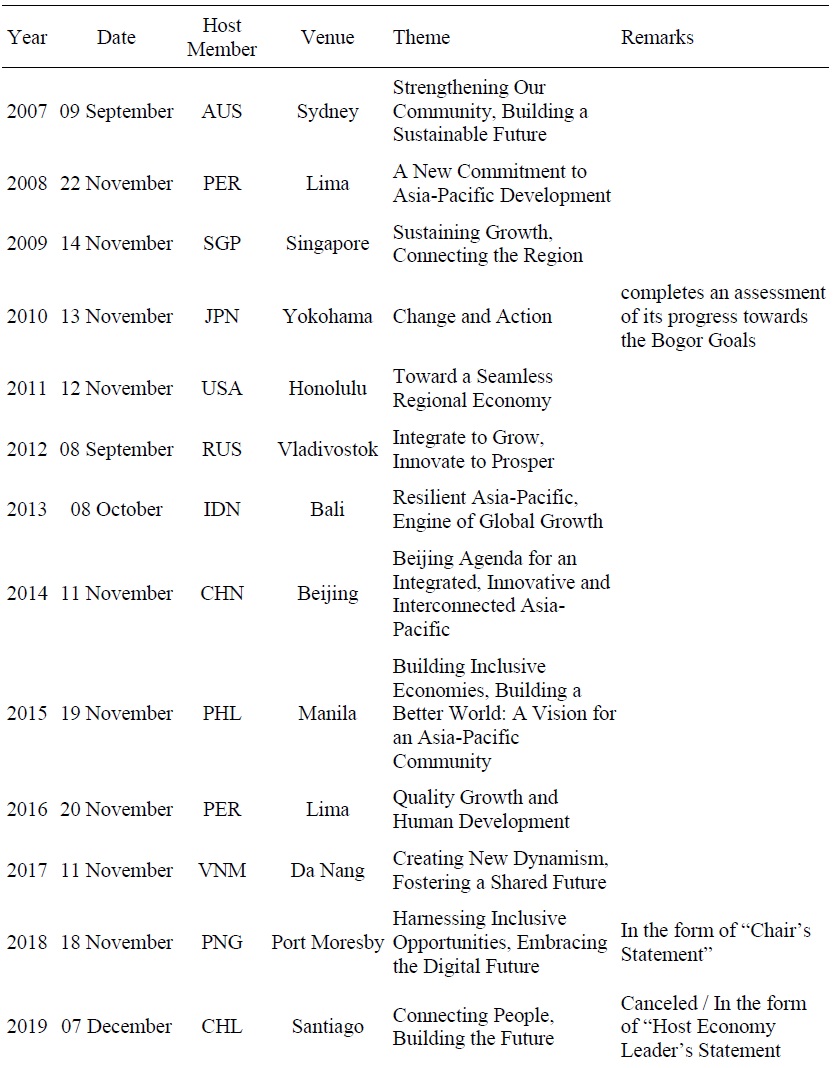
Table A1.
Continued
References
- Bergsten, C. F. 2009. “Pacific Asia and the Asia Pacific: The Choices for APEC.” PIIE Policy Brief, no. PB09-16. Peterson Institute for International Economics.
- Choi, B.-Y. and I. Heo. 2022. “Regulatory Similarity Between APEC Members and its Impact on Trade.” KIEP Apec Study Series, no. 22-02. Korea Institute for International Economic Policy.
-
Debre, M. J. and H. Dijkstra. 2023. “Are international organisations in decline? An absolute and relative perspective on institutional change.”
Global Policy , vol. 14, no. 1, pp. 16-30.
-
Eilstrup-Sangiovanni, M. 2021. “What kills international organisations? When and why international organisations terminate.”
European Journal of International Relations , vol. 27, no. 1, pp. 281-310.
- Lagria, R. F. A. and B. A. Quismorio. 2022. “Analyzing trends in APEC using data analytics.” PIDS Discussion Papers, no. DP 2022-04. Philippine Institute for Development Studies.
-
Lee, K. and W. Oh. 2006. “Analysis of CO2 emissions in APEC countries: a time-series and a cross-sectional decomposition using the log mean Divisia method.”
Energy policy , vol. 34, no. 17, pp. 2779-2787.
-
Park, C.-Y., Petri, P. A. and M. G. Plummer. 2021. “The economics of conflict and cooperation in the Asia-pacific: RCEP, CPTPP and the US-China trade war.”
East Asian economic review , vol. 25, no. 3, pp. 233-272.
-
Park, I. and S. Park. 2016. “Trade facilitation provisions in regional trade agreements: discriminatory or non-discriminatory?”
East Asian Economic Review , vol. 20, no. 4, pp. 447-467.
-
Sönning, L. 2023. “Evaluation of keyness metrics: performance and reliability.”
Corpus Linguistics and Linguistic Theory . -
Suh, J. 2017. “Trade Negotiation under International Soft Law: A Case of APEC Environmental Goods List.”
Journal of International Trade and Industry Studies . vol. 22, no. 4, pp. 31-51. (in Korean) - Suh, J. 2020. “Measuring Convergences and Divergences in APEC RTAs/FTAs: a textmining approach.” KIEP APEC Study Series, no. 20-02. Korea Institute for International Economic Policy.
-
Tang, D. 2006. “The effect of financial development on economic growth: evidence from the APEC countries, 1981-2000.”
Applied Economics , vol. 38, no. 16, pp. 1889-1904.
-
Young, L. and S. Soroka. 2012. “Affective news: The automated coding of sentiment in political Aptexts.”
Political Communication , vol. 29, no. 2, pp. 205-231.