

- EAER>
- Journal Archive>
- Contents>
- articleView
Contents
Citation
| No | Title |
|---|
Article View
East Asian Economic Review Vol. 27, No. 4, 2023. pp. 347-376.
DOI https://dx.doi.org/10.11644/KIEP.EAER.2023.27.4.428
Number of citation : 0View
46
Download
22
The Effects of Policy Funds on the Investment and Management Stabilization Financing of Small- and Medium-sized Enterprises
|
|
Keimyung University |
|---|---|
|
|
The Bank of Korea |
|
|
Jeonbuk National University |

Abstract
This study empirically examines the impacts of policy funds from three different aspects using data on Daegu city’s local government loans. First, we estimate the influence of policy funds on mitigating financial constraints affecting the investment decisions of Small- and Medium-sized Enterprises (SMEs), yielding inconclusive results indicating no significant discernible effects of policy funds. Second, we scrutinize the ramifications of policy funds on enterprise’s management stability, revealing that these funds contribute to stabilizing the operations of small-scale enterprises. Third, we explore whether policy funds engender an unintended consequence of bolstering distressed enterprises, presenting empirical evidence that suggests a delayed exit of such enterprises.
JEL Classification: G20, G30
Keywords
Policy Funds, SMEs, Investment, Management Stability
I. Introduction
Small and young enterprises often struggle to prove their creditworthiness due to a lack of financial history or collateral (refer to Cressy, 2002; Lerner, 2002). Policy funds are a kind of public financial supports designed to address the failure of private financial intermediation mainly caused by information asymmetry between fund suppliers and demanders. That is, policy funds that are equipped with more comprehensive evaluation mechanisms can more accurately assess and manage these risks (refer to Lerner, 2002).
In addition, policy funds play a crucial role in fostering industries and maintaining market stability. Policy funds often aim to bridge the gap left by private financial institutions, which might be reluctant to lend to certain industries or smaller enterprises due to perceived risks or lower profit margins. By providing financial resources where the market fails, these funds enable industries and businesses that are essential for economic development and innovation but lack access to traditional financing.
However, the effectiveness of policy funds remains a subject of ongoing debate. Insufficient policy funds can lead to a shortage of long-term funds necessary for industrial development, while excessive supply may hinder the development of financial markets by crowding out funds supply from private financial institutions. Policy funds may have contributed to economic growth by aiding enterprises with growth potential but facing difficulties in obtaining funds from the private sector. However, it is possible for policy funds to delay the exit of distressed enterprises and to incur social costs such as corruption, bureaucratization, and pursuit of personal interests. The conflicting relationships in the provision of policy funds underscore the continuous assessment for the effective management of policy funds systems.
This study empirically analyzes the effects of policy funds from three different aspects. First, we estimate the effects of policy funds on relaxing financial constraints on the investment decisions of Small- and medium-sized enterprises (SMEs) in Korea. We also consider how these effects differ across the size and age of enterprises in order to capture the effects of information asymmetry. Second, we scrutinize the ramifications of policy funds on enterprise’s management stability. In general, there are mainly two types of policy funds in Korea. One is designed to promote the investment of SMEs and the other intends to support management stability of SMEs that are temporarily having financial difficulties. Although the proportion of the latter relative to the total amount of public funds is significantly greater than that of the former, studies for estimating the effects of the latter are notably scarce. Finally, we investigate if the latter type of policy funds generates a side effect of increasing the number of financially distressed enterprises and delaying the exit of such enterprises.
For our empirical analysis, we combine data on Daegu city’s local government loans with data from National Information & Credit Evaluation (NICE)’s corporate financial information. Daegu city’s policy funds consist of “Start-up Competitiveness Enhancement Funds (SCEFs)” for supporting equipment and facility investment of SMEs and “Management Stabilization Funds (MSFs)” for supporting working capital of SMEs. Although our study is limited to the case of Daegu city, all regions in Korea face very similar situations to Daegu city as shown in Table 1: the proportion of SMEs is very similar across regions and is stable over time. Further, all local governments mainly have the two types of policy funds like Daegu city. And the policy funds for management stabilization are much greater than those for promoting investment for most regions in Korea.
The results from our empirical analysis indicate that there are no clear effects of the SCEFs on mitigating financial constraints of SMEs. However, the MSFs are found to stabilize the operations of relatively smaller enterprises of the SMEs in our sample. On the other hand, the MSFs which comprise over 90% of the total policy funds in Daegu city tend to delay the exit of marginal enterprises.
There are few papers empirically studying the effects of policy funds. Lerner (2002) proposed the certification hypothesis which emphasizes the role of public loans in relaxing information gaps between funds demanders and suppliers (See also Cressy, 2002). The hypothesis argues that if public institutions could certify that enterprises have a good prospect by providing public funds, the asymmetric information problems between enterprises and private funds suppliers could be relaxed. Hahn et al. (2017) test this hypothesis by examining the effects of policy funds on the financing constraints faced by SMEs using data from the policy loan programmes of the South Korean Small & Medium Business Corporation for the period of 2001-2011. They find that policy funds reduce investment-cash flow sensitivity of SMEs, and are more effective for small and young enterprises who face more severe information asymmetry in the loan approval process. We also follow the approach of Hahn et al. (2017) for estimating the effects of SCEFs on the financial constraints on the investment decisions of SMEs. But our study for estimating the effects of MSFs as well as their side effects is new.
The composition of this paper is as follows. Section II reviews policy funds system in Korea and the status of Daegu city’s policy funds. In particular, the policy funds systems provided to SMEs in the Daegu region are examined. Section III describes empirical models that assess the effects of policy funds. In particular, they assess whether SCEFs alleviate the financial constraints of SMEs and promote their investment. Additionally, they examine whether MSFs actually contribute to improving the stability of enterprise operations and whether there are side effects of delaying the exit of marginal enterprises. Section IV presents the empirical results and Section V concludes.
II. Policy Funds System
1. Policy Funds System in Korea
Policy funds in Korea can be categorized into “narrowly-defined policy funds” where the central and local governments, government-funded institutions, and the Bank of Korea directly provide funds, and “policy-oriented finance” where government-established policy funds institutions such as Korea Development Bank (KDB) and Industrial Bank of Korea (IBK) independently raise funds from the market to achieve policy goals (see Yoon, 2016).
There are three ways to provide policy funds for SMEs in Korea: direct loans, onlending, and interest subsidy loans. Each type of loans differs in terms of the funding source, loan conditions, financial institution's profit structure, and post-management. First, direct loans refer to the situation where public institutions directly lend funds to SMEs without intermediation by financial intermediaries. The costs, risks, and interest income incurred during the lending process are all attributed to the institutions. Direct loans allow public institutions to directly select loan recipients and determine loan amounts and interest rates, providing eligible recipients to obtain funds at low-interest rates as much as possible. Some of the policy funds systems operated by the Korea SMEs and Startups Agency, such as venture composite finance and emergency management stabilization financings, fall into this category.
Second, on-lending involves public institutions indirectly supporting SMEs by utilizing financial intermediaries or credit guarantee institutions. Banks bear the losses incurred during the evaluation and lending process, and in return, they receive handling fees (or interest differentials) from policy institutions. Although on-lending may potentially reduce the likelihood of business recipients obtaining sufficient funds compared to direct loans, recipients are not significantly disadvantaged since public institutions specify loan recipients and interest rates in advance. Most government-financed loan projects are conducted in the form of on-lending. Loan programs like Daegu city government’s SCEFs, Bank of Korea’s financial intermediation support loans, and Korea SMEs and Startups Agency’s policy funds support system operate in this manner.
Third, interest subsidy loans involve public institutions subsidizing interest rates or guarantee fees through cooperative lending, with banks raising capital to provide loans. Terms such as the interest rate ceiling, collateral, loan period, and recipient conditions are determined through contracts between public and private financial institutions. This type of support imposes lending risk on private financial institutions and create an efficient policy funds system that allows private institutions to lend selectively to borrowers who are likely to repay the funds. However, the downside is that interest costs accrued each year through the interest subsidy loans may increase without recovery of principal. Additionally, applicants with insufficient credit ratings may be rejected during the evaluation process, making it difficult to achieve the policy goal.
2. Policy Funds in Daegu City
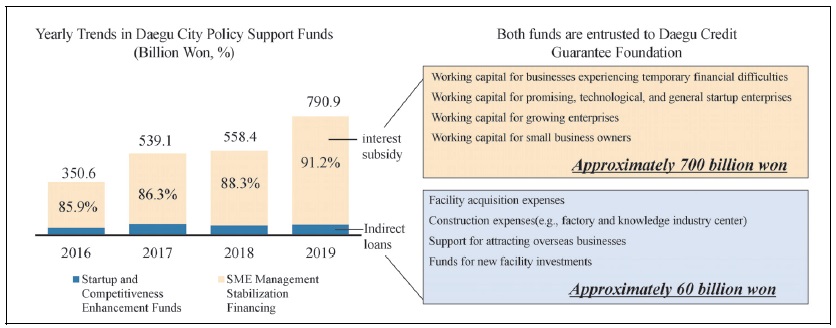
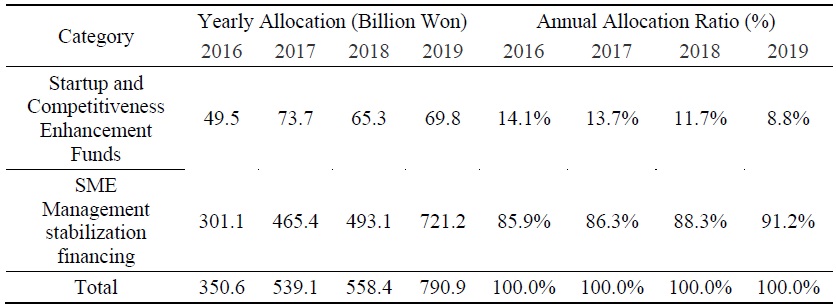
Daegu city has policy funds programs to support small- and medium-sized enterprises (SMEs), including SME SCEFs and MSFs. Firstly, SCEFs are allocated indirectly through the Daegu credit Guarantee Foundation, acting as a trustee, for SMEs with establishments in Daegu, with a limit of 2 billion won per enterprise. These funds are intended for the installation and construction of equipment and factories and are distributed through an on-lending method. Secondly, MSFs provide support through an interest subsidy method with a limit of approximately 1 billion won (0.7 billion won for small business owners) for startups, growing enterprises, and small business owners in Daegu. As of 2019, Daegu city’s policy support funds amounted to 790.9 billion won, with MSFs accounting for 91.2%, while the proportion of SCEFs was only 8.8% (see Table 2).
The provision of these funds is determined through an evaluation by the Daegu Credit Guarantee Foundation, and of course, there are specific industries and conditions eligible for application. Additionally, the decision for a loan is made after an on-site inspection by evaluation agencies such as the Daegu Credit Guarantee Foundation. After the loan is issued, it is verified whether the funds are used in accordance with the loan purpose, such as verifying actual operations with the operational funds received. There is also a clause for the recovery of funds if the loan purpose is not fulfilled. SMEs in Daegu city can apply for both funds as needed. However, when taking out a loan, the total amount of funds from Daegu city, including both funds, cannot exceed 4 billion won. Moreover, if a company has borrowed more than 10 billion won in facility funds through the central government’s loan system over five years, the loan will be restricted.
Daegu city’s policy funds, as shown in Figure 1 and Table 3, increased from the level of 350.6 billion won in 2016 to 790.9 billion won in 2019. However, the increase in policy funds is mainly the result of the expansion of SME MSFs, while SCEFs have been maintained at levels around 60 to 70 billion won since 2017. In other words, Daegu city is expanding the proportion of policy funds using the interest subsidy method for the purpose of economic stability and employment preservation. This fund management strategy is intensifying in crisis situations such as the COVID-19 pandemic. MSFs reached 1.1 trillion won as of June 2020, accounting for approximately 97% of the total policy funds. Considering factors such as the sharp minimum wage increase in 2018 and the impact of the COVID-19 pandemic in 2020, the continuous expansion of MSFs is inevitable. However, this trend carries the risk of delaying the exit of businesses that have reached their limits. Unlike SCEFs, which have a clear goal of equipment and facility investment, MSFs with their nature as working capital present very inclusive criteria for support purposes and beneficiary selection.
III. Empirical Framework
1. Empirical Models
To alleviate financial constraints for SMEs in Daegu, the local government provides support through the SCEFs and MSFs. In this section, we empirically analyze how Daegu city’s policy funds have mitigated the financial challenges faced by local SMEs from three perspectives. First, the SCEFs aim to facilitate funding necessary for the installment and construction of equipment and facilities for eligible SMEs, thereby increasing their investments. On the other hand, the MSFs support the capital needs of businesses experiencing temporary management difficulties, with a focus on working capital loans due to the nature of fund usage. Considering the difference in the nature of these two funds, we develop empirical models to separately analyze how much the SCEFs contribute to easing constraints on financing investment for SMEs and how much the MSFs contribute to the management stability of SMEs. Finally, we develop models to analyze a side-effect of the MSFs.
(1) Empirical models for the effect of SCEFs
If all enterprises have equal access to the capital market, the cost of external funds and the opportunity cost of internal funds become equal, resulting in complete substitution between external and internal funds. In other words, if there is a perfect capital market (i.e., if fund suppliers have perfect information about fund demanders — namely, enterprises), investment decisions are made independent of financial conditions1. However, in the real world, due to factors such as information asymmetry or other reasons, complete substitution between internal and external funds is not possible. Investment decisions are influenced by factors such as the availability of internal funds and the possibility of financing external funds through either new debt or equity issuance. In cases where the capital market is imperfect, the internal cash flow of an enterprise may have a comparative advantage over financing external funds, impacting investment expenditure. This interdependence of investment and financing decisions is particularly prevalent in small or newly established enterprises. For these enterprises, short-run financial factors are crucial because external capitals cannot perfectly substitute internal funds in the short run. On the other hand, larger enterprises with well-known growth prospects are more likely to make investment decisions independent of their financial structure. This difference arises primarily stemming from asymmetric information between fund suppliers and demanders. This information asymmetry makes it costly, and sometimes impossible, for external fund providers to evaluate the investment opportunities of fund demanders accurately.
Lerner (2002) argues that public institutions can mitigate such information gaps by providing policy loans to small and young enterprises with high quality. Hahn et al. (2017) developed an empirical model to test this hypothesis. We develop a similar empirical model to test the hypothesis following Hahn et al. (2017):
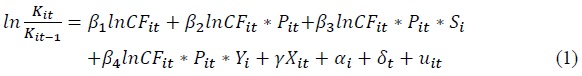
where 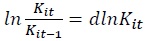 measures the variation in the logarithm of the enterprises
The variable
Next, to explicitly test how policy funds mitigates the impact of information asymmetry, we estimate equation (2) following Hahn et al. (2017):
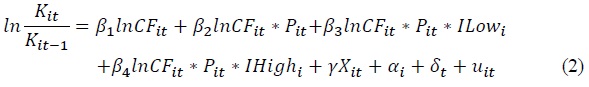
where
Equations (1) and (2) include dummy variables generated using the median values of enterprises size and age to identify information asymmetry. However, economic theory does not provide any information about threshold values that distinguish between larger and smaller enterprises. Moreover, it does not offer insights into threshold values that differentiate enterprises with short and long business experience. Therefore, in empirical analysis, these threshold values are arbitrarily determined. If the results of the analysis are sensitive to these thresholds, the classification could be problematic. Considering this, the following model estimates the interaction between policy funds and enterprises’ cash flow based on continuous variables for enterprises’ size and business experience:
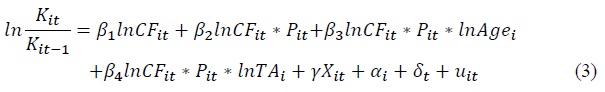
where
Equations (1)-(3) assume a log-log model to estimate the relationship between investment and cash flow. Generally, previous research has estimated the sensitivity of investment and cash flow using linear models. Economic theory does not provide information on whether linear models or log-log models should be used to estimate the relationship between investment and cash flow. In this sense, our empirical analysis will provide additional evidence on the relationship. Another reason for using the log-log model is to obtain estimation results that are less sensitive to outliers. Empirical analyses related to this topic remove outliers that deviate from the realistic standards in data on the ratio of investment to tangible assets (
(2) Empirical models for the effect of MCFs
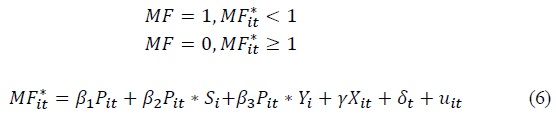
We employ the interest coverage ratio as a variable to measure an enterprise’s management stability.8 The interest coverage ratio is defined as the ratio of operating profit to interest expense, indicating how well operating profit can cover interest costs. If this ratio is less than 1, it signifies that the operating profit cannot cover the interest costs, indicating a significant deterioration in the enterprise’s debt repayment capability. The larger the ratio, the more stable the enterprise’s operational activities. The following model is the baseline model estimating the impact of policy funds on the interest coverage ratio:

where
Similar to equation (1),
To explicitly test how policy funds mitigates the impact of information asymmetry, the following model is used for estimation:

The construction of both
(3) Models for the effects of MCFs on distressed enterprises
We have analyzed the extent to which policy funds in the Daegu region contribute to correcting inefficiencies or market failures caused by information asymmetry between fund demanders and suppliers in the financial market. We now examine a side effect of policy funds. In particular, we investigate whether the MSFs, originally intended to meet the urgent funding needs of enterprises experiencing temporary management difficulties, lead to the creation of marginal enterprises that rely on policy funds to sustain their business activities.
Generally, marginal enterprises refer to enterprises with a high likelihood of exit but are sustained through financial support. In general, such enterprises are defined as those with an interest coverage ratio less than 1 for three consecutive years. However, due to the data availability, we define enterprises as “distressed” if their interest coverage ratio is less than 1 for each year. The following is the basic model estimating the impact of MSFs on the probability of the occurrence of such enterprises:
where  is less than 1 at time
2. Data
For empirical analysis, we constructed an enterprises-level panel dataset by combining data from the city of Daegu and NICE Credit Rating Agency. Daegu city government provided on-lending to SMEs in the region requiring funds for facility improvements and automation equipment investments through the SCEFs. Additionally, Daegu city supported enterprises in urgent need of operating funds, such as securing liquidity, through the MSFs. We received a list of enterprises that obtained loans through these two funds from Daegu city for the period between 2016 and 2018. However, this list only included information about the business registration numbers of the enterprises, loan amounts, and interest rates related to the SCEFs or the MSFs. To conduct empirical analysis, we extracted additional financial statement and income statement data for these enterprises from the NICE Credit Rating Agency’s database. Subsequently, we combined the two datasets using the enterprises’ business registration numbers. The sample period for the dataset created by combining these two databases spans from 2014 to 2018. The sample includes only those enterprises that received policy funds from Daegu city at least once between 2016 and 2018 and for which financial statement data is available. Note that the year of receiving policy funds is different for each enterprise in our samples. We exploit this fact for the DID analysis.
Two samples are utilized in the empirical analysis: Sample 1 comprises enterprises that received loans through the SCEFs from Daegu city between 2016 and 2018, while the other includes enterprises that received loans through the MSFs during the same period.
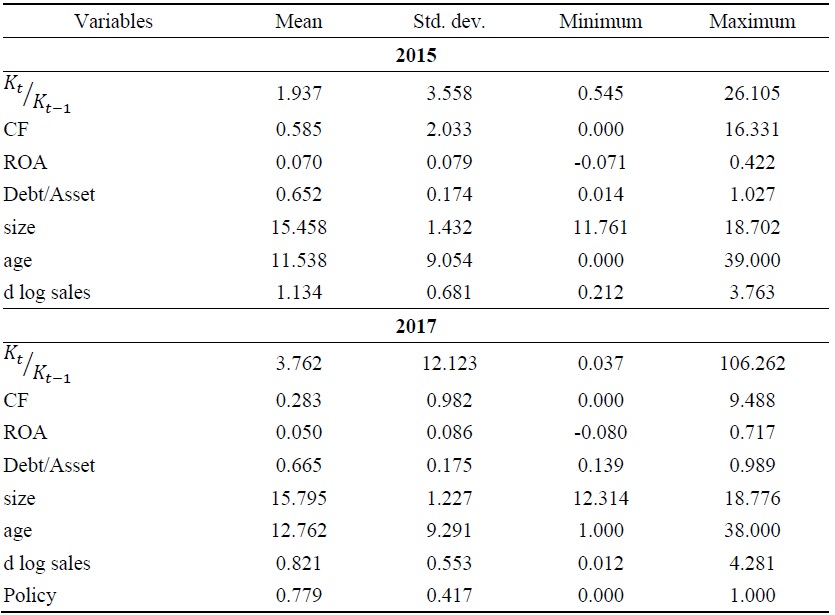
Table 4 presents summary statistics for enterprises in Sample 1 for the years 2015 and 2017. Specifically, the average ratio of cash flow to tangible assets in 2015 is relatively high at 0.585. The average leverage, measured as total debt to total assets in 2015, is 0.652, indicating good financial soundness for the enterprises. However, this may also reflect a situation where external funding is not easily accessible. The average enterprise age in 2015 is 11.54 years, with some enterprises established in that year, and the longest-standing enterprise had been active for 39 years. The average sales growth rate from 2014 to 2015 is remarkably high, with a large standard deviation. The mean ratio of tangible assets in 2017 to tangible assets in 2016, representing the enterprises’ investment, is 3.762 which is much greater than the mean value in 2015. Conversely, cash flow in 2017 experiences a substantial decrease compared to 2015.
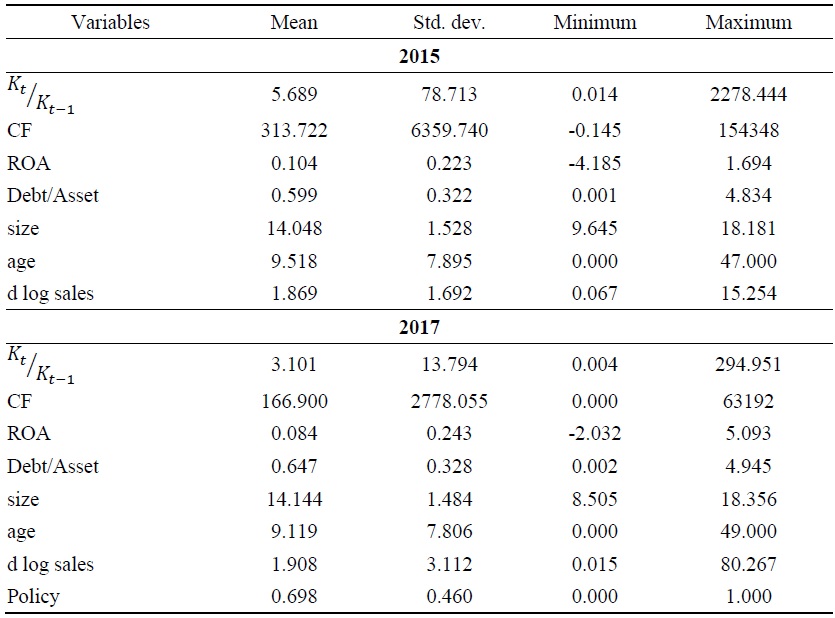
Table 5 shows summary statistics for enterprises in Sample 2 for the same years. Compared to Table 4 with SCEFs sample, variation of the variables is much greater. This is attributed to the fact that the MSFs primarily provided funds to relatively smaller-sized enterprises. Additionally, notable outliers were observed in the ratio of current tangible assets to previous year tangible assets and the ratio of current cash flow to previous year tangible assets.
3. Estimation
We estimate regression equations (1)-(5) using the fixed effects estimation method, which controls for enterprise-specific fixed effects and year fixed effects. Enterprises in each sample received policy funds from Daegu city at least once between 2016 and 2018. However, the sample period extends from 2014 to 2018. Therefore, equations (1)-(3) can identify changes in the relationship between cash flow and investment decisions before and after an enterprise receives policy funds. For example, if an enterprise received policy funds in 2016, the fixed effects model can be used to estimate and compare the relationship between cash flow and investment decisions before receiving policy funds (from 2014 to 2015) and after receiving policy funds (from 2016 to 2018). Similarly, if an enterprise received policy funds for the first time in 2017, the fixed effects model can be used to estimate and compare the relationship between cash flow and investment decisions before receiving policy funds (from 2014 to 2016) and after receiving policy funds (from 2017 to 2018). In this regard, our fixed effects estimation reflects the spirit of the traditional DID approach.
We can estimate equation (6) either a fixed effects or random effects logistic regression method. However, when using a fixed effects logistic regression model, a drawback is that enterprises with a constant value of 1 or 0 for  throughout the sample period are excluded from the estimation. In other words, enterprises with interest coverage ratio less than 1 or greater than 1 all the time throughout the sample period are excluded from the estimation. As approximately 3/4 of the enterprises in the sample satisfy these conditions, using a fixed effects logistic regression model has the drawback of having too few enterprises for estimation. Considering this, we estimate equation (6) using the random effects logistic regression method.
1)Refer to
2)To be specific, the investment of an enterprises (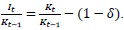 We interpret
  as investment.
3)However, the enterprises’ investment decisions may be sensitive to internal cash flows in an imperfect capital market. According to the pecking order theory proposed by
4)For example,
5)We conduct a robustness analysis by estimating within the range of cash flows used in previous studies, and the results remained unchanged.
6)See, for example,
7)For the robustness of the analysis, linear models are estimated, but the main results remained unchanged.
8)Considering that working capital support in Daegu city is prioritized for enterprises aiming to maintain or sustain employment, the variable of workforce size could be considered as a measure of management stability. However, due to data constraints, the interest coverage ratio is used.
IV. Empirical Results
1. SCEFs and Investment Decision
Table 6 to Table 8 present the results estimated using the fixed effects model for the SCEFs sample, which includes enterprises that received policy funds through SCEFs. Overall, we found that an increase in an enterprise’s cash flow leads to an increase in investment, even after controlling for other impacts on the enterprise’s investment.
This suggests that the enterprise’s investment decision is significantly influenced by its financial structure. Furthermore, we obtained results indicating that the SCEFs from Daegu city do not have a substantial effect on mitigating the sensitivity of investment to cash flow.
Specifically, the estimates for the relationship between an enterprise’s cash flow and its investment are positive and statistically significant at the 1% level in all specifications (see Table 6). However, the estimates for the interaction effect of cash flow and policy funds are close to zero and statistically insignificant, suggesting that SCEFs do not contrinute to reducing the sensitivity of investment to cash flow. Additionally, the estimated coefficient
The sensitivity of cash flow to investment decisions when an enterprise receives policy funds can be measured as the sum of the estimates of
Table 7 shows that SCEFs do not have a significant effect in alleviating financial constraints due to information asymmetry. The estimates of
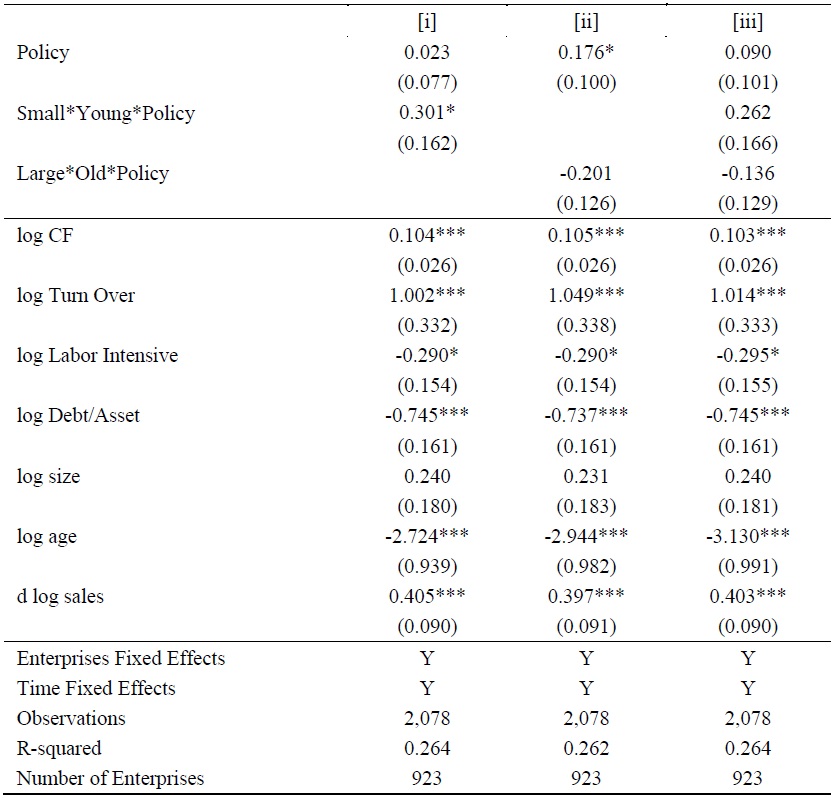
Table 8 presents the estimation results on equation (3) using continuous variables measuring the size and age of enterprises. Overall, the results are qualitatively similar to those in Table 6 and Table 7. Specifically, the estimate of 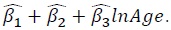 The values calculated by substituting the 1/4, 2/4, and 3/4 quantiles of log enterprise age (
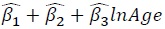 are all positive and statistically significant. (Refer to the F-test results at the bottom of [i]). The estimate of
  can be used to measure the extent to which the sensitivity of cash flow and investment decisions of enterprises receiving policy funds varies with enterprise size. The values calculated by substituting the 1/4, 2/4, and 3/4 quantiles of log enterprise size (
 are all positive and statistically significant. (Refer to the F-test results at the bottom of [ii]). These results confirm the robustness of the findings presented in Table 6 and Table 7.
2. MSFs and Interest Coverage Ratio
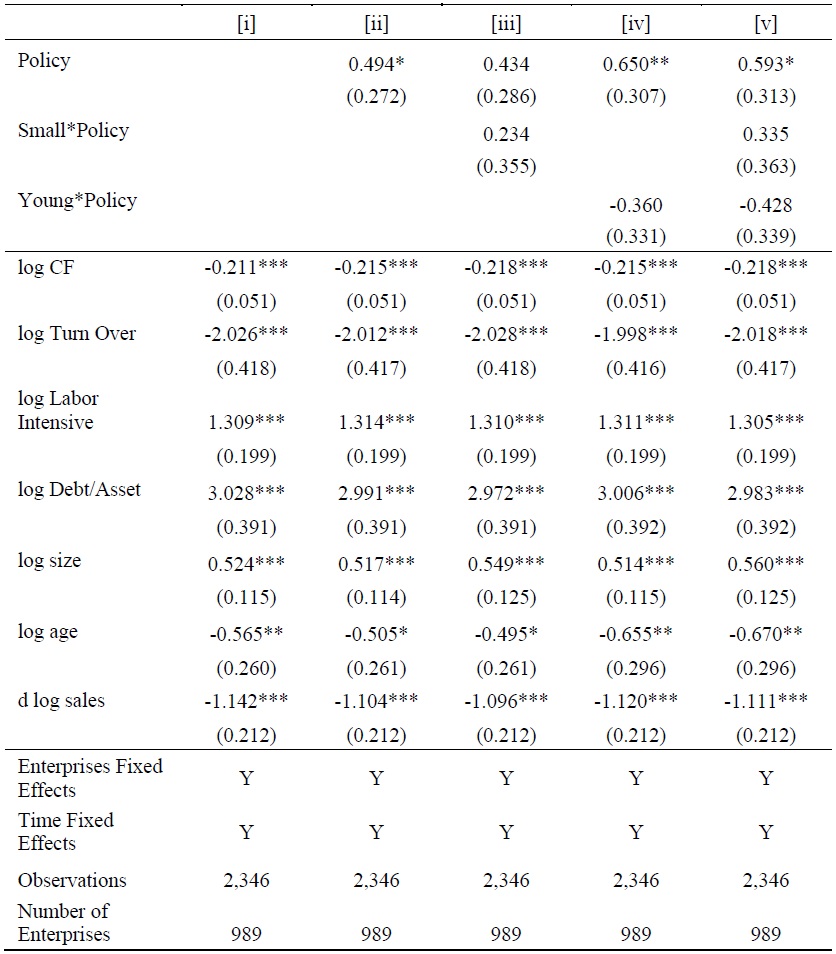
Table 9 and Table 10 present the estimation results using a fixed-effects model for the MSFs sample that include enterprises receiving support from Daegu city’s MSFs. Table 9 shows the results of estimating equation (4), while Table 10 shows the results of estimating equation (5). Overall, we find that MSFs improve the interest coverage ratio of small enterprises (those enterprises with
Specifically, the estimates for the effects of MSFs on the interest coverage ratio are nearly zero and statistically insignificant in all specifications of Table 9. However, the interest coverage ratio for small enterprises receiving MSFs increased by 26.7% compared to non-recipient enterprises, and this estimate is statistically significant at the 5% level (refer to model [iii]). Additionally, although the MSFs improves the interest coverage ratio for young enterprises, the estimate is not statistically significant (refer to models [iv] and [v]). These results suggest that MSFs contribute to enhancing the financial stability of small enterprises.
Overall, the impact of control variables on the interest coverage ratio is consistent with the predictions. In all specifications, an increase in debt relative to assets led to a significant decrease in the interest coverage ratio. For instance, when the debt-to-asset ratio increases by 1%, the interest coverage ratio decreases by 0.729% to 0.750%, and these estimates are statistically significant at the 1% level. This suggests that as debt increases while other factors remain constant, the interest cost rises, leading to a reduction in the enterprise’s debt repayment ability and a potential deterioration in financial stability. We find that the interest coverage ratio improves as the enterprise’s cash flow or sales revenue increases. Additionally, a higher asset turnover ratio, indicating increased capital productivity, is associated with a substantial increase in the interest coverage ratio. For example, in all specifications, a 1% increase in the asset turnover ratio leads to approximately a 1% increase in the interest coverage ratio, and these estimates are statistically significant at the 1% level. Conversely, enterprises with higher labor intensity experience a decrease in the interest coverage ratio. For instance, in all models, a 1% increase in the proportion of labor costs to revenue results in a decrease in the interest coverage ratio by approximately 0.283% to 0.296%, and these estimates are statistically significant at the 10% level. These results indicate that businesses with a relatively high labor intensity may face challenges in maintaining financial stability.
Table 10 presents the estimation results of how much MSFs mitigate the problems due to asymmetric information. Overall, smaller enterprises and young enterprises, which experience relatively more information asymmetry, improved their interest coverage ratios through the support of MSFs (see model [i]). On the other hand, large-scale enterprises and old ones receiving MSFs experienced a decrease in their interest coverage ratios (refer to model [ii]). Model [ii] also indicates that, excluding enterprises with relatively low information asymmetry, MSFs improved the interest coverage ratios of others. These results suggest that MSFs have a positive impact on the interest coverage ratios for small and young enterprises.
3. MSFs and Distressed Enterprises
Table 11 presents the results of estimating the random-effects logistic regression equation (6) using the maximum likelihood method for the MSFs sample. Overall, MSFs have an effect of increasing the probability of enterprises that depend on policy funds to sustain their operation. Specifically, enterprises receiving MSFs have a higher likelihood of becoming distressed enterprises compared to those that do not, and these estimates are statistically significant at the 10% level. Additionally, when small enterprises receive MSFs, there is an increase in the probability of becoming distressed enterprises, although the estimates are not statistically significant.
V. Conclusion
Our study is a rare attempt to empirically assess the effects of policy funds at the enterprise level using local government’s loan data. To do this, we first examine the policy funds system and its current status. Subsequently, our study constructs a panel data based on loan information provided by Daegu city and combining it with corporate financial information from NICE credit rating agency. We then investigate the effects of Daegu city’s SCEFs and MSFs on enterprises’ investment and management stability, respectively. Our empirical analysis shows that SCEFs do not much contribute to alleviating financial constraints of SMEs in the Daegu region. However, MSFs contribute to improving management stabilization of relatively smaller and young enterprises of SMEs. On the other hand, our analysis identifies a potential side effect of MSFs prolonging the survival period of distressed enterprises.
Our empirical analysis is limited to enterprises that received support from Daegu city’s policy funds. Nevertheless, it revitalizes the need for related research and can serve as a reference for future research on regional policy funds operations. In particular, it underscores the need for ongoing evaluations and research on the allocation and effects of regional policy funds in situations when the effectiveness of policy funds is uncertain.
Tables & Figures
Table 1.
Proportion of Small- and Medium-sized Enterprises (%)
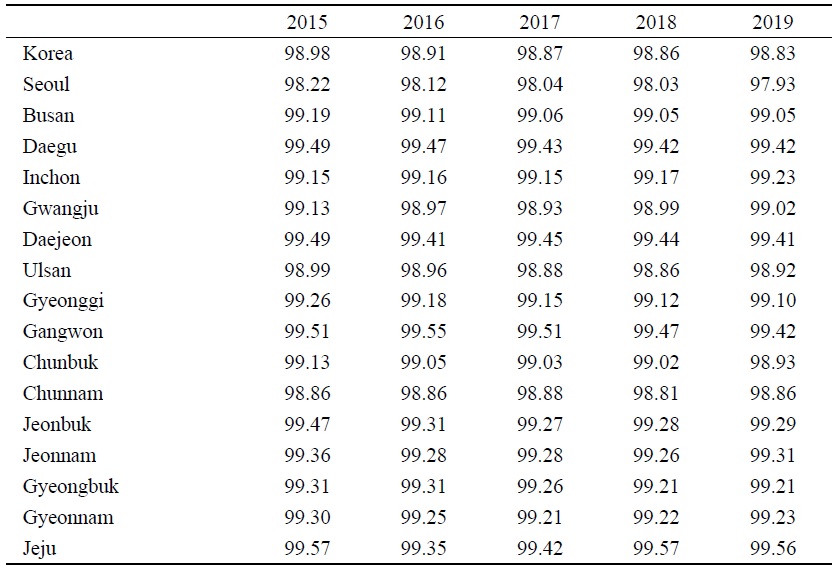
Notes: We calculate the proportions using the numbers of small-sized, medium-sized, large-sized enterprise and excludes the number of micro enterprises for the calculation. SMEs are classified into smallsized and medium-sized enterprises (for small-sized enterprises with an average of annual sales of 1 to 12 billion won or less over the last 3 years, depending on the industry and for medium-sized enterprises with an average of annual sales of 40 to 150 billion won or less over the last 3 years, depending on the industry).
Source:
Table 2.
Status and Proportion of Daegu City’s Policy Funds by Program (2019)
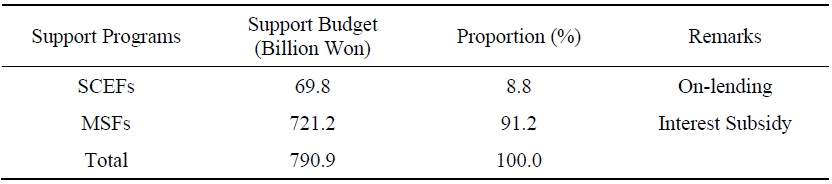
Source: Internal data of Daegu city. Support programs and budget amounts are based on 2019 data.
Figure 1.
Structure of Daegu Metropolitan City’s SMEs Policy Support Funds
Source: Internal data of Daegu city.
Table 3.
Yearly Trends in Daegu City’s SME Policy Support Funds (2016~2019)
Source: Internal data of Daegu city.
Table 4.
Summary Statistics for SECFs
Sources: Daegu city, NICE Credit Rating. Refer to the main text for variable descriptions.
Table 5.
Summary Statistics for MSFs
Sources: Daegu city, NICE Credit Rating. Refer to the main text for variable descriptions.
Table 6.
Impact of SCEFs on Financial Constraints of SMEs
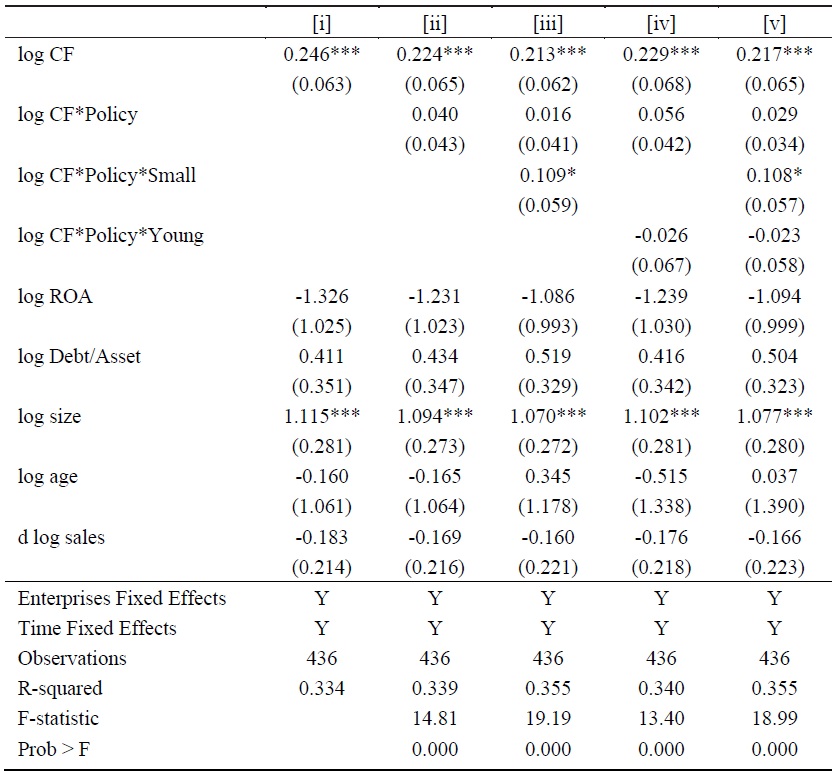
Notes: Refer to the main text for variable explanations. The F-value in [ii] tests the constraint CF + CF * Policy = 0, the F-value in [iii] tests the constraint CF + CF * Policy + CF * Policy * small = 0, the F-value in [iv] tests the constraint CF + CF * Policy + CF * Policy * young = 0, and the F-value in [v] tests the constraint CF + CF * Policy + CF * Policy * small + CF * Policy * young = 0.
Table 7.
SCEFs and Information Asymmetry
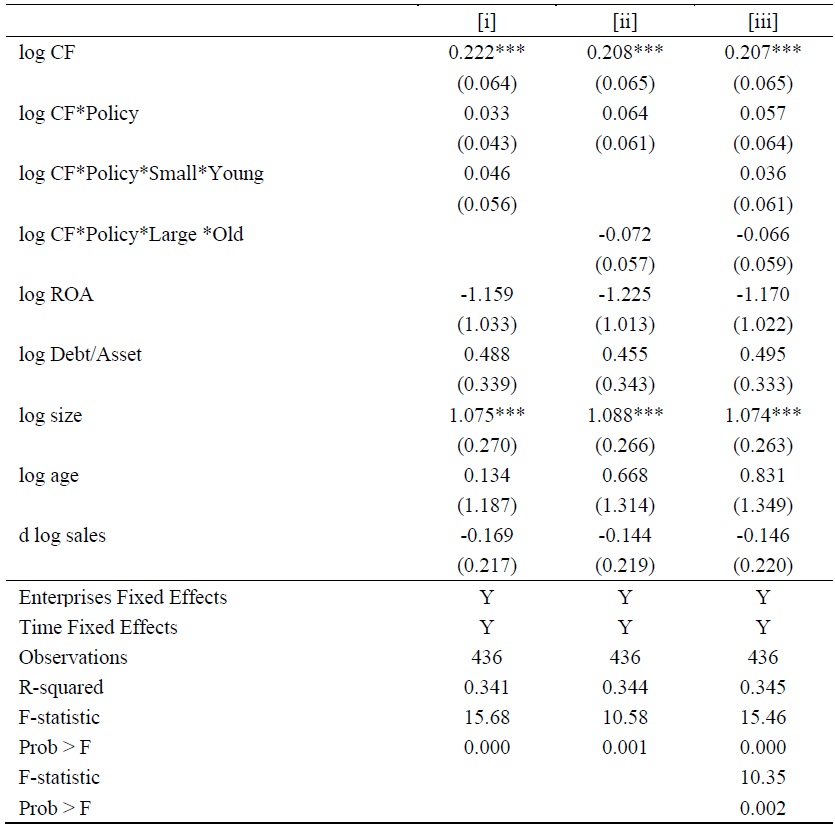
Notes: Refer to the main text for variable explanations. The F-value in [i] tests the constraint CF+CF*Policy + CF*Policy*small*young=0, the F-value in [ii] tests the constraint CF+CF*Policy + CF*Policy*old*large=0, and the two F-values in [iii] test the constraints of [i] and [ii], respectively.
Table 8.
The Impact of SCEFs on Financial Constraints: Continuous Variables
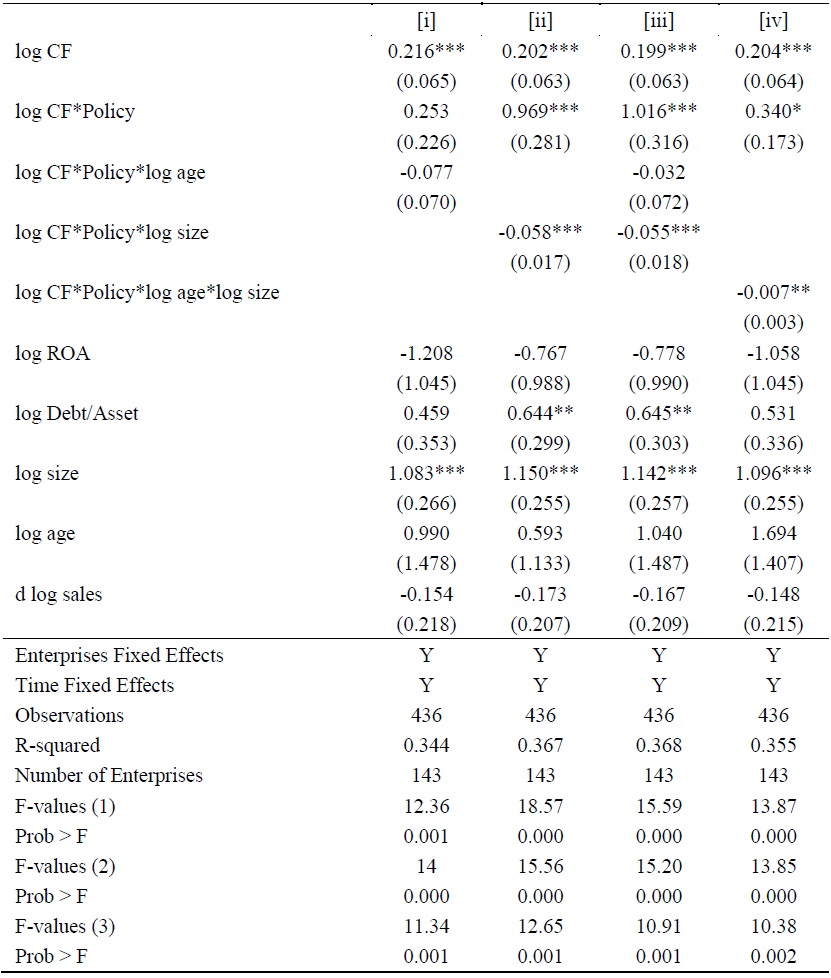
Notes: The four F-tests were conducted for each model. An enterprise’s age values used in the F-tests were 5, 10, 15, and 20 years, while the enterprise’s asset size values were 2.5, 5, 10, and 20 billion won. Model [iii] tests the constraint CF + CF*Policy + CF*Policy*log age + CF*Policy*log size = 0, and model [iv] tests the constraint CF + CF*Policy + CF*Policy*log age*log size = 0. Models [iii] and [iv] utilize the enterprise's age values and asset size from models [i] and [ii] in their respective Ftests.
Table 9.
The Impact of MSFs on the Interest Coverage Ratio of SMEs
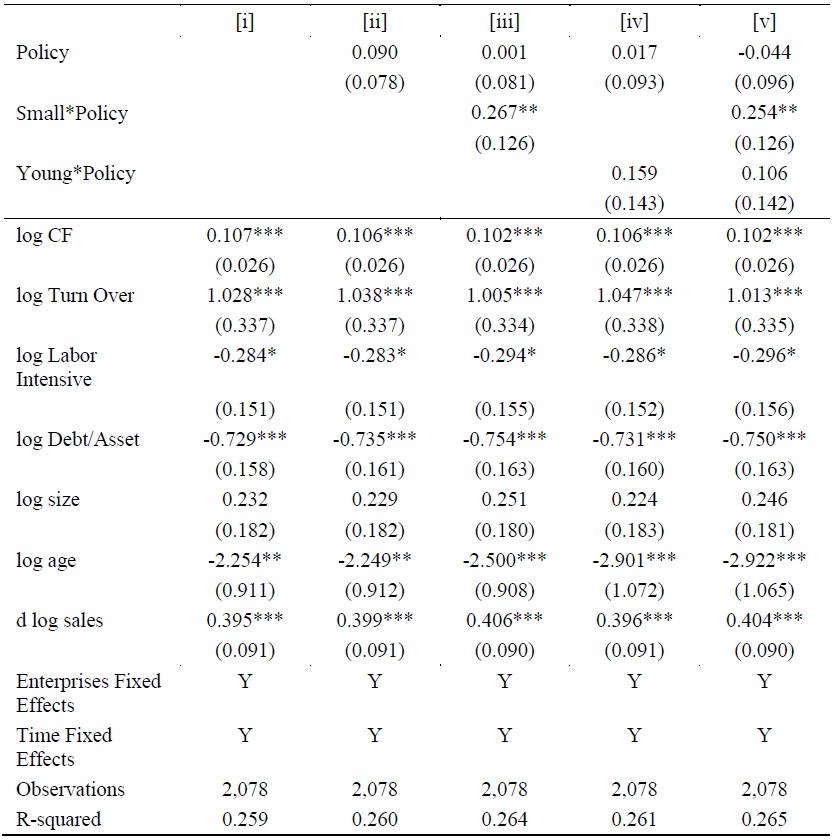
Sources: Daegu city and NICE Credit Rating.
Table 10.
The Impact of MSFs on ICR for SMEs (Information Asymmetry)
Notes: Refer to the main text for variable explanations.
Table 11.
The Impact of MSFs on the Probability of Distressed Enterprise Occurrence
Note: The equation (6) is estimated using a logistic regression model with random effects. Refer to the main text for variable explanations.
References
-
Cressy, R. 2002. “Introduction: Funding Gaps.”
Economic Journal , vol 112, pp. F1-F16.
-
Fazzari, S. M., Hubbard, R. G., Petersen, B. C., Blinder, A. S. and J. M. Poterba. 1988. “Financing Constraints and Corporate Investment.”
Brookings Papers on Economic Activity , vol. 1988, no. 1, pp. 141-206.
-
Forbes, K. J. 2007. “One cost of the Chilean capital controls: increased financial constraints for smaller trade enterprises.”
Journal of International Economics , vol. 71, no. 2, pp. 294-323.
-
Hahn, S. B., Kwon, S. and J. Yun. 2017. “The effects of policy funds on the financing constraints of small- and medium-sized enterprises in South Korea.”
Applied Economic Letters , vol. 24, no. 10, pp. 699-702.
-
Kang, T. and Y. Seo. 2006. “[Analysis of the Relationship between Recent Corporate Investments and Cash Flows]” Financial and Economic Research, vol. 245. Bank of Korea.
https://www.bok.or.kr/imer/bbs/P0002455/view.do?nttId=74854&menuNo=500788 (in Korean) -
Lerner, J. 2002. “When Bureaucrats Meet Entrepreneurs: The Design of Effective ‘Public Venture Capital’ Programmes.”
Economic Journal , vol 112, no. 477, pp. F73-F84.
-
Modigliani, F. and M. H. Miller. 1958. “The Cost of Capital, Corporation Finance and the Theory of Investment.”
American Economic Review , vol. 48, no. 3, pp. 261-297. -
Myers, S. C. 1977. “Determinants of corporate borrowing.”
Journal of Financial Economics , vol. 5, no. 2, pp. 147-175.
-
Myers, S. C. and N. S. Majluf. 1984. “Corporate Financing and Investment Decisions When Enterprises Have Information that Investors do not have.”
Journal of Financial Economics , vol. 13, no. 2, pp. 187-221.
-
Nam, J. H. 2019. “[Policy Financial Innovation and System Restructuring Direction]” Bi-Weekly Hana Financial Focus, vol. 9, no. 19, Hana Financial Research Institute.
http://www.hanaif.re.kr/boardDetail.do?hmpeSeqNo=34150 (in Korean) -
Noh, Y. J. and J. W. Kim, J. 2014. “[A Study on the Investment Behavior of Manufacturing Companies in South Korea]”
Journal of the Korean Official Statistics , vol. 19, no. 2, pp. 56-72.https://kostat.go.kr/board.es?mid=a90103010300&bid=11912&act=view&list_no=375977 (in Korean) -
Statistics Korea. 2023. “Small and Medium-sized Enterprises (SMEs) Basic Statistics [Data set]” KOSIS.
https://kosis.kr/statHtml/statHtml.do?orgId=142&tblId=DT_BR_A001&vw_cd=MT_ZTITLE&list_id=J2_001_004_001&scrId=&seqNo=&lang_mode=ko&obj_var_id=&itm_id=&conn_path=MT_ZTITLE&path=%252FstatisticsList%252FstatisticsListIndex.do (accessed December 25, 2023) -
Tobin, J. 1969. “A General Equilibrium Approach to Monetary Theory.”
Journal of Money, Credit and Banking , vol. 1, no. 1, pp. 15-29.
- Yoon, S. H. 2016. “[Changes in the Financial Environment and Future Directions for Policy Finance]” KDB Issue Analysis, posted April 28. Korea Development Bank (in Korean)