

- EAER>
- Journal Archive>
- Contents>
- articleView
Contents
Citation
| No | Title |
|---|
Article View
East Asian Economic Review Vol. 28, No. 1, 2024. pp. 3-35.
DOI https://dx.doi.org/10.11644/KIEP.EAER.2024.28.1.429
Number of citation : 0View
113
Download
88
The Structure and Evolution of Renewable Energy Trade Networks in the RCEP Region: Application of SNA Method
|
|
Kyonggi University |
|---|---|
|
|
Kyonggi University |
|
|
Kyonggi University |
|
|
Kyonggi University |

Abstract
This paper utilizes social network analysis to examine the structural characteristics and trade dynamics of the renewable energy (hydropower, wind energy, and solar energy) trade network within the RCEP region from 2011 to 2020. The findings reveal: (1) The renewable energy trade network within the RCEP exhibits dynamism, heterogeneity, and an uneven development. The solar energy network is the most balanced and stable, while the wind energy network lags and shows marked fluctuations, with the hydropower network falling between these two. This demonstrates the diversity of energy trade within the region. (2) China, Singapore, and Japan are identified as the key exporting and importing countries, with Vietnam showing substantial growth potential. Individual analyses shed light on the stark disparities in trade status among nations, reflecting the diverse roles and future potential of member countries. (3) The QAP regression analysis reveals a significant influence of environmental pressure, particularly carbon dioxide emissions, on the renewable energy trade network. This study contributes to promoting environmental sustainability and energy security in the RCEP region and provides empirical evidence for global renewable energy trade strategies.
JEL Classification: F18, Q42
Keywords
RCEP, Renewable Energy, Trade Network, Social Network Analysis
I. Introduction
Energy plays a crucial role in the global political and economic landscape. It is fundamentally the bedrock of global economic advancement, with traditional energy sources such as oil, natural gas, and coal serving as primary drivers for industrial production, transportation, and residential activities. These have proven to be efficient drivers of economic development (Ellabban et al., 2014). However, the extensive use of traditional energy sources has led to severe environmental pollution. With the heightened global awareness of climate change and environmental protection, the importance of renewable energy in achieving global carbon neutrality goals has become increasingly prominent. Renewable energy refers to energy that is constantly replenished through natural processes, including solar, wind, hydro, tidal, geothermal, and various forms of bioenergy, such as wood, waste, and biomass. Unlike traditional fossil fuels, such as oil, coal, and natural gas, renewable energy resources are generally considered to exert a lower impact on environmental pollution (Nath and Sen, 2021) and are distinguished by their inexhaustibility.
Furthermore, the significance of renewable energy is also reflected in its dual characteristics of economic benefits and environmental protection, offering possibilities for reducing greenhouse gas emissions and achieving sustainable development. Najm and Matsumoto (2020) found that increasing the use of renewable energy helps reduce dependence on fossil fuels, making the substitution effect of renewable energy for fossil fuels increasingly evident (Chong et al., 2022). Additionally, the use of renewable energy also promotes the development of new technologies and the creation of job opportunities.
Recently, the International Energy Agency published the
Notably, according to the report, solar photovoltaic (PV) generation constitutes three-quarters of the global increase in renewable energy capacity, with wind and hydro energy occupying the second and third positions, respectively. Coinciding with this, the International Renewable Energy Agency’s
This characteristic is even more pronounced within the Regional Comprehensive Economic Partnership (RCEP) region. According to
Against this backdrop, focusing on the trade of hydro, wind, and solar energy within the RCEP region as research subjects and content is of significant reference value for understanding and analyzing global renewable energy trade. Consequently, this paper employs social network analysis to primarily study the structural characteristics and evolutionary trends of the renewable energy trade network within the RCEP region, as well as the main factors influencing renewable energy trade within the region. This research contributes to a comprehensive and accurate grasp of the development and evolution of renewable energy trade within the region, offering a new perspective for promoting global renewable energy trade. It also holds important implications for the development trends of global environmental policies and energy markets.
1)As of December 2023, 151 countries globally have committed to net-zero targets (
2)Accounting for 30% of the global population, 30% of the global GDP, and 30% of the global merchandise trade volume (China Free Trade Area Service Network,
II. Literature Review
1. Renewable Energy
The burgeoning growth and increasingly pivotal role of renewable energy trade in the global economic landscape is now widely recognized and has garnered extensive academic attention. Scholars have validated the importance of renewable energy from various perspectives.
From the aspect of supply security, Röpke (2013) explored the impact of renewable energy development on Germany’s electricity supply security from the perspective of the energy-politics triangle. Regarding technological innovation, Ellabban et al. (2014) examined the influence of power electronics and smart grid technologies on renewable energy usage, finding that the application of emerging technologies can enhance the efficiency of renewable energy usage. In terms of environmental protection, Dent (2015) conducted an in-depth study of China’s renewable energy development, discussing its integration with the concept of “ecological civilization” and noting the complex and multi-layered pattern of China’s renewable energy. Economically, Jebli and Youssef (2015) investigated the relationship between renewable energy, economic development, and carbon dioxide emissions in Tunisia from 1980 to 2009, identifying short-term unidirectional causal relationships between trade, GDP, CO2 emissions, and non-renewable energy with renewable energy. However, a 2019 study by Chen et al., focusing on China, explored the long-term relationships among per capita CO2 emissions, GDP, renewable energy, non-renewable energy production, and foreign trade between 1980 and 2014.
The above research reflects the importance and complexity of renewable energy across various dimensions, while also revealing the regional characteristics and differences in existing studies. These differences arise not only from the energy demand and supply structures of the two countries but are also deeply influenced by the political and economic environment. Therefore, renewable energy research must take into account regional characteristics, including natural resource endowments, economic strength and structure, political and legal environment, and social and cultural values.
The RCEP and the “Belt and Road” are the two economic cooperation frameworks most favored by researchers in the Asia-Pacific region. Zhao et al. (2022), through a dynamic game model, explored the competitive and cooperative relationships in renewable energy trade among countries along the “Belt and Road”, finding a greater likelihood of adopting “cooperative strategies” by trading partners. Similarly, Gao et al. (2023) also studied the competitive-cooperative relationship in renewable energy trade among the “Belt and Road”, constructing a dual-layer network model from 1996-2018, revealing heterogeneity in competitiveness and cooperativeness among 65 countries along the route, with many countries having dual identities in competition and cooperation, but with a cooperation-oriented approach being more beneficial. Bega and Lin (2023) conducted qualitative and quantitative assessments of “Belt and Road” electricity projects (including coal, wind, hydroelectric, and solar power), analyzing the reasons and challenges for power cooperation among countries along the route. Additionally, Shuai et al. (2020), Han and Li (2020b), and Leng et al. (2020) have conducted studies on renewable energy trade in the “Belt and Road” region from different dimensions. Relative to this, research on the RCEP region’s renewable energy, which has been in effect for a shorter period, is not as extensive as that on the “Belt and Road” region. Guo and Mai (2023) used a gravity model to estimate the export potential of China’s renewable energy products to other RCEP member countries, finding that the GDP of both parties, the importing country’s energy consumption, and particulate emissions are conducive to China's renewable energy exports.
Through diverse research methods, scholars have explored the cooperative and competitive relationships in regional renewable energy, further revealing the complexity and multidimensionality of renewable energy trade. However, existing research is insufficient to analyze the structural characteristics of the renewable energy trade network. Specifically, there is limited information on how nodes (member countries within the region) interact within the trade network, how relationships within the network change, and how these network structures affect the flow of renewable energy and policy-making. Given the complexity and regional heterogeneity of the renewable energy trade, it is particularly important for researchers and policy-makers to grasp the structural characteristics of its network and its evolutionary trends. Traditional analysis methods, however, are often inadequate to meet this requirement (Hollenbeck and Jamieson, 2015). Social network analysis has been proven to be a reliable choice (Bellamy and Basole, 2013; Wang and Chen, 2021).
2. Social Network Analysis
Social Network Analysis (SNA) is a methodological approach for studying social structures by analyzing the relationships (or “edges”) between individuals (or “nodes”) to understand social networks. It focuses on how individuals are interconnected and how these connections influence the behavior and attributes of both individuals and the entire network. Social network scholars have developed a series of indicators (Freeman, 1977; Burt, 1992; Everett and Borgatti, 1999; Marsden, 2002), such as degree, density, centrality, and structural holes, to quantitatively reveal the structures and dynamics within networks (Koschade, 2006), as well as their potential impacts on economic activities. Shao et al. (2018) evaluated the importance of nodes through degree centrality, eigenvector centrality, and betweenness centrality to identify key suppliers in networks. Zhang (2022) constructed a network of China’s manufacturing industry from 2009-2019, selecting network density, betweenness centrality, clustering coefficient, and average path length as network indicators to analyze the network structure characteristics and evolution trends. The extensive study of quantitative indicators has made social network analysis (SNA) a powerful tool for understanding the complex structures and evolutions of social, economic, and organizational networks.
Numerous scholars have applied SNA to discuss the structure, evolution, and relationships of the global trade network. Garlaschelli and Loffredo (2005) found that the global trade network exhibits characteristics of complex networks, showing skewed distribution, high clustering, and a small-world structure. Benedictis and Tajoli (2011) discovered a core-periphery structure in the world trade network, with a high level of clustering. Aller et al. (2015) used indicators to determine the degree of interconnection of each country in the world trade network, emphasizing the network effects (or indirect effects) of world trade and providing a unique perspective on the relationship between trade networks and the environment. Scholars have also studied supply chain (supply network) characteristics and structures from a social network perspective. Wichmann and Lutz (2016) conducted a systematic literature review of articles published over 20 years in 11 top supply chain management journals, studying how to effectively use SNA methods in supply chain management and identifying the many possibilities SNA methods bring to the field. Wen et al. (2021) constructed a global copper resource complex network to identify copper supply chain risk issues from a network structure perspective, finding that trade disruptions in a single country do not cause a global supply crisis but affect the overall network structure, inevitably leading to risks for other participants. These studies demonstrate that SNA plays a significant role in understanding the structural characteristics, intrinsic connections, and dynamic evolution of trade and supply networks, and is of great importance in gaining a deeper understanding of globalized trade patterns and dynamics.
The aforementioned research extensively applies social network analysis (SNA) methods to explore the structure, evolution, and inter-country trade relations within the world trade network, providing new perspectives and tools for identifying supply chain (network) risks and optimizing supply chain (network) structures. Similarly, utilizing social network analysis methods to study energy and renewable energy is significant for deeply understanding the structure and evolution of energy trade networks.
Given the complexity and regional heterogeneity of energy trade, scholars customarily conduct research on energy trade by regional segmentation. Many scholars have used this method to explore the trade network characteristics, temporal and spatial evolution, and influencing factors of regions such as the “Belt and Road,” the Arctic, ASEAN, etc. (Kan et al., 2020; Wang and Qiang, 2020; Chen et al., 2023; Yang et al., 2022; Zhang, 2018). There is also diversity in the choice of energy types, with coal (Ma and Lei, 2019), natural gas (Liu, 2016), oil (Liu et al., 2017a), and other mineral resources (Xu, 2015; Liu et al., 2017b; Li and Wen, 2022) being common subjects of analysis.
In summary, SNA has clear advantages in energy trade research, effectively aiding in understanding trade relationships between countries and identifying key trade partners. Thus, for renewable energy as a category of energy, does its trade network share the same spatial characteristics as other trade networks? As a relatively young regional trade agreement, what network structure does the renewable energy trade within the RCEP region exhibit? This paper attempts to deconstruct the network characteristics and evolutionary trends of renewable energy trade in the RCEP region using social network analysis and to explore its main influencing factors.
III. Research Methodology
1. The Method of Social Network Analysis
Social Network Analysis (SNA), rooted in graph theory and topology, is an analytical tool that utilizes multiple indicators to measure network structural characteristics and their dynamic spatiotemporal evolution. Applied to the analysis of renewable energy in the RCEP region, SNA not only enables the examination of the evolution of energy trade dependencies from both holistic and individual perspectives but also facilitates an in-depth study of inter-network relationships and their influencing factors. Further, it aids in more accurately understanding and predicting the interactions and future trends of RCEP member countries in the renewable energy trade.
(1) Network construction
A network model consists of nodes and the ties between nodes. Nodes represent individuals in the network, while ties represent the relationships between individuals. In this study, nodes represent the 15 RCEP member countries, and ties represent the renewable energy trade relationships between countries. The existence of a tie indicates the presence of trade. The direction of the ties indicates the flow of renewable energy trade from exporter to importer, and the thickness of the ties represents the volume of renewable energy trade, also known as the weight of the ties.
In a trade network, networks can be divided into undirected and directed networks based on whether the direction of ties is meaningful. Based on whether ties have weight, networks can be divided into unweighted and weighted networks. This study constructs directed and weighted networks for three types of renewable energy trade within RCEP, with the 15 countries as network nodes and the renewable energy trade relationships between countries as ties. The direction of the ties represents the direction of energy export, and the trade amount represents the weight. The formula for the renewable energy trade network is as follows:

C represents the 15 member countries, C={c1, c2, … cn} (n≤15). R represents the renewable energy trade relationship.
(2) Data sources and processing
This study obtained trade data for three types of renewable energy (hydropower, wind energy, and solar energy) among RCEP countries from 2011-2020 from the United Nations Commodity Trade Statistics Database (UN Comtrade Database). Following the approach of Fu et al. (2017), this study selects trade amounts of hydro turbines (HS 8410), wind turbines (HS 850231), and photovoltaic devices (HS 854140) as proxy indicators for hydropower, wind energy, and solar energy. The data for China in this study do not include statistics from Hong Kong SAR, Macao SAR, and Taiwan.
2. QAP Analysis
QAP or Quadratic Assignment Procedure, is a widely used method for studying the relationships between two relational networks, a task unfeasible for most statistical methods. QAP analysis provides a suitable random benchmark for hypothesis testing by randomly reassigning the rows and columns of a network while maintaining its structural characteristics (such as degree distribution).
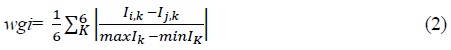
This study uses QAP regression to explore factors affecting renewable energy trade within RCEP. The specific steps are as follows: constructing matrices for the trade networks of the three types of renewable energy among the 15 RCEP countries from 2011-2020 as dependent variables (
Per capita GDP, urban population proportion, Worldwide Governance Indicators, and CO2 emissions data are obtained from the World Bank database, while distances between national capitals are from the CEPII database.
Following the methods of Wan and Gao (2014) and Han and Li (2020a), this study constructs an institutional distance absolute value index and then builds matrices of institutional distance absolute values between countries.
3)
4)
IV. The Structure and Evolution of RCEP’s Renewable Energy Trade Network
1. Overall Network Characteristics and Evolution
(1) Network evolution
Table 2 presents the basic characteristics of the three types of renewable energy trade networks in the RCEP region. In the hydropower trade network (HP), the number of nodes remained constant, indicating that the number of RCEP countries involved in hydropower trade was consistently 15 during this period. The number of ties (trade relationships) started at 82 in 2011, fluctuated slightly, decreased after 2017, rose again in 2019, but fell to its lowest in 2020 due to worsening external economic conditions.
In the wind energy trade network (WE), the number of nodes was 12 in 2011, increased to 15 by 2013, experienced slight fluctuations thereafter, but fell back to 12 in 2019 and 2020, suggesting that a few countries did not participate in wind energy trade during the period. The number of ties increased from 33 in 2011 to 43 in 2013, but then fell back to 27 in 2019 and continued to decrease to 21 in 2020. This indicates a weakening of trade activities within the wind energy trade network.
The solar energy trade network (SE) consistently had 15 nodes, showing that all countries in the region were involved in solar energy trade and maintained stability. The number of ties increased from 116 in 2011 to 140 in 2019, but due to external factors, it fell to 135 in 2020. This suggests that the solar energy trade relationships in the RCEP region were strengthening, reflecting the widespread adoption of solar technology and the growth of market demand.
In summary, the solar energy trade network is the most active and shows the steadiest growth among the three types of energy networks, indicating that photovoltaic energy is the most favored renewable energy in the RCEP region. The wind energy trade network is developing slowly and is characterized by significant fluctuations. This suggests that the wind energy market is influenced by factors such as technological developments, policy changes, or shifts in market preferences. The decline in the hydropower trade network in later periods may be related to the geographical limitations of hydroelectric resources, the need for large infrastructure investments, and environmental impact assessments.
Figure 1 to figure 3 depict the trade networks for the three types of renewable energy in 2011, 2015, and 2019, respectively. In these graphs, the size of the nodes is measured by the degree of the node, with larger nodes indicating a higher number of countries engaged in trade with it; the thickness and color intensity of the ties represent the size of trade amounts. The thicker and darker the tie, the greater the volume of trade between the countries, with the tie arrows pointing from the exporting country to the importing country. As shown in Figures, it can be seen that the trade networks for hydropower, wind energy, and solar energy within the RCEP region display significant heterogeneity, particularly in terms of participating countries, trade connections, and evolutionary trends.
From Figure 1, the hydropower trade network is stably constituted by 15 member countries, among which China maintains its position as a major exporter, while Vietnam emerges as the principal importer. As trade progressively develops, Laos, Indonesia, Myanmar, and Japan also gradually become significant regional trade participants. Hydropower projects depend on the construction of large-scale infrastructure, requiring substantial initial investment and a longer construction period. Moreover, the geographical location and water resources of a country pose high demands, leading to slow development of hydropower trade within the RCEP region.
As shown in Figure 2, the wind energy trade network, not all member countries participate in trade, with Cambodia, Laos, Myanmar, and Brunei not significantly involved in most years, maintaining only limited trade connections with certain countries. This is related to their lack of technological capability, financial support, or suitable geographical conditions. Wind energy trade is increasingly concentrated among a few core countries, with China continuously dominating the export market. This indicates China’s advantages in wind energy technology, production capacity and policy support. On the import side, the main importing countries have evolved from Australia to Thailand and back to Australia, while Japan has shifted from a leading export position to a major importer. This change reflects the dynamic shifts in wind energy market demand and supply capacity within the region. The fluctuations in the wind energy network reflect the uncertainties in technological development, policy support, and market demand.
Figure 3 shows the solar energy trade network, however, presents a different pattern, with all member countries participating in trade and maintaining stable trade relationships, leading to increasingly close trade ties and significant growth in transaction volume. China, Japan, and Korea are both major exporters and importers, showcasing their strong competitiveness and market demand in the photovoltaic industry chain. In the import market, Australia’s dominant position gradually gave way to Vietnam, which emerged as the region’s largest importer in 2019, reflecting Vietnam’s rapid development and market expansion in the photovoltaic field. The growth and stability of the solar energy trade network within the region highlight the advancements in photovoltaic technology, cost-effectiveness improvements, and the intensity of policy support. The dynamic changes in the solar energy trade network pattern also fully demonstrate the achievements of regional cooperation in promoting the development of renewable energy.
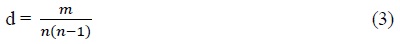
(2) Network density
Network density is an indicator that measures the closeness of a network, assisting in analyzing the tightness of connections within it. Network density is calculated by dividing the “total number of actual existing relationships (
The evolution of network density for the three types of renewable energy trade networks in RCEP countries from 2011 to 2020 is shown in Table 3 and Figure 4. Overall, the trade network density for solar energy is the highest and has generally increased, while hydropower remains relatively stable but shows a decline in the later period. Wind energy has the lowest network density, showing a clear downward trend.
From 2011 to 2017, the network density of hydropower trade was relatively stable, fluctuating between 0.3762 and 0.3952. This indicates that the trade connections for hydroelectric equipment were relatively stable. Starting in 2018, network density began to decline, dropping to 0.3095 by 2020, suggesting that trade relationships became less tight or trade connections became more dispersed.
In the wind energy network, the network density in 2011 was 0.1571, which grew to 0.2048 by 2013, indicating strengthened trade connections. However, from 2014 onwards, the network density showed a downward trend, dropping to 0.1000 by 2020. This is the smallest and most significantly reduced density among the three types of energy trade networks, indicating a reduction or diversification in trade relationships for wind energy equipment.
The trade network density for solar energy is the highest and has increased from 0.5524 in 2011 to 0.6429 in 2020, showing an overall upward trend. This might indicate that the trade network for photovoltaic equipment became denser over this period, with tighter trade connections between countries, reflecting the growth of solar power and strengthening international cooperation.
In all three types of renewable energy trade networks, there was a noticeable decline in network density from 2019 to 2020, which is related to the outbreak of COVID-19 at the end of 2019 and early 2020. The sudden deterioration of the external trade environment led to disruptions in renewable energy trade.
(3) Network centralization
Centralization, reflecting the unevenness of node centrality within a network, indicates the extent to which a network is dependent on one or several nodes. High centralization implies that a few nodes have much higher centrality than others, leading to overdependence on these nodes. Low centralization indicates that the nodes’ centrality is relatively uniform and that the network is less dependent on any single node. In directed networks, centralization is further divided into outdegree centralization (Out-c) and in-degree centralization (In-c).
In the hydropower network, out-degree centralization peaked in 2013, followed by a fluctuating downward trend. This means the influence of a few dominant exporting countries was strongest in 2013, but this difference has decreased over time, leading to a more decentralized network. The in-degree centralization peaked in 2012, then generally declined, especially after 2014, indicating a more balanced import market.
In the wind energy network, the out-degree centralization formed three peaks in 2012, 2014, and 2019, suggesting that one or several nodes were very important in the wind energy trade network in these years. The in-degree centralization was generally low, indicating even development among member countries, but it peaked notably in 2015, suggesting a significant central importing country in the wind energy market that year.
In the solar energy network, out-degree centralization was relatively stable over the entire time series but showed a slight downward trend overall. This implies a relatively stable photovoltaic export market with little change in the status of various countries. The in-degree centralization fluctuated, reaching higher values in 2012, 2015, and 2019, indicating that the photovoltaic import market was influenced by different countries in different years.
The comprehensive analysis shows that renewable energy trade within the RCEP region exhibits dynamic, heterogeneous, and unbalanced characteristics. During the observation period, hydropower, wind energy, and solar energy showed varying degrees of evolution in trade volume and relational dynamics. The export and import markets also exhibited diversification.
Specifically, the wind energy trade network had the lowest connectivity density but higher centralization and significant volatility, indicating reliance on a few key countries for wind energy trade. In contrast, the solar energy network had the highest density and most balanced centralization, indicating broader and more evenly distributed trade relationships, without significant dependence on any single country. The hydropower network fell between these two in terms of these characteristics. These differences and evolutionary trends reflect the combined effects of market maturity for each energy technology, the evolution of trade strategies, technological advancement, and the policy environment.
2. Individual Characteristics of the Network
(1) Outdegree and indegree
Outdegree of a node refers to the number of directed edges originating from that node. In this study, a country’s outdegree represents the number of different countries to which it exports, indicating its export activity. Indegree of a node refers to the number of directed edges directed towards that node. A country’s indegree in this study indicates the number of different countries from which it imports, representing its import activity.
The changes in outdegree and indegree of RCEP countries in the hydropower trade network are as follows:
China, Singapore, Japan, Thailand, and Australia have high outdegrees, indicating they are major exporters in the hydropower trade network. Cambodia, Laos, Myanmar, and the Philippines have consistently had an outdegree of 0, indicating no hydropower exports, followed by Brunei and New Zealand with low outdegrees. Singapore, Malaysia, China, Vietnam, and Indonesia have high indegrees, indicating a large and stable import demand in the hydropower network. Brunei, New Zealand, Cambodia, Laos, and Korea have low indegrees, suggesting smaller import markets.
Comparing export markets with import markets, the export intensity of hydropower trade is higher than that of imports, but the equilibrium of imports is better than exports. The export capabilities of member countries vary significantly, with four countries not participating in export trade at all. In the import network of RCEP member countries, the participation variance is smaller, with all countries opening their import markets and having relatively stable import demands.
Overall, China and Singapore are export-oriented countries with stable import markets, actively engaged in regional hydropower trade and occupying a major position in the hydropower trade network. Countries like Brunei, New Zealand, Cambodia, and Laos have limited participation in the hydropower trade network.
The changes in outdegree and indegree of RCEP countries in the wind energy trade network are as follows:
China has the highest outdegree, significantly higher than other member countries, demonstrating its leading position in wind energy exports. Japan, Singapore, and Korea, although fluctuating, maintain a certain level of export activity. Cambodia, Laos, and Myanmar consistently have an outdegree of 0, indicating low activity in the wind energy export market. Malaysia, Japan, Singapore, Thailand, and Australia have relatively high indegrees, making them major importers in the wind energy network. The Philippines, Cambodia, Brunei, Myanmar, and Laos have low indegrees, reflecting smaller wind energy markets or limited import activities in wind energy equipment.
Overall, there is a certain level of imbalance in the wind energy trade network among RCEP countries. China maintains a continuous leading position in wind energy exports, while countries like Japan, Korea, and Singapore maintain a certain level of trade activity. Other countries tend to have more import markets, reflecting diverse participation and market dynamics in wind energy trade among RCEP member countries. Some countries are gradually developing their wind energy industry, while others rely on imports to meet domestic market needs.
The changes in outdegree and indegree of RCEP countries in the solar energy trade network are as follows:
China, Singapore, Thailand, Korea, and Australia rank in the top five for outdegree and are major exporters of solar energy, while other countries also maintain a high outdegree. However, Brunei, Cambodia, Laos, and Myanmar have low or zero outdegrees, indicating low participation in photovoltaic exports. Singapore, China, Malaysia, Japan, and Thailand rank in the top five for indegree, being major importers of solar energy, and the remaining countries also have high indegrees, showing significant import demand among all member countries.
Overall, China and Singapore maintain the highest values in both outdegree and indegree, indicating that these two countries are both major exporters and important import markets in the solar energy trade. Other countries, such as Thailand, Korea, Japan, and Malaysia, also demonstrate high trade participation. Myanmar, Laos, Cambodia, and Brunei are almost inactive in the export market and have low participation in the import market, indicating smaller market sizes or early stages of development in the photovoltaic field.
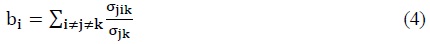
(2) Betweenness Centrality Analysis
Betweenness Centrality measures the frequency at which a node appears on the shortest paths between two other nodes. A high betweenness centrality for a node means that it acts as a “bridge” or “intermediary”, having a significant impact on the flow and connectivity of the network, occupying a key position in controlling information and resources. The formula for betweenness centrality is:
The betweenness centrality of RCEP countries in the hydropower trade network is shown in Table 8. Throughout the period, Singapore generally scores higher than other countries in betweenness centrality, except in 2019, indicating its core intermediary role in the hydropower trade network. China’s betweenness centrality score is also high, replacing Singapore as the core intermediary country in 2019. Singapore and China significantly influence the hydropower trade network pattern. Thailand, Australia, Malaysia, and Japan show moderate scores overall, indicating some intermediary role in the network. Most other countries score zero or near-zero in most years, suggesting they hardly play any intermediary role. Notably, Indonesia’s score has significantly improved, strengthening its intermediary role in the hydropower trade network.
The betweenness centrality of RCEP countries in the wind energy trade network is shown in Table 9. China and Japan maintained high levels of betweenness centrality throughout the period. Japan’s centrality peaked in 2013 and then declined. China's betweenness centrality significantly increased in 2015, 2017, and 2019, forming three peaks. This indicates that China and Japan have a high influence in the wind energy trade network. Singapore, Malaysia, Thailand, Australia, and Korea have had high betweenness centrality in certain years, playing temporary but significant intermediary roles. This also suggests the wind energy trade network's volatility, with substantial differences in trade networks across different years. Other countries mostly score zero, indicating they hardly play any intermediary role.
The betweenness centrality of RCEP countries in the solar energy trade network is shown in Table 10. Singapore maintains high betweenness centrality in most years, and China’s centrality is consistently high, sharply rising in 2019, reaching its peak, indicating their strong intermediary roles in the solar energy trade network. Malaysia in 2013 and 2019 and Vietnam in 2019 and 2020 show high centrality, indicating their emerging status as key intermediary nodes in the solar energy trade network. Thailand, Korea, and Japan also wield significant influence during the period. Other countries have relatively low centrality, indicating a limited intermediary role in the solar energy trade network.
Overall, in the RCEP region’s renewable energy trade networks, China and Singapore emerge as key nodes, not only having strong export capabilities in hydro and solar energy trade networks but also being important import markets. Singapore’s centrality is prominent in hydropower trade, while China’s position is especially significant in wind and solar energy networks. In contrast, countries like Brunei, New Zealand, Cambodia, and Laos have limited participation. Additionally, Japan, Korea, and other countries show steady trade activity, reflecting the diversity and potential of the RCEP region’s renewable energy trade.
V. Analysis of Factors Influencing RCEP Renewable Energy Trade Networks
This study applies social network analysis to analyze renewable energy trade within the RCEP region from 2011 to 2020. It explores the structure and evolution of the RCEP renewable energy trade network from both macro and micro perspectives, using multiple indicators. The macro analysis focuses on changes in the overall characteristics of the network across different years, while the micro analysis concentrates on changes in key nodal countries over the years. Next, the study employs Quadratic Assignment Procedure (QAP) regression analysis to quantitatively assess the factors influencing the renewable energy trade network.
1. Factors Influencing Renewable Energy Trade Networks
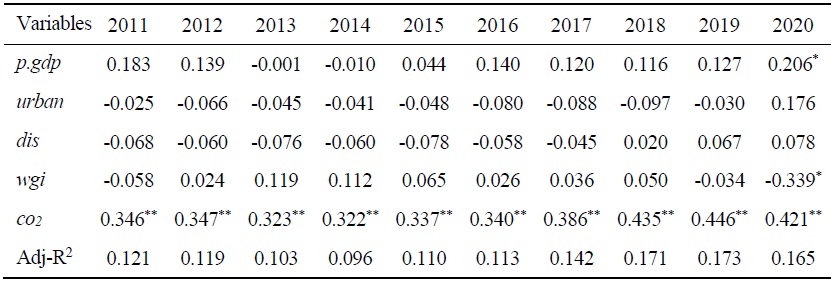
Firstly, the total trade volume of the three types of renewable energy is summed up by country, constructing the overall renewable energy trade network for the RCEP region, which serves as the dependent variable. It uses previously listed independent variables such as the economic difference matrix (
The analysis of the influence factors in the RCEP renewable energy trade network reveals that the economic difference (
The difference in environmental pressure (
2. Further Testing of Environmental Pressure Difference Matrix
To test the impact of the environmental pressure difference matrix on renewable energy trade, the study further conducts regression tests for hydropower, wind energy and solar energy trade networks separately.
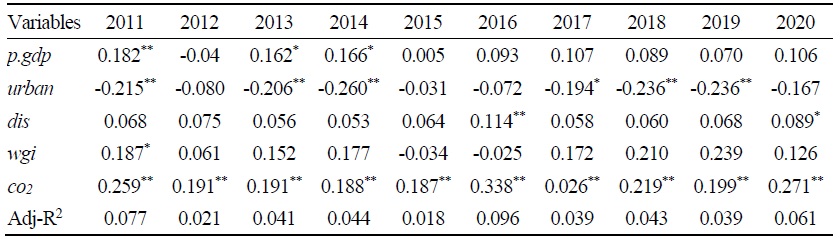
In the hydropower trade network, the development difference (
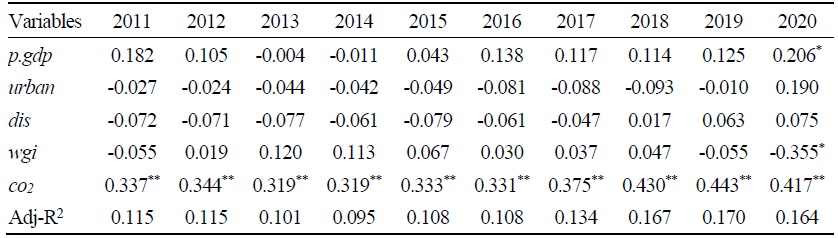
In the wind energy trade network, the development difference (
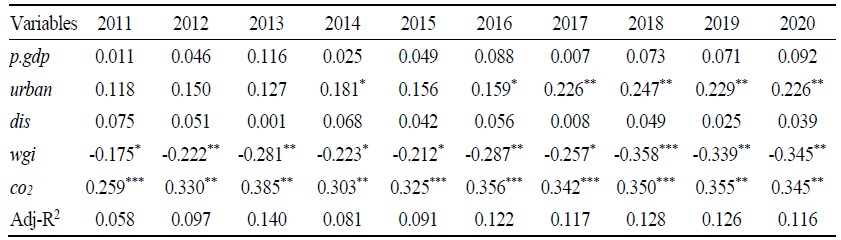
As shown in Table 14, in the solar energy trade network, the economic difference (
From the above data, it is evident that in all three types of renewable energy trade networks, the environmental pressure difference matrix has a significant positive impact, indicating that the consistent significance of carbon dioxide emissions suggests environmental pressures and climate policies are primary factors driving renewable energy trade. Although the development difference and institutional difference have significant impacts in certain years, hinting at the potential roles of urbanization levels and national governance levels in promoting the exchange of renewable energy technologies, the overall trend indicates that renewable energy trade is more driven by the pressure of carbon emissions.
VI. Conclusions and Discussion
1. Conclusions
This study utilized various indicators of social network analysis to explore the structure and evolution of the RCEP region’s renewable energy trade network, both at the overall network level and the micro-individual level, and the key nodal countries in different energy types and years. It employed QAP regression analysis to quantitatively analyze the influencing factors of the renewable energy trade network. The main conclusions are as follows:
(1) From an overall network perspective, the RCEP region’s renewable energy trade network exhibits dynamic development, structural heterogeneity, and unbalanced participation. The wind energy trade relies on key countries with a low network connectivity density and significant centrality and volatility. The solar energy network shows the highest connectivity density and steady centrality, reflecting its mature state in the RCEP region. The characteristics of the hydropower network lie between these two. Additionally, from a network stability perspective, the dominant countries in the hydropower and wind energy trade networks vary in different years, while the solar energy trade network shows relative stability. These characteristics reflect the complexity of energy trade, which is different from other trades, and reveal the differences in regional renewable energy market demand and energy technology development.
(2) The individual-level analysis reveals significant differences in countries’ participation and their status in the trade network, showing dynamic evolution over time. China, Singapore, and Japan occupy central positions in the RCEP renewable energy trade network. In particular, China and Singapore demonstrate strong capabilities and sustained participation in both exports and imports. Countries like Thailand, Australia, Korea, and Malaysia maintain certain activity levels. Meanwhile, some countries, like Brunei and Laos, have limited participation, showcasing the diversity of roles and immense potential within the region. Additionally, Vietnam’s rapid rise in the solar energy field and prominent import position in hydropower trade highlight its significant development potential.
(3) The QAP regression analysis confirms that environmental pressure, specifically CO2 emissions, has a significant positive impact on renewable energy trade. Further testing also reveals a significant positive impact of CO2 emissions on all three types of renewable energy trade, highlighting the central role of environmental issues and emission reduction goals in promoting trade. This reflects the increasing attention of RCEP countries to environmental issues and their willingness to take measures for renewable energy. As the global response to climate change strengthens, these trends are expected to continue influencing energy trade within the region.
2. Discussion
This study offers insights into the structural dynamics and evolution of the renewable energy trade network within the RCEP region, enhancing understanding of the forces propelling renewable energy trade. It highlights the influence of environmental pressures on trade dynamics, suggesting strategies for fostering RCEP cooperation:
(1) Enhance regional collaboration on environmental policy and climate action. Recognizing environmental pressure as a key driver for renewable energy trade, RCEP countries should unify efforts in climate change mitigation, adopting shared emission reduction goals, advancing clean energy technologies, and considering carbon pricing mechanisms to bolster renewable energy trade and meet climate objectives.
(2) Facilitate renewable energy technology exchange and collaboration. Given the diverse trade patterns across renewable energy types, RCEP members ought to encourage technology sharing and joint innovation initiatives, focusing on areas with technological disparities. This approach aims to spur innovation and integrate smaller or less technologically advanced countries into the renewable energy global value chain.
(3) Implement adaptable multilateral cooperation and policy frameworks. To address developmental, institutional, and policy divergences, RCEP countries need flexible cooperation mechanisms, simplifying trade processes and establishing financial supports for cross-border renewable energy projects, thereby fostering effective regional collaboration tailored to national circumstances and promoting renewable energy development.
Of course, this study also has some areas for expansion, which will be further refined in future research:
(1) Expanding factor analysis. Future work should explore additional influences on the trade network, including technological advances, policy frameworks, and international trade dynamics, for a holistic understanding of factors at play.
(2) Extending the observation period. A longer timeframe may uncover more profound trends, aiding in forecasting and guiding trade strategies.
(3) Widening research scope. Investigating trade between RCEP and non-RCEP countries can offer insights into global renewable energy trade patterns and regional interactions.
Tables & Figures
Table 1.
Influencing Factor Indicators
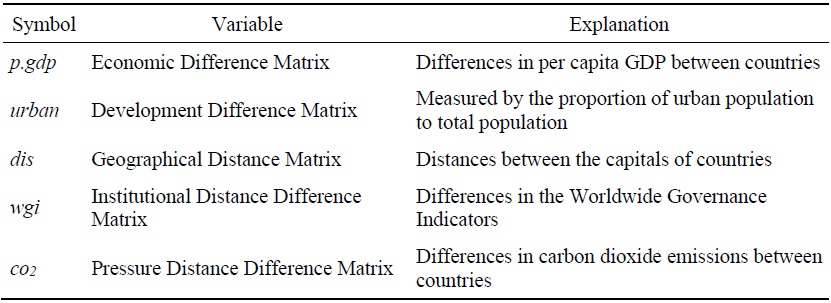
Table 2.
Overall Characteristics of the Three Types of Energy Trade Networks
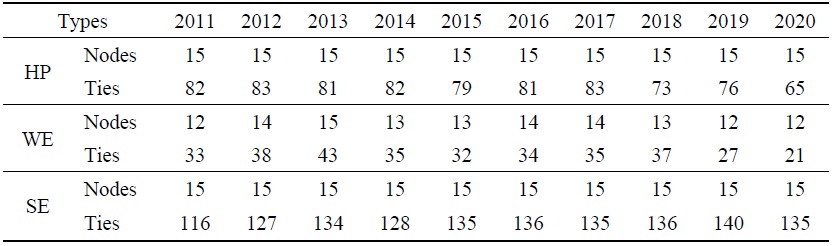
Figure 1.
Hydropower Networks
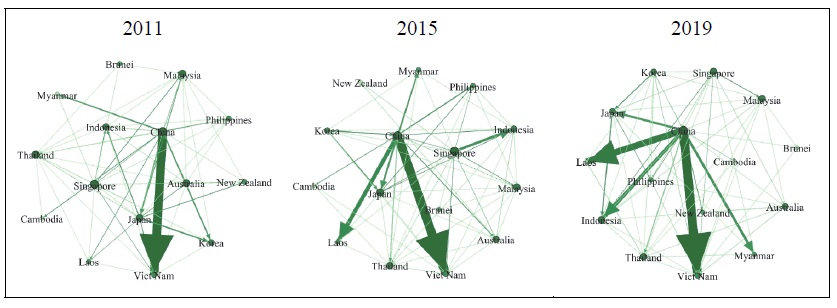
Figure 2.
Wind Energy Networks
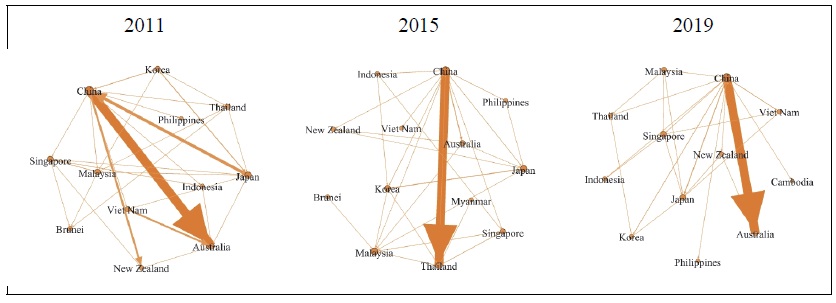
Figure 3.
Solar Energy Networks
Table 3.
Evolution of Network Density in Renewable Energy Networks
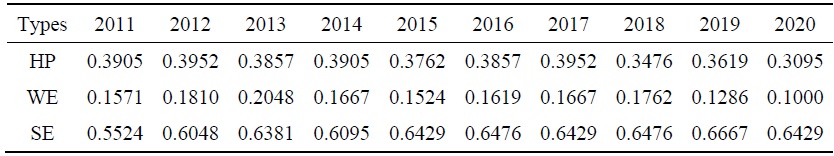
Figure 4.
Evolution of Network Density in Renewable Energy Networks Line Chart
Table 4.
Evolution of Network Centralization in Renewable Energy Networks
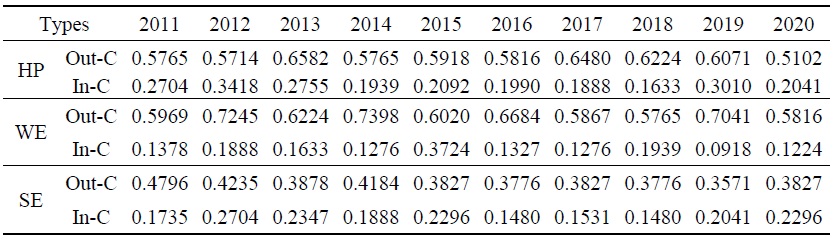
Figure 5.
Evolution of Network Centralization in Renewable Energy Networks Line Chart
Table 5.
Outdegree and Indegree of Countries in Hydropower Trade Networks
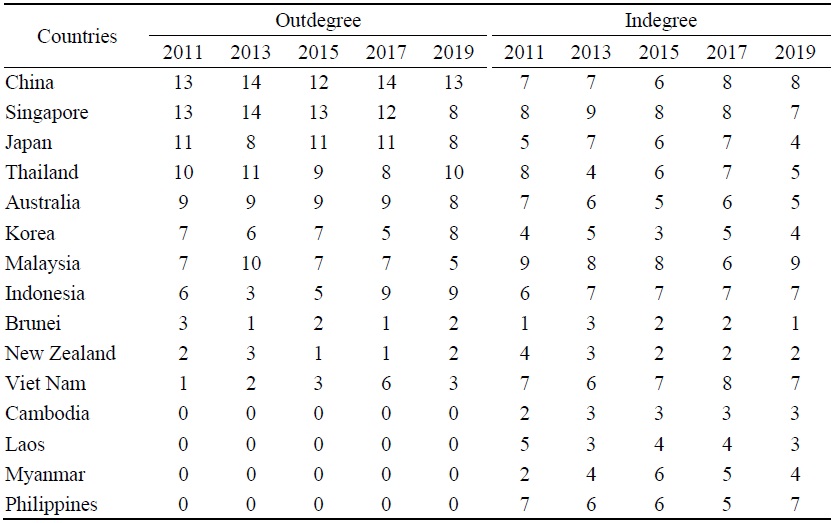
Table 6.
Outdegree and Indegree of Countries in Wind Energy Trade Networks
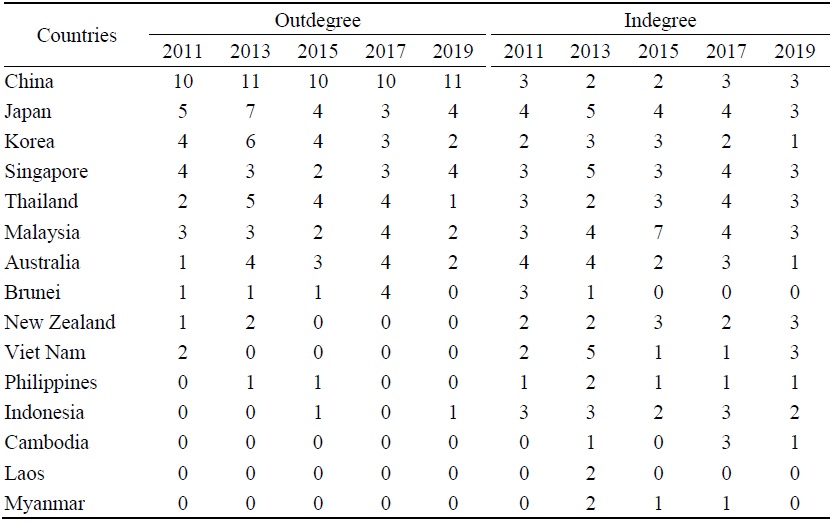
Table 7.
Outdegree and Indegree of Countries in Solar Energy Trade Networks
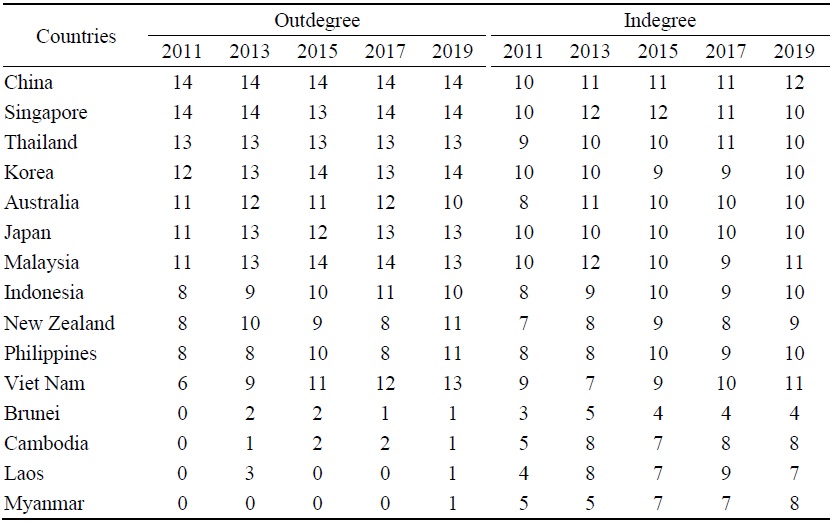
Table 8.
Betweenness Centrality of Countries in Hydropower Trade Networks
Table 9.
Betweenness Centrality of Countries in Wind Energy Trade Networks
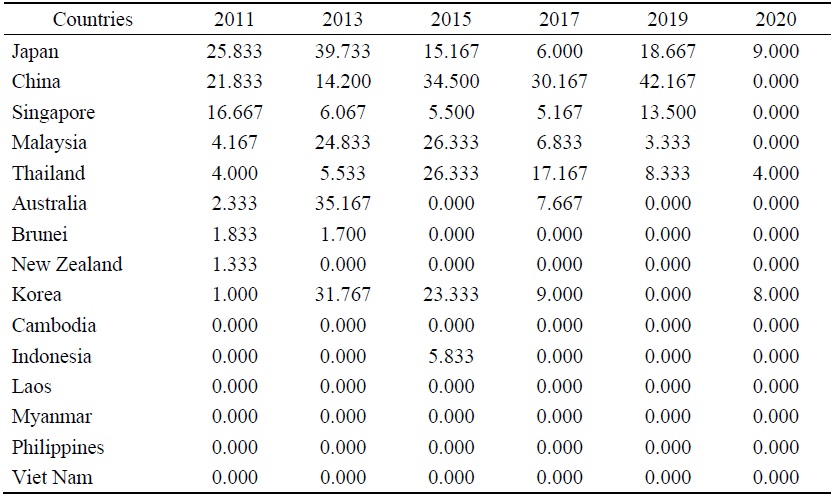
Table 10.
Betweenness Centrality of Countries in Solar Energy Trade Networks
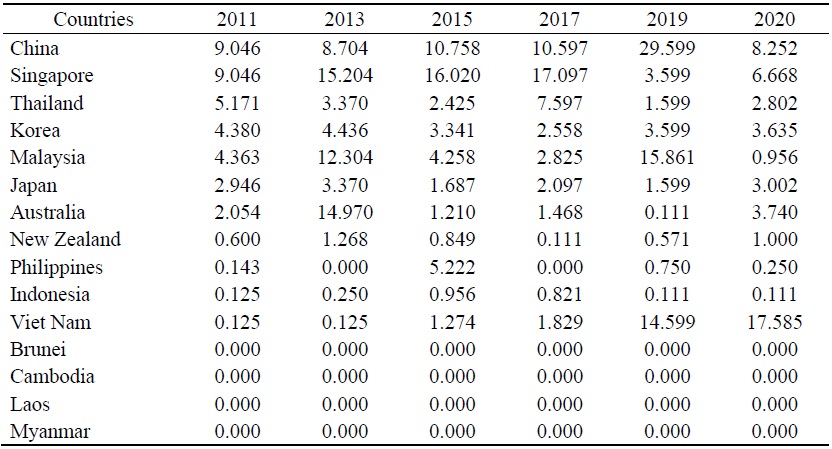
Table 11.
Regression Results for Factors Influencing Renewable Energy Trade Networks
Note: ***, ** and * denote significance at 1%, 5%, and 10% level, respectively.
Table 12.
Regression Results of Influencing Factors on Hydropower Trade Networks
Note: ***, ** and * denote significance at 1%, 5%, and 10% level, respectively.
Table 13.
Regression Results of Influencing Factors on Wind Energy Trade Networks
Note: ***, ** and * denote significance at 1%, 5%, and 10% level, respectively.
Table 14.
Regression Results of Influencing Factors on Solar Energy Trade Networks
Note: ***, ** and * denote significance at 1%, 5%, and 10% level, respectively.
References
-
Aller, C., Ductor, L. and M. J. Herrerias. 2015. “The World Trade Network and the Environment.”
Energy Economics , vol. 52, pp. 55-68.
-
Bega, F. and B. Lin. 2023. “China’s Belt & Road Initiative Energy Cooperation: International Assessment of the Power Projects.”
Energy , vol. 270.
-
Bellamy, M. A. and R. C. Basole. 2013. “Network Analysis of Supply Chain Systems: A Systematic Review and Future Research.”
Systems Engineering , vol. 16, no. 2, pp. 235-249.
-
Benedictis, L. D. and L. Tajoli. 2011. “The World Trade Network.”
World Economy , vol. 34, no. 8, pp. 1417-1454.
-
Burt, R. S. 1992.
Structural Holes: The Social Structure of Competition . Harvard University Press. -
Chen, W., Niu, X., Ke, W. and Z. Yu. 2023. “Investigating the Energy Trade Networks in the Belt and Road Regions: Structures and Evolution.”
Energy , vol. 283, article 129157. -
Chen, Y., Wang, Z. and Z. Zhong. 2019. “CO2 Emissions, Economic Growth, Renewable and Non-Renewable Energy Production and Foreign Trade in China.”
Renewable Energy , vol. 131, pp. 208-216.
-
Chong, Z., Jiang, X. and Z. He. 2022. “Research on the network dependence characteristics and substitution in international trade: Fossil energy and renewable energy.”
Geographical Research , vol. 41, no. 12, pp. 3214-3228.https://www.doi.org/10.11821/dlyj020220398 (in Chinese) -
Dent, C. M. 2015. “China’s Renewable Energy Development: Policy, Industry and Business Perspectives.”
Asia Pacific Business Review , vol. 21, no. 1, pp. 26-43.
-
Ellabban, O., Abu-Rub, H. and F. Blaabjerg. 2014. “Renewable Energy Resources: Current Status, Future Prospects and Their Enabling Technology.”
Renewable and Sustainable Energy Reviews , vol. 39, pp. 748-764.
-
Everett, M. G. and S. P. Borgatti. 1999. “The Centrality of Groups and Classes.”
Journal of Mathematical Sociology , vol. 23, no. 3, pp. 181-201.
-
Freeman, L. C. 1977. “A Set of Measures of Centrality Based on Betweenness.”
Sociometry , vol. 40, no. 1, pp. 35-41.
-
Fu, X., Yang, Y., Dong, W., Wang, C. and Y. Liu. 2017. “Spatial Structure, Inequality and Trading Community of Renewable Energy Networks: A Comparative Study of Solar and Hydro Energy Product Trades.”
Energy Policy , vol. 106, pp. 22-31.
-
Gao, C., Tao, S., Su, B., Mensah, I. A. and M. Sun. 2023. “Exploring Renewable Energy Trade Coopetition Relationships: Evidence from Belt and Road Countries, 1996-2018.”
Renewable Energy , vol. 202, pp. 196-209.
-
Garlaschelli, D. and M. I. Loffredo. 2005. “Structure and Evolution of the World Trade Network.”
Physica A: Statistical Mechanics and its Applications , vol. 355, no. 1, pp. 138-144.
-
Guo, Q. and Z. Mai. 2023. “China’s Potential for Trade in Renewable Energy Products in RCEP Countries: A Gravity Model Analysis.”
International Journal of Energy Research , vol. 2023, article 1530969. -
Han, D. and G. Li. 2020a. “Research on the Evolution and the Influence Mechanism of Grain Trade Pattern between China and Countries along ‘The Belt and Road’: From the Perspective of Social Network.”
Issues in Agricultural Economy , vol. 8, pp. 24-40. (in Chinese) -
Han, M. and S. Li. 2020b. “Network Characteristics and Community Structure of Marine Energy Products Trade Among the Countries Along the Belt and Road.”
Economic Geography , vol. 40, no. 10, pp. 108-117.https://www.doi.org/10.15957/j.cnki.jjdl.2020.10.013 (in Chinese) -
Hollenbeck, J. R. and B. B. Jamieson. 2015. “Human Capital, Social Capital, and Social Network Analysis: Implications for Strategic Human Resource Management.”
Academy of Management Perspectives , vol. 29, no. 3, pp. 370-385.
-
Jebli, M. B. and S. B. Youssef. 2015. “The Environmental Kuznets Curve, Economic Growth, Renewable and Non-Renewable Energy, and Trade in Tunisia.”
Renewable and Sustainable Energy Reviews , vol. 47, pp. 173-185.
-
Kan, S., Chen, B., Meng, J. and G. Chen. 2020. “An Extended Overview of Natural Gas Use Embodied in World Economy and Supply Chains: Policy Implications from a Time Series Analysis.”
Energy Policy , vol. 137, article 111068.
-
Koschade, S. 2006. “A Social Network Analysis of Jemaah Islamiyah: The Applications to Counterterrorism and Intelligence.”
Studies in Conflict & Terrorism , vol. 29, no. 6, pp. 559-575.
-
Leng, Z., Shuai, J., Sun, H., Shi, Z. and Z. Wang. 2020. “Do China's Wind Energy Products Have Potentials for Trade with the ‘Belt and Road’ Countries?--A Gravity Model Approach.”
Energy Policy , vol. 137, article 111172.
-
Li, H. and S. Wei. 2022. “A Study on spatial-temporal pattern evolution of global rare earth trade network and China’s status change.”
World Regional Studies .https://kns.cnki.net/kcms/detail/31.1626.P.20221107.1751.002.html (in Chinese, accessed August 18, 2022) -
Liu, J. 2016. “Evolution of the World Natural Gas Trade Pattern Based on Social Network Analysis.”
Economic Geography , vol. 36, no. 12, pp. 89-95.https://www.doi.org/10.15957/j.cnki.jjdl.2016.12.013 (in Chinese) -
Liu, L., Shen, L., Liu, X., Cheng, S., Zhong, S., Cao, Z., Zhang, C., Kong, H. and Y. Sun. 2017a. “Spatial-temporal features of China's oil trade network and supply security simulation.”
Resources Science , vol. 39, no. 8, pp. 1431-1443. (in Chinese) -
Liu, Y., Huang, J. and J. Chen. 2017b. “[Analysis of Network Connections and Influencing Factors of Global Copper Ore Resource Flow]”
Statistics & Decision , vol. 7, no. 475, pp. 146-149.https://www.cnki.net/kcms/doi/10.13546/j.cnki.tjyjc.2017.07.038.html (in Chinese) -
Ma, Y. and H. Lei. 2019. “Simulation of Energy Trade Network Evolution and Connectivity Effects of Countries along the Silk Road Economic Belt.”
Statistics & Information Forum , no. 9, pp. 92-102. (in Chinese) -
Marsden, P. V. 2002. “Egocentric and Sociocentric Measures of Network Centrality.”
Social Networks , vol. 24, no. 4, pp. 407-422.
-
Najm, S. and K. Matsumoto. 2020. “Does Renewable Energy Substitute LNG International Trade in the Energy Transition?”
Energy Economics , vol. 92, article 104964.
- Nath, U. K. and R. Sen. 2021. “A Comparative Review on Renewable Energy Application, Difficulties and Future Prospect.” Paper presented at the 2021 Innovations in Energy Management and Renewable Resources. Kolkata, India, February 5-7, 2021.
-
Röpke, L. 2013. “The Development of Renewable Energies and Supply Security: A Trade-off Analysis.”
Energy Policy , vol. 61, pp. 1011-1021.
-
Shao, B. B. M., Shi, Z., Choi, T. Y. and S. Chae. 2018. “A Data-Analytics Approach to Identifying Hidden Critical Suppliers in Supply Networks: Development of Nexus Supplier Index.”
Decision Support Systems , vol. 114, pp. 37-48.
-
Shuai, J., Leng, Z., Cheng, J. and Z. Shi. 2020. “China’s Renewable Energy Trade Potential in the ‘Belt-and-Road’ Countries: A Gravity Model Analysis.”
Renewable Energy , vol. 161, pp. 1025-1035.
-
Wan, L. and X. Gao. 2014. “The Influence of Cultural, Geographical and Institutional Distance on China’s Import and Export Trade: An Empirical Test of the Trade Data with 32 Countries or Regions.”
International Economics and Trade Research , vol. 5, pp. 39-48. (in Chinese) -
Wang, J. and H. Chen. 2021. “[Risk Propagation Model of Complex Product Supply Chain Based on Complex Network]”
Statistics & Decision , vol. 4, pp. 176-180. (in Chinese) -
Wang, W. and P. Qiang. 2020. “Space and Network Features and Influential Factor in Energy Trade in the Silkroad Economic zone.”
Guizhou Social Sciences , no. 3, pp. 123-131. (in Chinese) -
Wen, S., Chen, J. and X. Hao. 2021. “[Research on the Supply Chain Risk of Global Copper Resources from the Perspective of Complex Network]”
Mining Research and Development , vol. 41, no. 9, pp. 171-178.https://www.doi.org/10.13827/j.cnki.kyyk.2021.09.032 (in Chinese) -
Wichmann, B. K. and L. Kaufmann. 2016. “Social Network Analysis in Supply Chain Management Research.”
International Journal of Physical Distribution & Logistics Management , vol. 46, no. 8, pp. 740-762.
-
Xu, B. 2015. “Social Network Analysis of the International Iron Ore Trade Pattern.”
Economic Geography , vol. 35, no. 10, pp. 123-129. (in Chinese) -
Yang, W., Hu, Z. and W. Shi. 2022. “The Evolutionary Dynamics of the Energy Trade Networks in the Pan Arctic State Based on the Perspective of Multi-Dimension Proximity.”
Human Geography , vol. 184, no. 2, pp. 31-40+93. - Zhang, L. 2022. “[Research on Supply Network Structure and Resilience: Taking Manufacturing Industry as an Example]” Master’s thesis, Shaanxi Normal University. (in Chinese)
-
Zhang, X. 2018. “Analysis on Structural Characteristics and Influencing Factors of Energy Trade Network between China and ASEAN.”
Huazhong University of Science and Technology . (in Chinese) -
Zhao, Y., Shuai, J., Shi, Y., Lu, Y. and Z. Zhang. 2022. “Exploring the Co-opetition Mechanism of Renewable Energy Trade Between China and the ‘Belt and Road’ Countries: A Dynamic Game Approach.”
Renewable Energy , vol. 191, pp. 998-1008