

- EAER>
- Journal Archive>
- Contents>
- articleView
Contents
Citation
| No | Title |
|---|
Article View
East Asian Economic Review Vol. 28, No. 1, 2024. pp. 69-94.
DOI https://dx.doi.org/10.11644/KIEP.EAER.2024.28.1.431
Number of citation : 0View
25
Download
19
Assessing the Economic Impact of Covid-19 through a Counterfactual Analysis
|
|
Ajou University |
|---|

Abstract
The Covid-19 pandemic has caused unprecedented disruptions across industries worldwide. This paper aims to analyze the economic impact of the pandemic on the sales performance of basic commercial areas in Seoul, Korea. Using a regression analysis with credit card transaction data, the study underscores the critical nature of determining the reference point for comparison. Firstly, in comparison to the revenue in the same quarter before the onset of the pandemic, a significant decrease in revenue was observed across most categories during the pandemic periods. Secondly, when compared to the counterfactual revenue in the same period, extrapolated by an exponential smoothing forecasting, the overall revenue decrease during the periods was less pronounced, except in a few categories. Interestingly, certain categories appeared to witness marginal increases in sales after the pandemic. The paper discusses some policy implications of these findings.
JEL Classification: D22, L81, E37
Keywords
Covid-19, Counterfactual Analysis, Intervention Policy
I. Introduction
The Covid-19 pandemic has brought about widespread disruption, affecting economies, societies, and daily routines (Estrada et al., 2021; Khan et al., 2021). As the pandemic gradually diminishes, there arises a necessity to gain a comprehensive understanding of its multifaceted impact on diverse sectors. Analogous to assessing the aftermath of a typhoon and formulating preemptive strategies for future crises, the present moment offers an opportune juncture to appraise the far-reaching consequences of Covid-19 and to reevaluate the effectiveness of intervention policy measures implemented throughout the crisis.
In the wake of Covid-19, businesses in Seoul, Korea, also faced unprecedented challenges. The pandemic compelled governments to enforce strict social distancing measures to mitigate its spread. These measures led to drastic shifts in consumer behavior, leaving numerous businesses grappling with uncertainties. To comprehend the extent of Covid-19’s impact on Seoul’s local economy, we analyzed the sales performance of basic commercial areas in the city, focusing on their revenue changes during the pandemic and social distancing phases.
Many studies have been conducted on the socio-economic effects of Covid-19 pandemic. For macroeconomic implications of the pandemic shocks, refer to Baqaee and Farhi (2022) and Guerrieri et al. (2022). For stock market effects, see Uddin et al. (2021) and Baker et al. (2020). The labor market impact is analyzed by Adams-Prassl et al. (2020). For a review of anti-pandemic policies in low- and middle-income countries, see Miguel and Mobarak (2022). Bloom et al. (2020) explores the productivity effect using firm survey data, while Alon et al. (2020) discuss gender equality issues. Mahmoudi (2022) deals with the problem of optimal policy design. Brodeur et al. (2021) offer an exhaustive literature survey.
This paper exhibits several distinctive features when contrasted with the existing literature.
First, in contrast to many empirical studies that rely on survey data (e.g., Bloom et al., 2021), we employ quarterly sales data for the basic commercial areas in Seoul, constructed from actual credit card transaction records. Relying on more objective data will enhance the reliability of our estimations of the Covid-19 effects.
Second, while a substantial portion of prior research has centered on the initial periods of Covid-19’s impact (e.g., Chen et al., 2021), our study examines the effects of Covid-19 over eight quarters spanning 2020 to 2021—when concerns about the pandemic were at their zenith and government-mandated social distancing measures, such as shutdowns and operating hour restrictions, were most actively implemented. By concentrating on this temporal window, we dissect the effects of Covid-19 during its most pivotal and pronounced phase.
Third, we deviate from prior studies by conducting a granular analysis at the level of distinct business categories. This approach permits an examination of the potential revenue redistribution catalyzed by Covid-19 across these categories. Given that various categories are likely to encounter differing levels of perceived Covid-19 infection risk and that consumption patterns are liable to transform distinctively following the pandemic, this category-level analysis emerges as both pertinent and insightful.
Fourth, while most preceding investigations juxtapose the Covid-19 period with a fixed pre-pandemic time point to scrutinize structural shifts, we adopt a unique methodology. We employ the pre-pandemic trend specific to each category to compute counterfactual revenues during the pandemic period, subsequently contrasting these projections with the actual observed sales. This approach provides insight into how far actual sales deviate from the anticipated trajectory. As many categories were already witnessing revenue downturns before Covid-19 due to economic slowdown and online-offline transition trends, this method theoretically offers greater relevance for evaluating the marginal impact of Covid-19.
Previous studies on the impact of the pandemic on the Korean economy, including Lee and Choi (2020), Kim and Chang (2021), Ju et al. (2021), and Baek (2022), among others, have investigated sectoral and/or regional differences in the effects of the pandemic using credit card-based sales data, similar to our approach in this paper. However, these studies are confined to the initial stages of the pandemic up to the year 2020. Moreover, they did not fully account for the pre-pandemic revenue decline trend in most local markets, potentially influenced by the recent economic slowdown and the swiftly progressing online-offline transitions in the economy—factors that we explicitly consider in our analysis.
The paper is structured as follows: Chapter II introduces the data structure, the commercial districts, and the categories under consideration. Chapter III presents two models used to estimate the effects of Covid-19 on sales for each category. The first model compares the sales variation over eight quarters from 2020 to 2021 with the same quarters in 2019, while the second model compares the actual sales variation during the Covid-19 period with counterfactual sales predicted based on data up to 2019. Chapter IV applies these two methods to the twenty major categories and presents the estimated sales growth rates in each category during the Covid-19 period. The paper explores the categorical differences and attributes them to various factors such as the intensity of shutdown measures and other disease control measures, changes in consumption patterns, the pace of online transition, and the government’s emergency disaster support fund. Chapter V summarizes the key findings and reviews the intervention policies by the Korean government during the Covid-19 period.
II. Data
The data utilized in this study consists of category-level quarterly sales for basic commercial areas in the city of Seoul, Korea, from 2017 to 2021. To justify the timeframe, Figure 1 displays the quarterly profile of cumulative number of Covid-19 confirmed cases in Seoul from 2020 to 2022. The total confirmed cases in the fourth quarter of 2022, a cumulative total of 5.66 million cases, accounts for about 58% of Seoul’s total population, approximately 9.8 million.
In this study, the timeframe from the 1st quarter of 2020, marked by the occurrence of the first confirmed case, through to the 4th quarter of 2021 is considered the periods exposed to the impact of Covid-19. The exclusion of the year 2022 primarily stems from data availability. Furthermore, by 2022, a substantial portion of the population had already received three vaccine doses, and a treatment protocol for Covid-19 had been established. Consequently, a gradual relaxation of social distancing measures ensued, culminating in the complete lifting of restrictions. In contrast, during 2020 and 2021, a palpable apprehension surrounding novel infectious diseases prevailed, prompting frequent shutdowns for specific entertainment enterprises and necessitating quarantine measures as part of social distancing initiatives. Within this context, it is plausible that the impact of Covid-19 was even more pronounced during the earlier phase. This supposition finds validation in Figure 2, which illustrates the trajectory of online transaction revenue (measured in trillion KRW) within the food services sector across years. A conspicuous surge between 2020 and 2021 is evident—a period congruent with the study’s temporal scope. This surge can be attributed to the heightened utilization of delivery platforms, as conventional dining experiences were hampered by quarantine regulations. Korea’s well-established delivery and e-commerce infrastructure likely played a pivotal role in attenuating the Covid-19 impact by facilitating the migration of offline transactions to online counterparts through delivery services. Hence, examining the timeframe spanning from 2020 to 2021 as target period will yield a substantial data for evaluating the economic consequences of the pandemic.
The revenue data we used in this paper were initially collected by a card company in Korea as the actual card sales records of individual stores during each quarter. Card sales include both in-store and delivery sales made using personal cards, corporate cards, and debit cards. The number of individual stores included in the original data varies slightly by quarter, but as of the fourth quarter of 2021, there are a total of 34,756 stores in the data. The data was then adjusted by incorporating the market share of the company in total card sales, and the estimated cash sales, calculated using the quarterly cash and card transaction ratios reported by the Bank of Korea (2019). For privacy protection, every record in the publicly available data is only available at the (category, area) level, rather than at the individual store level.
To streamline the analysis, we focused on 20 major categories out of the total 81 available categories. These selected categories account for approximately 63.2% of the total revenue in the data. Table 1 summarizes the quarterly revenue observations (in logarithmic scales) from 2017 to 2021, encompassing a total of 408,941 observations, along with the number of commercial areas in each of chosen categories. Several notable features stand out from the periodic trend of total category sales (in billion KRW) depicted in Figure 3. Firstly, when comparing pre- and post-pandemic periods (after 2020), most categories display a downward revenue trend, especially those reliant on face-to-face interaction such as food and beverage and entertainment categories. In contrast, certain categories, such as medical clinics and pharmaceuticals, which might have experienced positive effects during the pandemic, show an increasing revenue trend. Secondly, the figure highlights strong pattern of seasonality, reflecting the quarterly observations. These features must be addressed in the subsequent analysis.
Unlike previous literature, such as Kim and Chang (2021) and Baek (2022), which re-aggregated the areal observations to the administrative district (“dong”) level, this paper analyzes the sales of original commercial areas as the fundamental unit of analysis. Even for the same category in the same administrative district, there may exist regional variations in residential density, population composition, and other factors. Therefore, using the sales of basic commercial areas with no further aggregation will help minimize possible aggregation bias. Table 2 shows the number of commercial areas by districts (“gu”) in Seoul.
The commercial areas can be segmented into four zones based on their location characteristics and size, as shown in Table 3. Alley (“Golmok”) commercial areas refer to locations adjacent to residential areas, where numerous small-scale self-employed stores are concentrated. High-street (“BalDal”) commercial areas are situated near major roads, experiencing high rent and a significant flow of mobile traffic. Market (“SiJang”) commercial areas represent locations near permanent traditional markets, such as “Gwangjang” market in Seoul. Lastly, Tourist (“GwanGwang”) commercial areas refer to locations well-known for attracting travelers, such as “Myeongdong” or “Dongdaemun”. We will not only focus on the overall effects of Covid-19 in all commercial areas but also pay attention to potential differences across the segments of areas.
1)The data is available from
2)In computing total category sales for each quarter in
III. Analysis
Throughout this chapter, the main regression model is as follows:

In equation (1),
Particularly,
Specifically,
Remarkably, the regression model in equation (1) is analogous to calculating the mean divergence in sales between a designated target period and a reference period, akin to the approach often embraced in experimental studies. However, the regression model holds an inherent advantage: it enables the comparison of sales within the target period against diverse reference periods, rendering it particularly apt for the specific objectives of this study. Furthermore, through harnessing the estimated parameters derived from the regression analysis, we can not only discern the discrepancy in sales across each period but also ascertain the growth rates spanning these two intervals. To articulate this, the equation (1) can be equivalently expressed as follows:

and the growth rate of sales in
We conduct separate regression for each business category using the model in equation (1). This approach ensures a comprehensive understanding of outcomes across categories and their individual nuances. In fact, Bloom et al. (2021) examined the heterogeneous impacts of the pandemic across U.S. small business sectors using a survey. Their study estimated an overall revenue loss of around 29% for the second quarter of 2020. However, they also reported that approximately 40% of surveyed businesses experienced no decrease in revenue or even saw a slight increase. In this paper, we will analyze this pattern of heterogeneity, across categories, using actual transaction data in Korea.
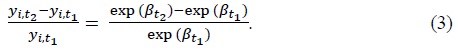
The (category, area)-level analysis is undertaken through two distinct approaches. Firstly, we will scrutinize the growth rates of sales during the Covid-19 impacted periods, juxtaposed against the corresponding quarters in 2019. To illustrate, consider the scenario where the dummy coefficient in equation (1) for the 1st quarter of 2021 stands at -0.3, while for the 1st quarter of 2019 it registers at 0.2. Consequently, the calculation of the sales growth rate between these two periods would be derived as follows: 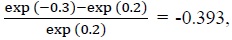 as delineated by equation (3). Consequently, we can deduce that Covid-19 led to an average decline of 39.3% in category sales during the 1st quarter of 2021, relative to the 1st quarter of 2019.
For most of the categories, the regression analysis of the model in equation (1) reveals notably high R-squared values in Table 4, varying between 0.809 and 0.955 depending on categories, and averaging at 0.896. Furthermore, most parameter estimates exhibit very robust statistical significance, except only a few spatial dummy coefficients. This evidence reinforces the notion that assuming a uniform periodic growth pattern across categories, after controlling for the area fixed effects, does not unduly restrict the interpretation of actual phenomena.
Before consolidating the outcomes for all categories in the next section, let’s examine the results for one category as an illustrative example for expositional purposes. As shown in Figure 3, it is evident that the karaoke category is one of the industries that has been most negatively affected by the pandemic. Figure 4 displays the estimated 95% confidence interval of the periodic dummy coefficients (
Figure 5 showcases the estimated distribution of the areal fixed effects (
Applying the estimated coefficients and the reference-changing formula in equation (3) allows us to calculate the revenue growth rates for each quarter relative to a specific pre-pandemic reference point. Considering the inherent seasonality in quarterly observations, it seems more reasonable to use the corresponding quarter in 2019 as the baseline for calculating the growth rates, rather than the 4th quarter of 2019. Figure 6 illustrates the revenue growth rates in the karaoke category for the eight quarters after the pandemic, calculated using this method.
While this straightforward approach provides some insights, it may not fully capture the true impact of Covid-19. This is because the sales in most categories were already experiencing a significant downward trend due to the economic slowdown and the rapid transition from offline to online sales before the onset of Covid-19. For instance, Figure 7 illustrates the actual growth rates of the total sales for the karaoke category, as depicted in Figure 3, over the eight quarters preceding the pandemic, in comparison to the corresponding quarter in the previous year. It is apparent that the quarterly revenue has already undergone a significant decline in 2019.
Therefore, attributing all the sales declines observed after the Covid-19 outbreak to the effect of Covid-19 would lead to an overestimation of the actual impact in many categories. Conceptually, the true effect of Covid-19 can be obtained using a difference-in-differences method if we had an appropriate control group. Considering the global scale of the Covid-19 pandemic, a distinct challenge emerges—there is, in practical terms, no control group that remains unaffected. All observed instances fall under the sway of Covid-19’s influence. In response to the challenging circumstances, we conducted an alternative counterfactual analysis for each category, outlined as follows:
1. We estimated the parameters of equation (1) using data exclusively from the first quarter of 2017 to the fourth quarter of 2019, deliberately excluding data for the pandemic periods.
2. Extrapolating the 12 pre-pandemic quarterly dummy coefficients (
3. By comparing the counterfactual coefficients with the original coefficients derived from the regression model encompassing data for all quarters, we calculated the sales growth (or loss) rates during the pandemic periods using equation (3).
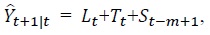
A crucial aspect in this sequential process is reliable extrapolation. To address the pre-pandemic trend as well as the seasonality of quarterly observations, we employed the Error-Trend-Seasonality (ETS) method for extrapolation. In the ETS (also known as triple exponential smoothing) method, the one-step ahead forecast,  is calculated as the sum of three components: level, trend, and seasonality, represented as:
where
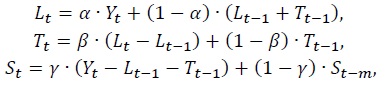
where
By applying equation (3) for the same quarter in the pandemic periods, we can calculate the revenue growth rates compared to the counterfactual revenue that would have occurred without Covid-19 pandemic. For instance, if the estimated  This implies that Covid-19 led to a 18% decrease in sales in that quarter compared to the counterfactual sales.
Figure 9 displays the sales growth rate in the karaoke category calculated through the counterfactual difference method mentioned above. Once again, the negative impact of Covid-19 is evident. The 8-quarter average of the sales growth rate during the pandemic periods is 47.8%. When compared to the year-to-year comparison in Figure 5, it is observed that the magnitude of the negative impact has slightly decreased. This is because, in this category, sales were already experiencing a gradual downward trend before the occurrence of Covid-19.
In theory, the second approach involving a comparison with counterfactual sales holds validity. However, it can introduce supplementary prediction errors via ETS forecasting, which could potentially diminish its reliability. As a result, in the subsequent section, we will furnish the outcomes derived from both methods for each category. By doing so, we aim to spotlight any prevalent trends, should they exist, and subsequently contrast the divergences in outcomes between the two distinct approaches.
3)For example, the share of online transactions in the Korean retail market has been steadily increasing in the total revenue. During the Covid-19 period, in November 2021, online sales surpassed offline sales
4)The pre-pandemic regressions yielded exceptionally high R-squared values for most categories, surpassing even the values obtained from the regressions for the entire period as reported in
5)A multiplicative form is also possible. In this paper, we used an additive model, built in the FORECAST.ETS function in Microsoft Excel, setting the length of the seasonality cycle to 4 to account for quarterly observations of sales. For further details on the ETS method, refer to
IV. Results
Figure 10 illustrates the estimated sales growth rates for each category in comparison to the two references mentioned earlier. Furthermore, Table 5 provides a summary of these patterns, presenting the average growth rates (with the Monte-Carlo standard errors in parentheses) during the pandemic-impacted quarters over either one of the two references.
From the analysis outlined above, several distinctive patterns emerge:
First, in the context of comparing each quarter against the corresponding quarter in 2019—the established reference period—a conspicuous downtrend in sales manifests across a wide spectrum of categories. Notably, categories encompassing karaoke rooms, hof & pub, and restaurants, wherein stringent shutdowns or operating hour constraints were imposed, register notable declines in sales. Intriguingly, however, the pharmaceuticals category—bolstered by escalated sales of pandemic related medications and masks—alongside the butcher shop category, buoyed by heightened demand as a dining alternative, deviates from the norm by exhibiting heightened sales even when measured against the benchmark of 2019.
Second, when juxtaposing the decline rate in sales against the counterfactual revenue projected for each target quarter under the presumption of a pandemic-free environment, a marked attenuation in the decline rate becomes evident. Interestingly, this altered perspective reveals that numerous categories that encountered reduced sales relative to 2019 exhibit a surge in sales during the Covid-19 period according to the counterfactual scenario. For instance, while the supermarkets category records an average 7.6% decline in sales relative to 2019, a remarkable upswing of 20.1% materializes when contrasted against counterfactual sales that reflect the pre-Covid-19 revenue trajectory.
Third, the peak of the sales decline rate vis-à-vis counterfactual sales transpires predominantly within several categories during the fourth quarter of 2020—a juncture characterized by the inception of shutdowns and operational restrictions. Subsequent quarters chronicle a gradual recuperation across many categories. This trend is likely underpinned by diverse factors, including escalated vaccination rates, the incremental relaxation of social distancing measures, and the distribution of substantial-scale emergency disaster support funds by both central and local governments.
Fourth, the standard errors of the growth rate forecast increased in the case of the counterfactual comparison, reflecting the additional uncertainty associated with the exponential smoothing forecasts.
Now, our attention shifts to a comparative examination of the sales growth rates across diverse geographic segments of commercial areas, as introduced in Table 3. For the sake of clarity, we opt to exclusively present the growth rates pertaining to the counterfactual scenario free from the influence of Covid-19. Figure 11 visualizes the difference in revenue growth rates across four representative categories, each segmented into four distinct commercial zones.
Evidently, discernible variations between segments are manifest across most categories. Notably, the sales decline rates within the alley and market segment—proximate to consumers’ residences—tend to exhibit a relatively modest trajectory. In contrast, commercial zones characterized by elevated foot traffic, such as the highstreet and tourist segments, demonstrate more pronounced sales declines. However, it is noteworthy that for specific categories, such as karaoke rooms—a segment subjected to active shutdowns during the 4th quarter of 2020 and the 3rd quarter of 2021—no noteworthy disparities in sales decline rates emerge across different segments.
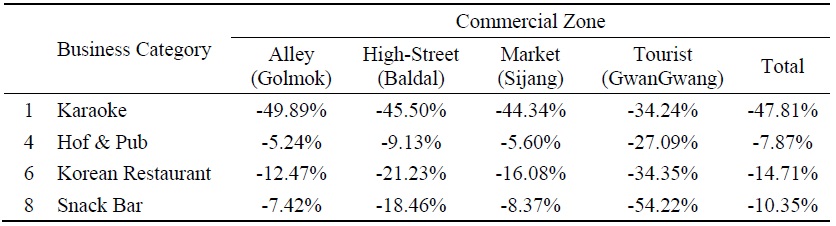
Finally, Table 6 presents the average sales decline rates for each segment during the eight quarters impacted by Covid-19. Again, it confirms that the extent of the shock varies among segments. For instance, in the Hof and Pub category, the average sales decline rate is -5.24% in alley zone, -5.60% in market zone, -9.13% in high-street zone, and -27.1% in the hardest-hit tourist zone of areas. These findings indicate that the large-scale local-currency support provided by the Korean government to mitigate the impact of the pandemic was mainly spent on businesses in the residential areas in categories where the risk of infection is considered relatively low.
V. Conclusion
Consumers have reacted sensitively to social distancing measures due to Covid-19 and rapidly changed their consumption patterns. Restaurant visits were replaced by takeout or delivery services, and gatherings at bars or karaoke rooms were substituted with purchasing beverages and snacks from CVS or supermarkets. Additionally, people reduced long-distance travel and predominantly spent money on local businesses near their residences. The government’s emergency disaster relief funds should have partially offset the decrease in consumer spending. In this study, we demonstrated that the changes in consumer behavior resulted in significant variations in sales for different categories of businesses in Seoul’s basic commercial areas before and after Covid-19. While overall sales declined for most categories compared to 2019, considering the predicted counterfactual sales under a pandemic-free scenario, the actual sales decline was minor, and some categories even experienced a slight increase in sales.
The government has played a crucial role in the economic recovery efforts. To mitigate the economic downturn caused by Covid-19 and address the financial insecurity of self-employed individuals, the Korean government allocated a total of 104.4 trillion KRW in disaster support funds during 2020-2021. These funds were distributed in two main parts: a portion was given to the general population in the form of local currency, and another portion was allocated to small and medium-sized enterprises (SMEs) that are assumed to have experienced a decline in sales due to the pandemic. Specifically, for the latter support, the government identified businesses that faced decreased sales compared to 2019 and provided financial assistance of 1 million KRW per quarter for multiple quarters. Additionally, for businesses such as bars and restaurants subject to additional shutdowns or operating hour restrictions, an extra 2 million or 1 million KRW per quarter was provided.
Despite the timely rescue policy, our study highlights some potential issues with this approach. Firstly, not all sales decline compared to 2019 can be attributed solely to the effects of Covid-19. Some categories were already experiencing a downward trend before the pandemic, and when comparing the counterfactual sales without Covid-19, some of them experienced even higher sales during the pandemic period. Targeting industries with higher Covid-19 impacts through a trend consideration could have increased the effectiveness of the policies.
Secondly, using tax records to identify businesses with sales decline and providing a fixed amount might not be as fair as using the information to offer a certain percentage of the sales decline for payment. Thirdly, the disaster support funds provided to the public in the form of local currency primarily contributed to the rapid recovery of sales in the residential areas or nearby traditional markets, but they were not very helpful for boosting tourist or high-street businesses. Thus, differentiated support based on the commercial segment might have been more appropriate.
We recognize certain limitations in the analysis in this paper. Firstly, there is a concern regarding the accuracy of estimated revenue based on credit card transactions. Distortions may occur during the consideration of the cash-to-card ratio and market shares of credit cards. Nevertheless, despite not being flawless, the recording of sales for self-employed businesses in the baseline period, both pre- and post-pandemic, is a rather unique case. Hence, it can still assist in gauging the overall impact of the pandemic, as demonstrated in this paper. Secondly, the analysis was unable to investigate how the rate of sales growth varies by category, taking into explicit consideration the potential heterogeneity of commercial areas. This limitation stems from the unavailability of more granular data on population and business composition within each submarket. Addressing these aspects in future research could yield more nuanced policy implications.
6)For other aspects of the policy intervention, refer to
7)In this regard, an anonymous reviewer expressed deep concern about neglecting other control variables in the analysis. I appreciate valuable feedback and suggestions from all reviewers in the process of revising this paper.
Tables & Figures
Figure 1.
The Cumulative Number of Covid-19 Confirmed Cases in Seoul
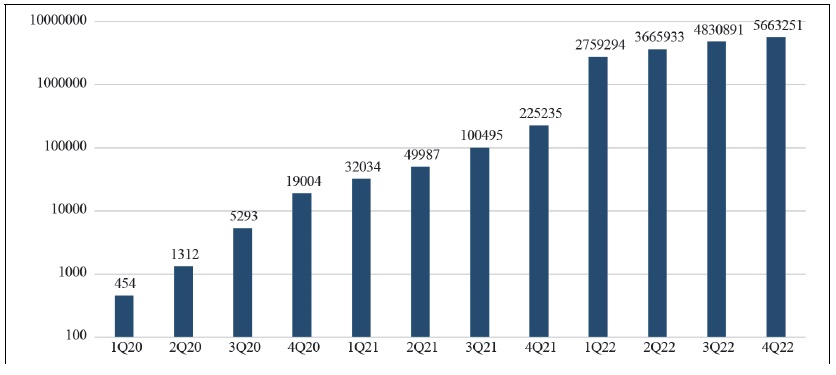
Figure 2.
Online Food Service Revenue in Korea (in trillion KRW)
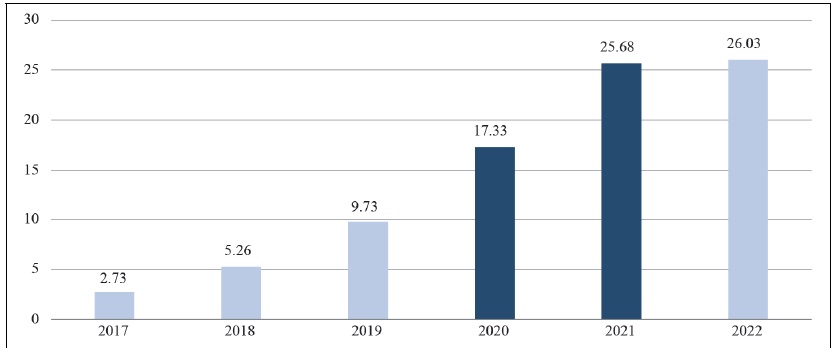
Table 1.
Summary Statistics of Revenue and Commercial Areas by Category
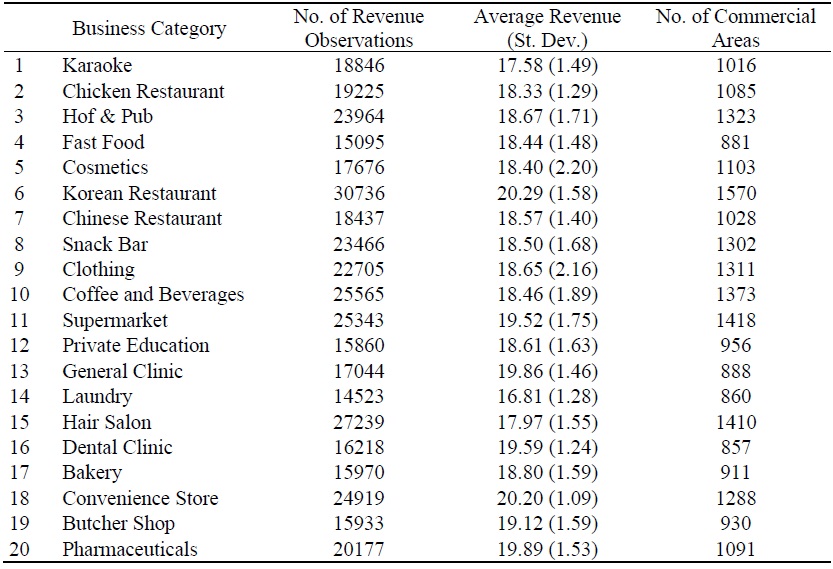
Figure 3.
Aggregate Revenue Trends by Category (2017-2021)
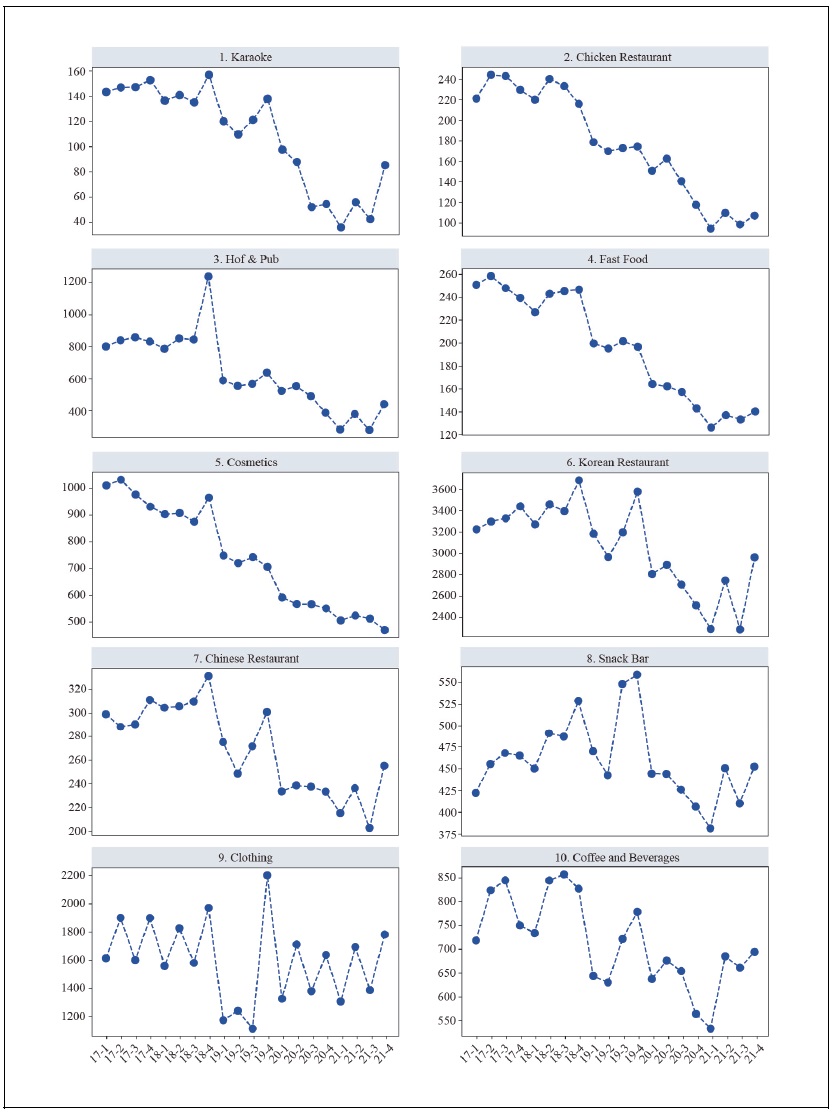
Figure 3.
Continued
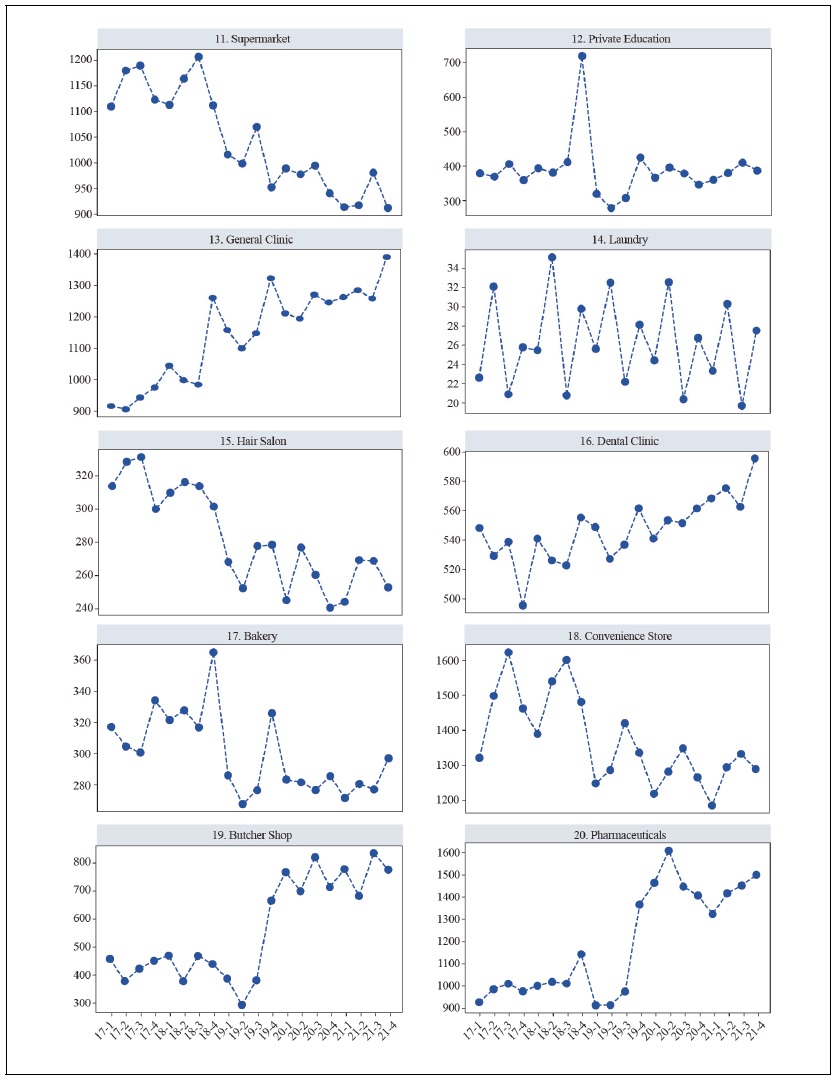
Table 2.
Number of Basic Commercial Areas by Districts in Seoul
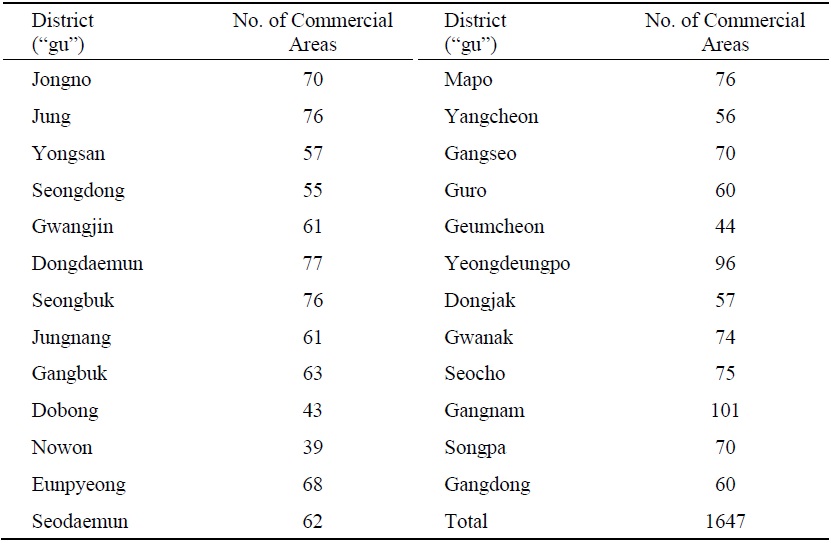
Table 3.
Segmentation of the Basic Commercial Areas in Seoul
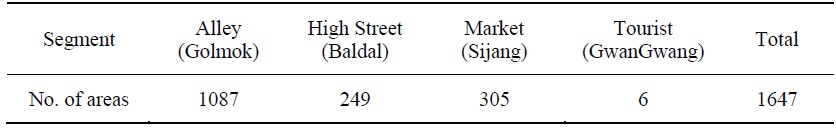
Table 4.
Explanatory Power of the Regression Model
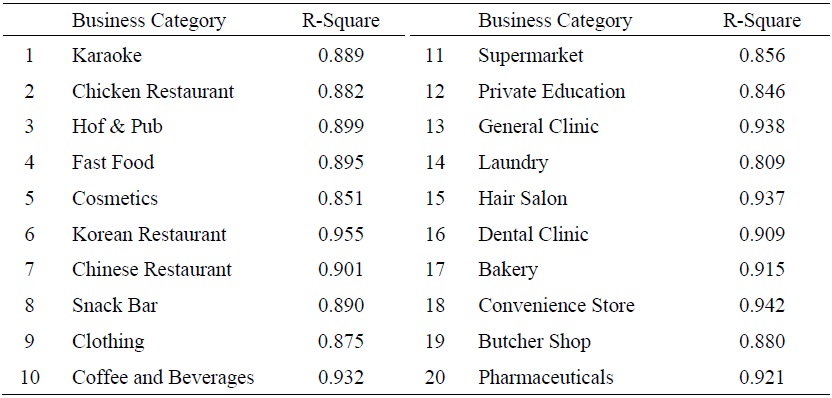
Figure 4.
Estimates of the Periodic Coefficients (
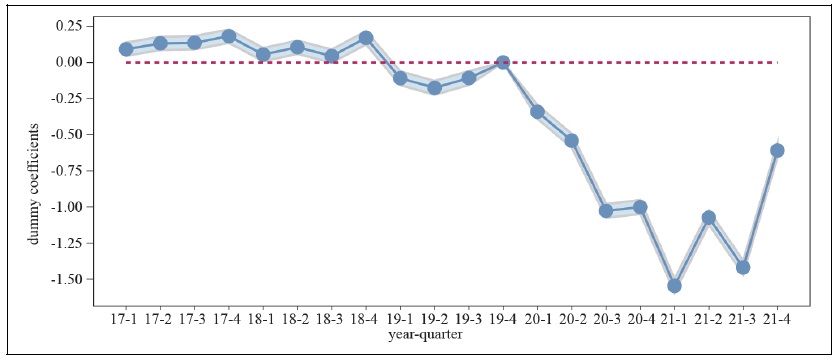
Figure 5.
Estimates of the Areal Fixed Effects (
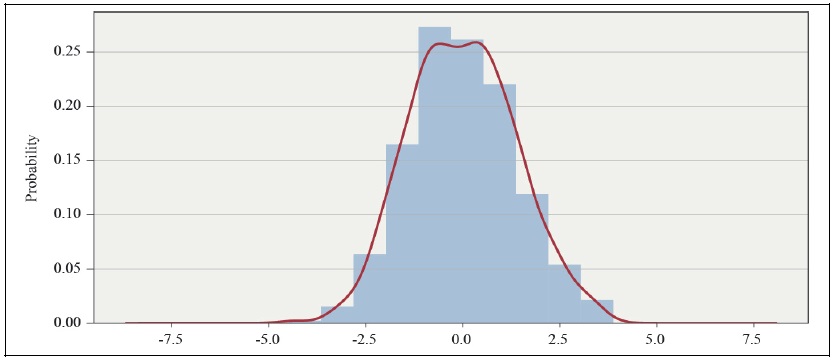
Figure 6.
Model Growth Rates Comparing to the Corresponding Quarter in 2019
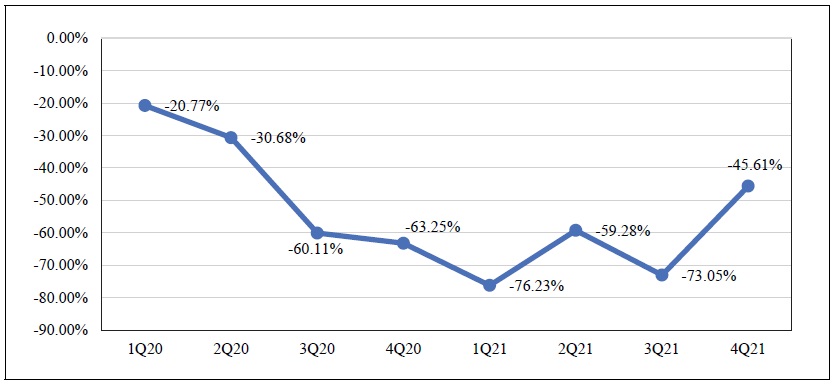
Figure 7.
Actual Pre-pandemic Growth Rates over the Same Quarter Last Year
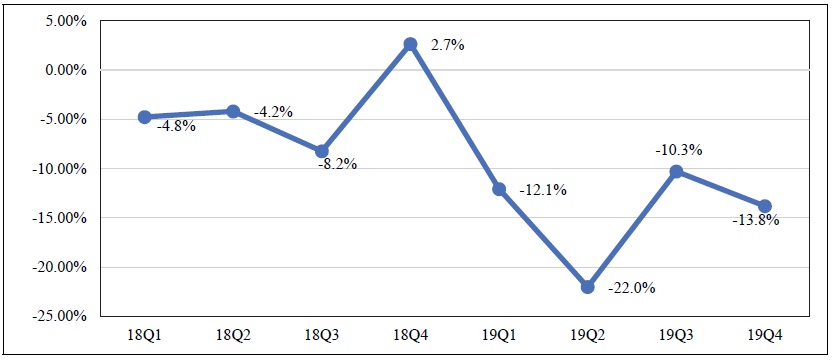
Figure 8.
Illustration of ETS Forecasting Method (Karaoke Category)
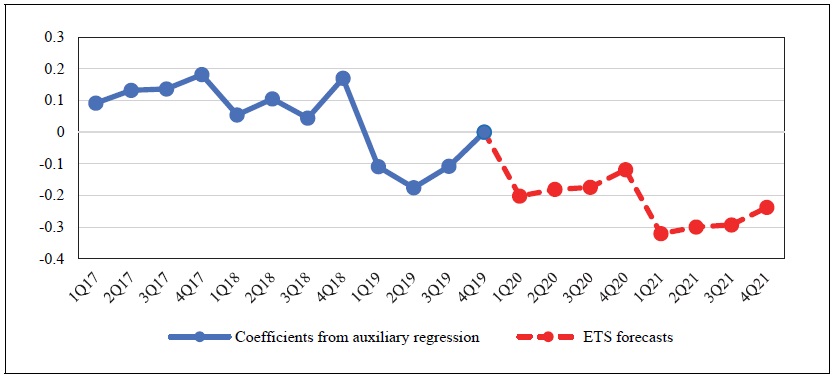
Figure 9.
Model Growth Rates Comparing to the Counterfactual Forecast
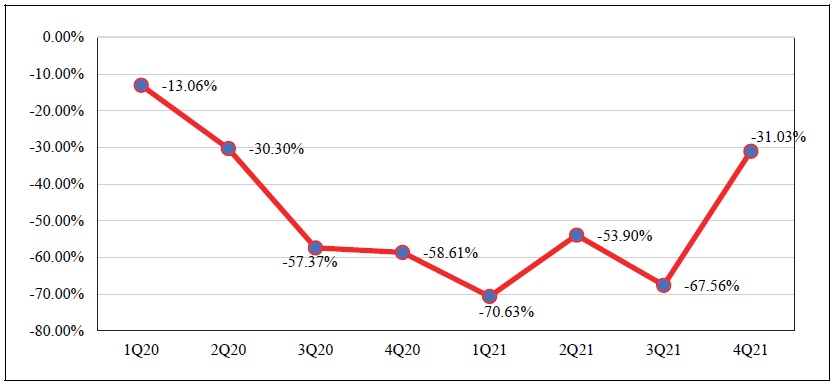
Figure 10-1.
Revenue Growth Rates by Categories: Chart [1]
![Revenue Growth Rates by Categories: Chart [1]](/S_Img/JE0001/2024/v28n1/JE0001_2024_v28n1_69_f011.jpg)
Figure 10-2.
Revenue Growth Rates by Categories: Chart [2]
![Revenue Growth Rates by Categories: Chart [2]](/S_Img/JE0001/2024/v28n1/JE0001_2024_v28n1_69_f012.jpg)
Table 5.
Comparison of the Average Revenue Growth Rates by Categories
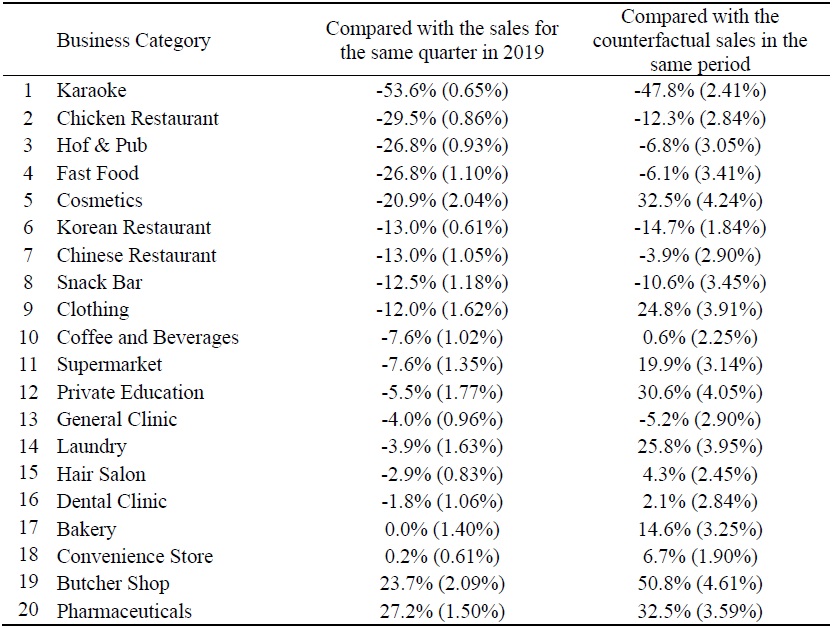
Figure 11.
Revenue Growth Rates by Categories and Segments
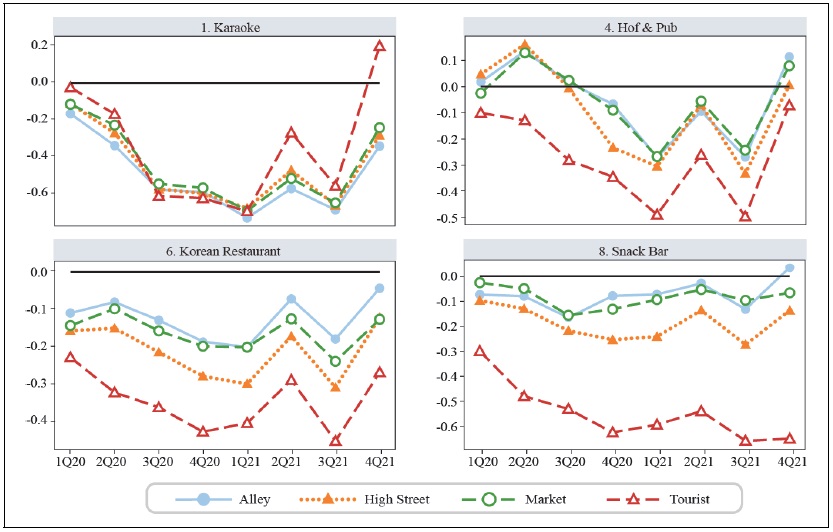
Table 6.
Revenue Growth Rates by Area Segment
References
-
Adams-Prassl, A., Boneva, T., Golin, M. and C. Rauh. C. 2020. “Inequality in the impact of the coronavirus shock: Evidence from real time surveys.”
Journal of Public Economics , vol. 189.
- Alon, T. M., Doepke, M., Olmstead-Rumsey, J. and M. Tertilt. 2020. “The impact of Covid-19 on gender equality.” NBER Working Papers, no. 26947. National Bureau of Economic Research.
-
Baek, J. 2022. “Heterogeneous Impacts of COVID-19 on Businesses.”
Korea Review of Applied Economics , vol. 24, no. 2, pp. 5-53. (in Korean) - Baker, S. R., Bloom, N., Davis, S. J., Kost, K. J., Sammon, M. C. and T. Viratyosin. 2020. “The unprecedented stock market impact of Covid-19.” NBER Working Papers, no. 26945. National Bureau of Economic Research.
-
Bank of Korea. 2019. “[2018 Economic Entity-Specific Cash Usage Behavior Survey Results]” Press Release, April 16.
https://www.bok.or.kr/viewer/skin/doc.html?fn=201904150524594281.pdf&rs=/webview/result/P0000559/201904 (in Korean) -
Baqaee, D. and E. Farhi. 2022. “Supply and demand in disaggregated Keynesian economies with an application to the Covid-19 crisis.”
American Economic Review , vol. 112, no. 5, pp. 1397-1436.
- Bloom, N., Bunn, P., Mizen, P., Smietanka, P. and G. Thwaites. 2020. “The impact of Covid-19 on productivity.” NBER Working Papers, no. 28233. National Bureau Economic Research.
- Bloom, N., Fletcher, R. S. and E. Yeh. 2021. “The impact of COVID-19 on US firms.” NBER Working Papers, no. 28314. National Bureau of Economic Research.
-
Brodeur, A., Gray, D., Islam, A. and S. Bhuiyan. 2021. “A literature review of the economics of Covid‐19.”
Journal of Economic Surveys , vol. 35, no. 4, pp. 1007-1044.
-
Chen, H., Qian, W. and Q. Wen. 2021. “The impact of the Covid-19 pandemic on consumption: Learning from high-frequency transaction data.”
AEA Papers and Proceedings , vol. 111, pp. 307-311.
-
Estrada, M. A. R., Koutronas, E. and M. Lee. 2021. “Stagpression: the economic and financial impact of the Covid-19 pandemic.”
Contemporary Economics , vol. 15, no. 1 (Special Issue).https://www.doi.org/10.5709/ce.1897-9254.433
-
Guerrieri, V., Lorenzoni, G., Straub, L. and I. Werning. 2022. “Macroeconomic implications of Covid-19: Can negative supply shocks cause demand shortages?”
American Economic Review , vol. 112, no. 5, pp. 1437-1474.
-
Hassani, H., Silva, E. S., Gupta, R. and M. K. Segnon. 2015. “Forecasting the price of gold.”
Applied Economics , vol. 47, no. 39, pp. 4141-4152.
-
Hyndman, R. J. and G. Athanasopoulos. 2018.
Forecasting: principles and practice . OTexts. -
Ju, J., Noh, S. and J. Yoon. 2021. “[Economic Losses Caused by the Spread of Covid-19 in the Seoul Area]” Policy Report, no. 322. Seoul Institute.
https://www.si.re.kr/node/64651 (in Korean) -
Khan, A., Khan, N. and M. Shafiq. 2021. “The economic impact of Covid-19 from a global perspective.”
Contemporary Economics , vol. 15, no. 1 (Special Issue), pp. 64-75.https://www.doi.org/10.5709/ce.1897-9254.436
-
Kim, M. and Y. Oh. 2020. “[Effects and Implications of the First Emergency Disaster Relief Payment Policy]” KDI Policy Forum, no. 281. Korea Development Institute.
https://www.kdi.re.kr/research/forumView?pub_no=16851 (in Korean) -
Kim, M. J. and W. H. Chang. 2021. “[Analysis of the Economic Impact of Covid-19 andSuggestions for Improving Disaster Relief Fund Design Using Credit Card Data]” 2021-06. Korea Institute of Public Finance.
https://www.kipf.re.kr/kor/Publication/All/kiPublish/ALL/view.do?serialNo=526834 (in Korean) -
Lee, Sungho and S. Choi. 2020. “Analysis of the Impact of COVID-19 on Local Market Areas Using Credit Card Big Data: A Case of Suwon.”
Space and Environment , vol. 30, no. 3, pp. 167-208. (in Korean) -
Mahmoudi, M. 2022. “Covid lessons: was there any way to reduce the negative effect of Covid-19 on the United States Economy?”
Journal of Economic Studies . vol. 50, no. 5, pp. 896-920.
-
Miguel, E. and A. M. Mobarak. 2022. “The economics of the Covid-19 pandemic in poor countries.”
Annual Review of Economics , vol. 14, pp. 253-285.https://doi.org/10.1146/annurev-economics-051520-025412
-
Ministry of Trade, Industry and Energy (MOTIE). 2021. “[Sales Trends of Major Distribution Companies in November 2021]”
https://www.motie.go.kr/kor/article/ATCL3f49a5a8c/165104/view (in Korean) -
Uddin, M., Chowdhury, A., Anderson, K. and K. Chaudhuri. 2021. “The effect of Covid-19 pandemic on global stock market volatility: Can economic strength help to manage the uncertainty?”
Journal of Business Research , vol. 128, pp. 31-44